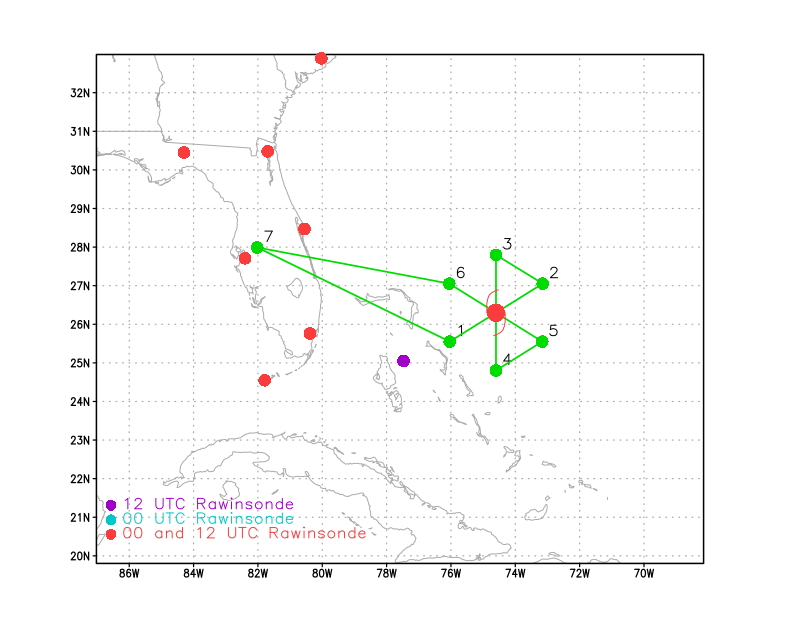
Figure 1. Flight plan for 20190831H2 mission for Dorian |
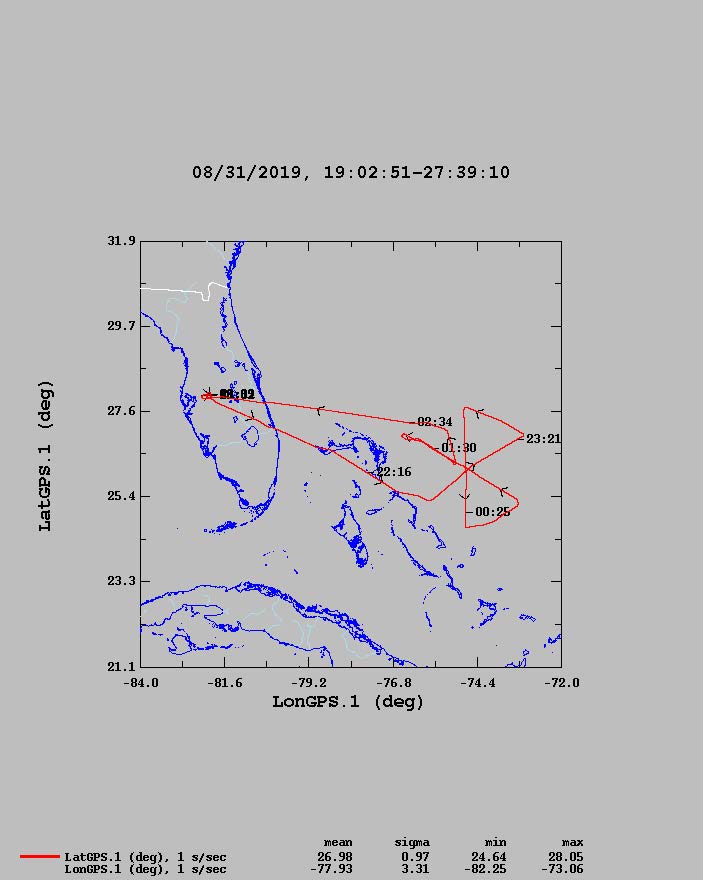
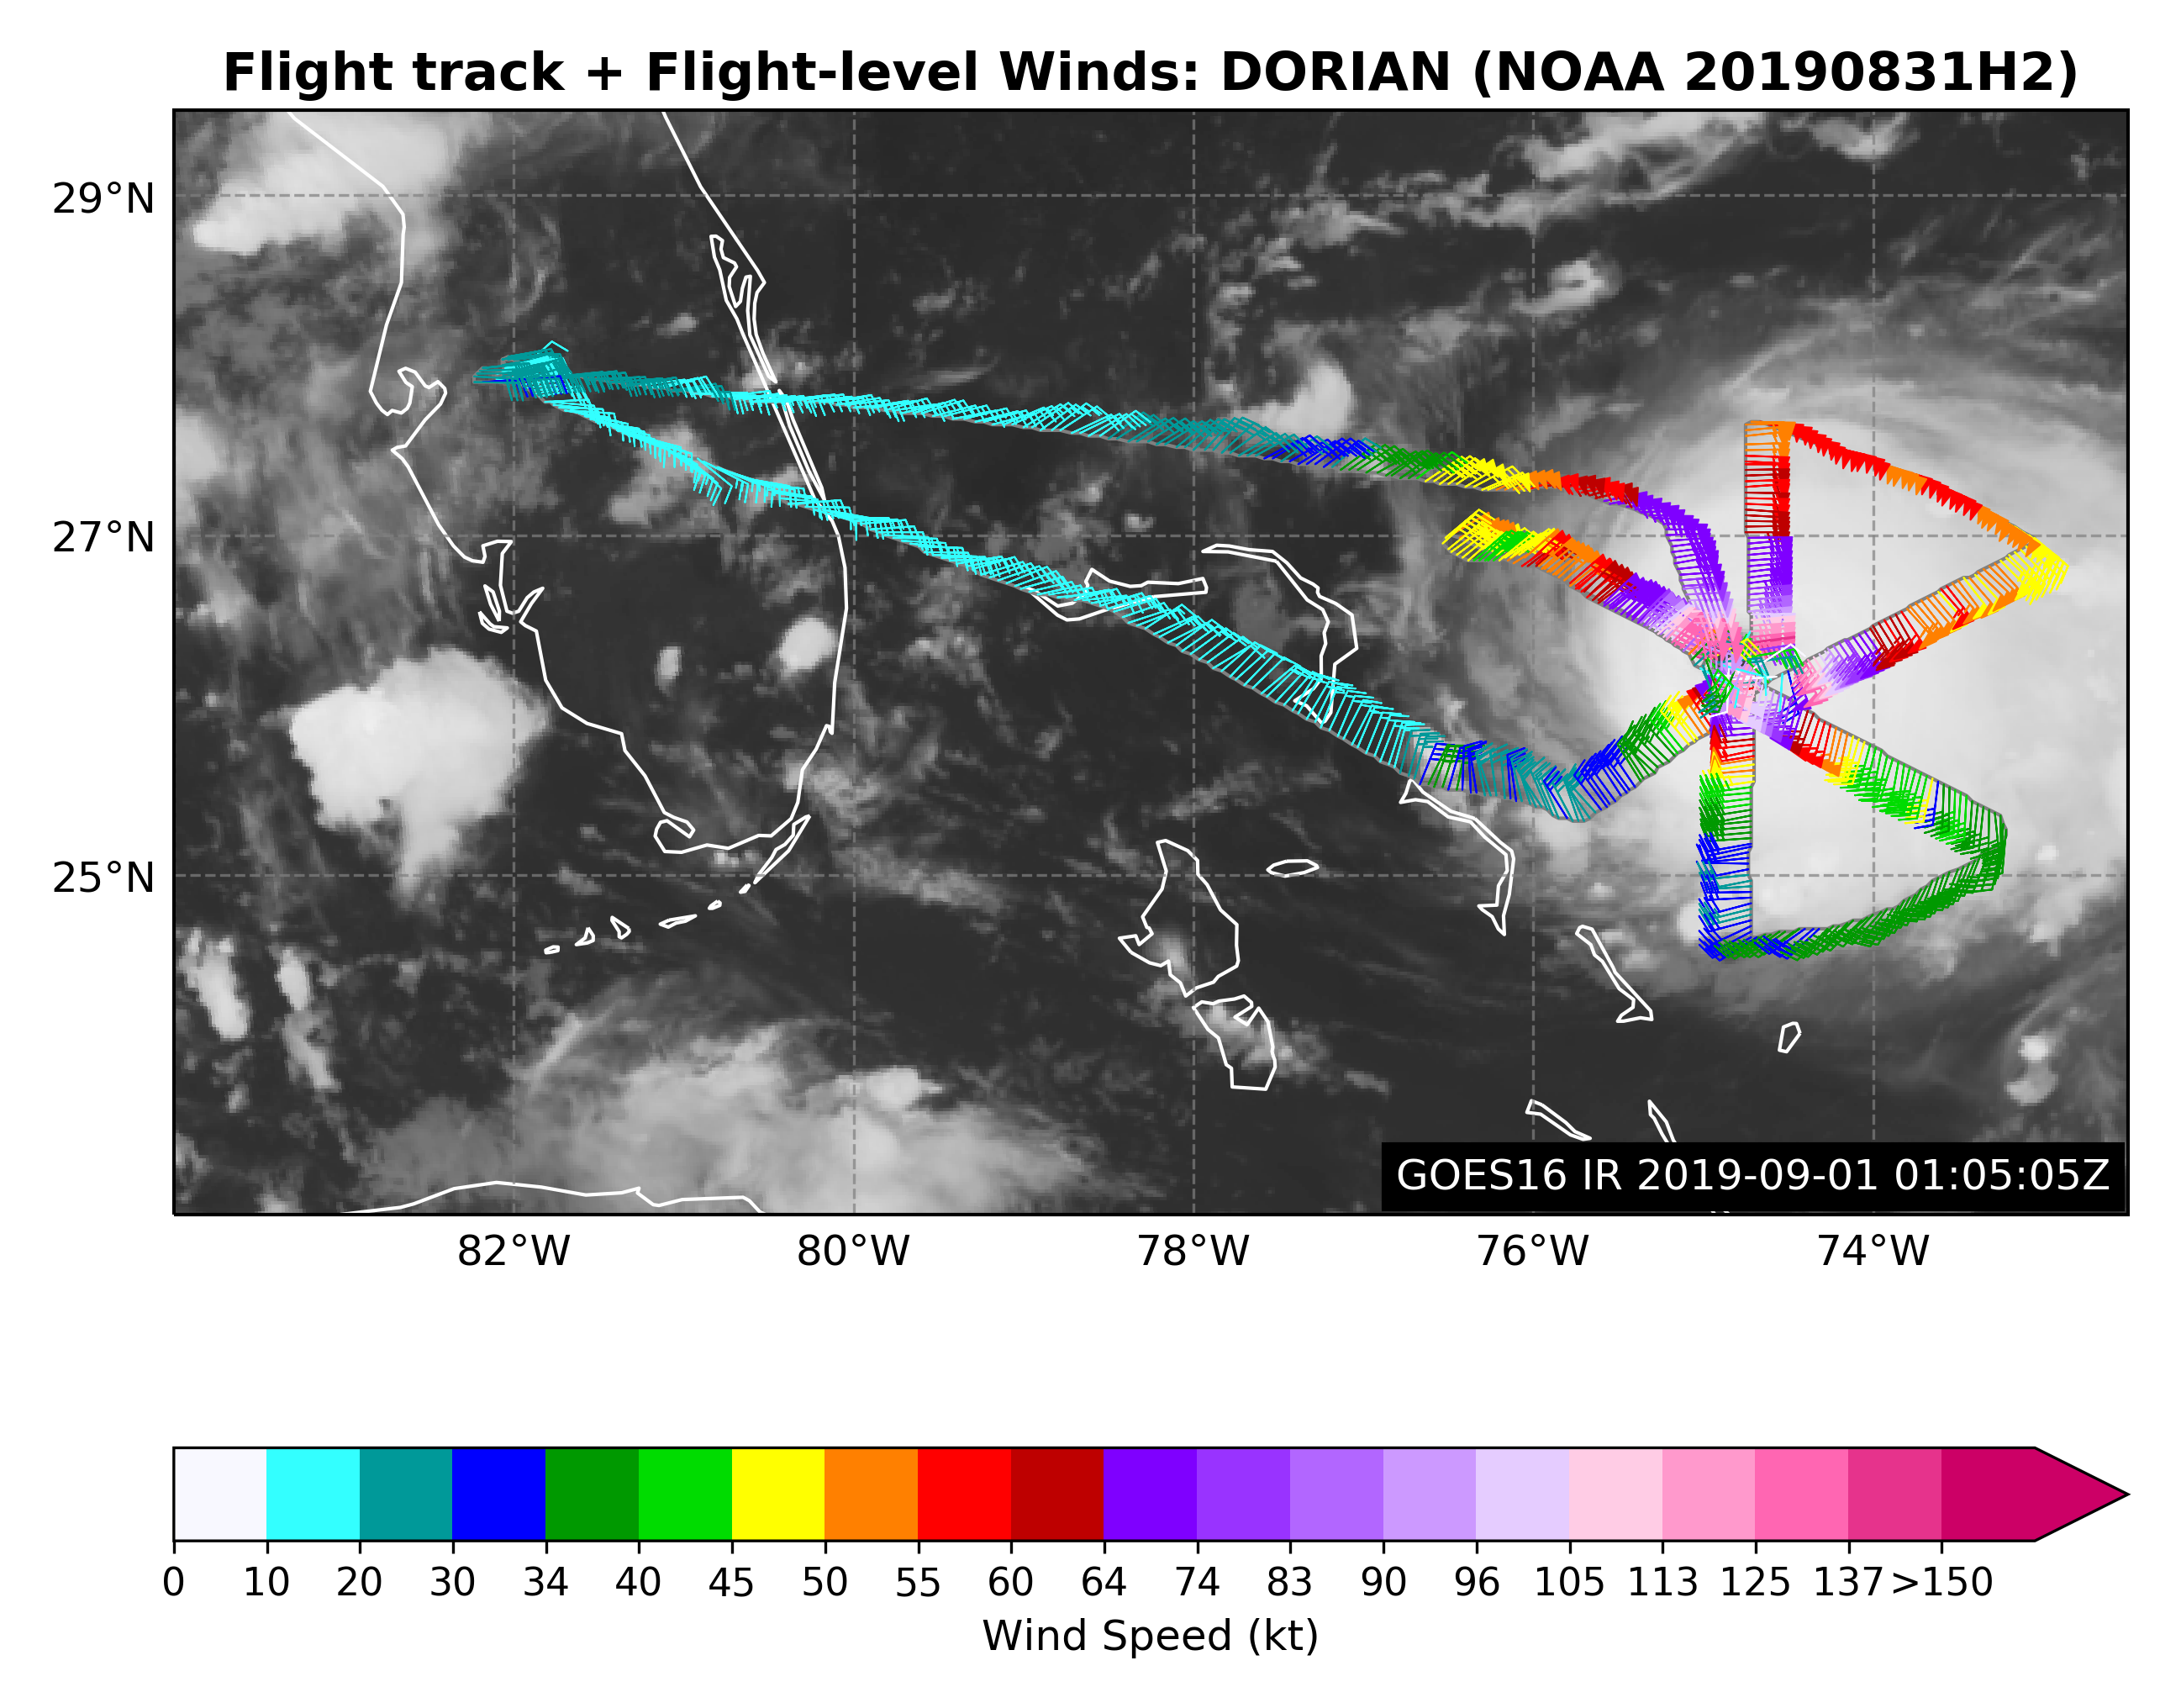
Figure 2. Actual flight track for 20190831H2 mission for Dorian |
| Aircraft Commander | Justin Kibbey |
| Co-pilot | John Rossi |
| Co-pilot | Adam Abittol |
| Flight Engineer | |
| Navigator | Sam Urato |
| Flight Director | Jack Parrish |
| System Engineer | |
| Data Technician |
| LPS | Andrew Hazelton | HRD |
| Dropsonde | Kathryn Sellwood | HRD |
| Radar | Rob Rogers | HRD |
| Observer | Zorana Jelenak | NESDIS |
| Observer | Joe Sapp | NESDIS |
| Guest | Marcus Garza | unk |
| Radar | John Gamache | HRD |
|
Figure 1. Flight plan for 20190831H2 mission for Dorian |
Figure 2. Actual flight track for 20190831H2 mission for Dorian |
Mission Plan :
his was an EMC-tasked NOAA42 Tail Doppler Radar (TDR) mission with a proposed butterfly pattern (Figure 1), as well as a NESDIS Ocean Winds add-on. The pattern was executed well.
Mission Summary :
| Take off | Landing
| Linder_Lakeland, FL
| 21:06 UTC
| Linder_Lakeland, FL
| 03:39 UTC
| Penetrations
|
| Expendables
| 30 sondes
| | ||||||
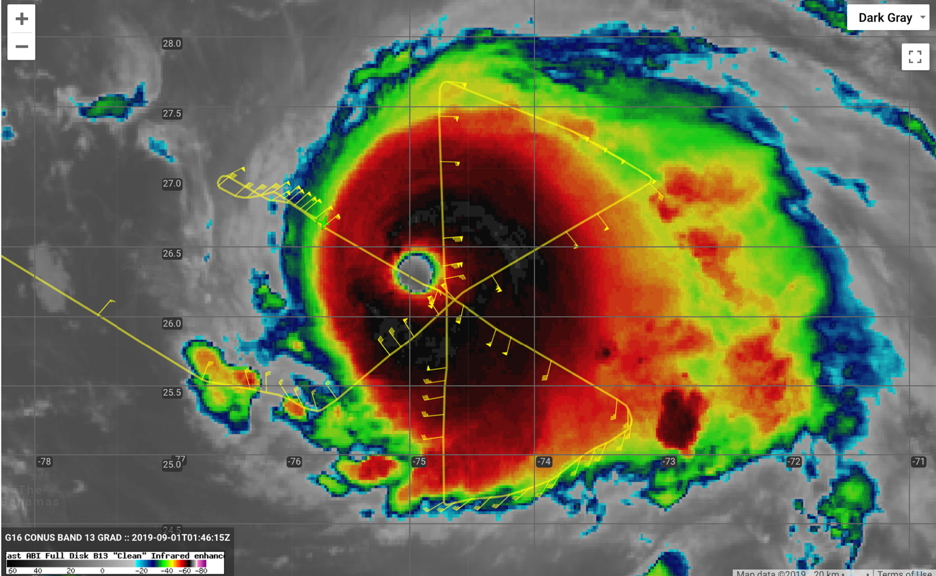
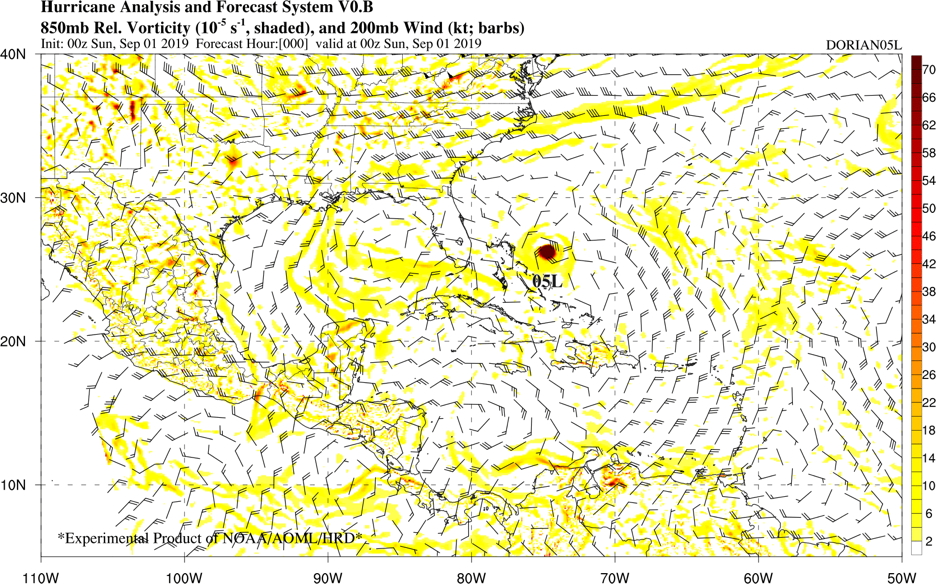
Dorian had strengthened from the previous day, and was a strong Category 4 hurricane with 130-knot winds during the flight. Figure 2 shows an infrared satellite image of Dorian during the time of the flight. The storm had grown in size (in terms of the CDO) and the core was more symmetric, although there was still some hint of asymmetry due to shear from the NW. Analzyed 200-hPa winds at this time showed that Dorian was embedded in an area of light upper-level flow, with a well-established outflow channel to the east and south of the TC.
|
Prepared by the Hurricane Research Division Aug. 28, 2019 12:15 PM EDT Aircraft: N42RF Proposed takeoff: 31/2100Z | |||||||
| DROP LOCATION TABLE | |||||||
| # | LAT | LON | RAD/AZMON | Time | |||
| deg min | deg min | deg nm | hr:min | ||||
| 1S | 25 33 | 76 02 | 90/240 | 1:06 | |||
| 2S | 27 03 | 73 09 | 90/060 | 1:52 | |||
| 3S | 27 48 | 74 36 | 90/360 | 2:15 | |||
| 4S | 24 48 | 74 36 | 90/180 | 3:01 | |||
| 5S | 25 33 | 73 10 | 90/120 | 3:24 | |||
| 6S | 27 03 | 76 03 | 90/300 | 4:10 | |||
Mission Evaluation / Problems :

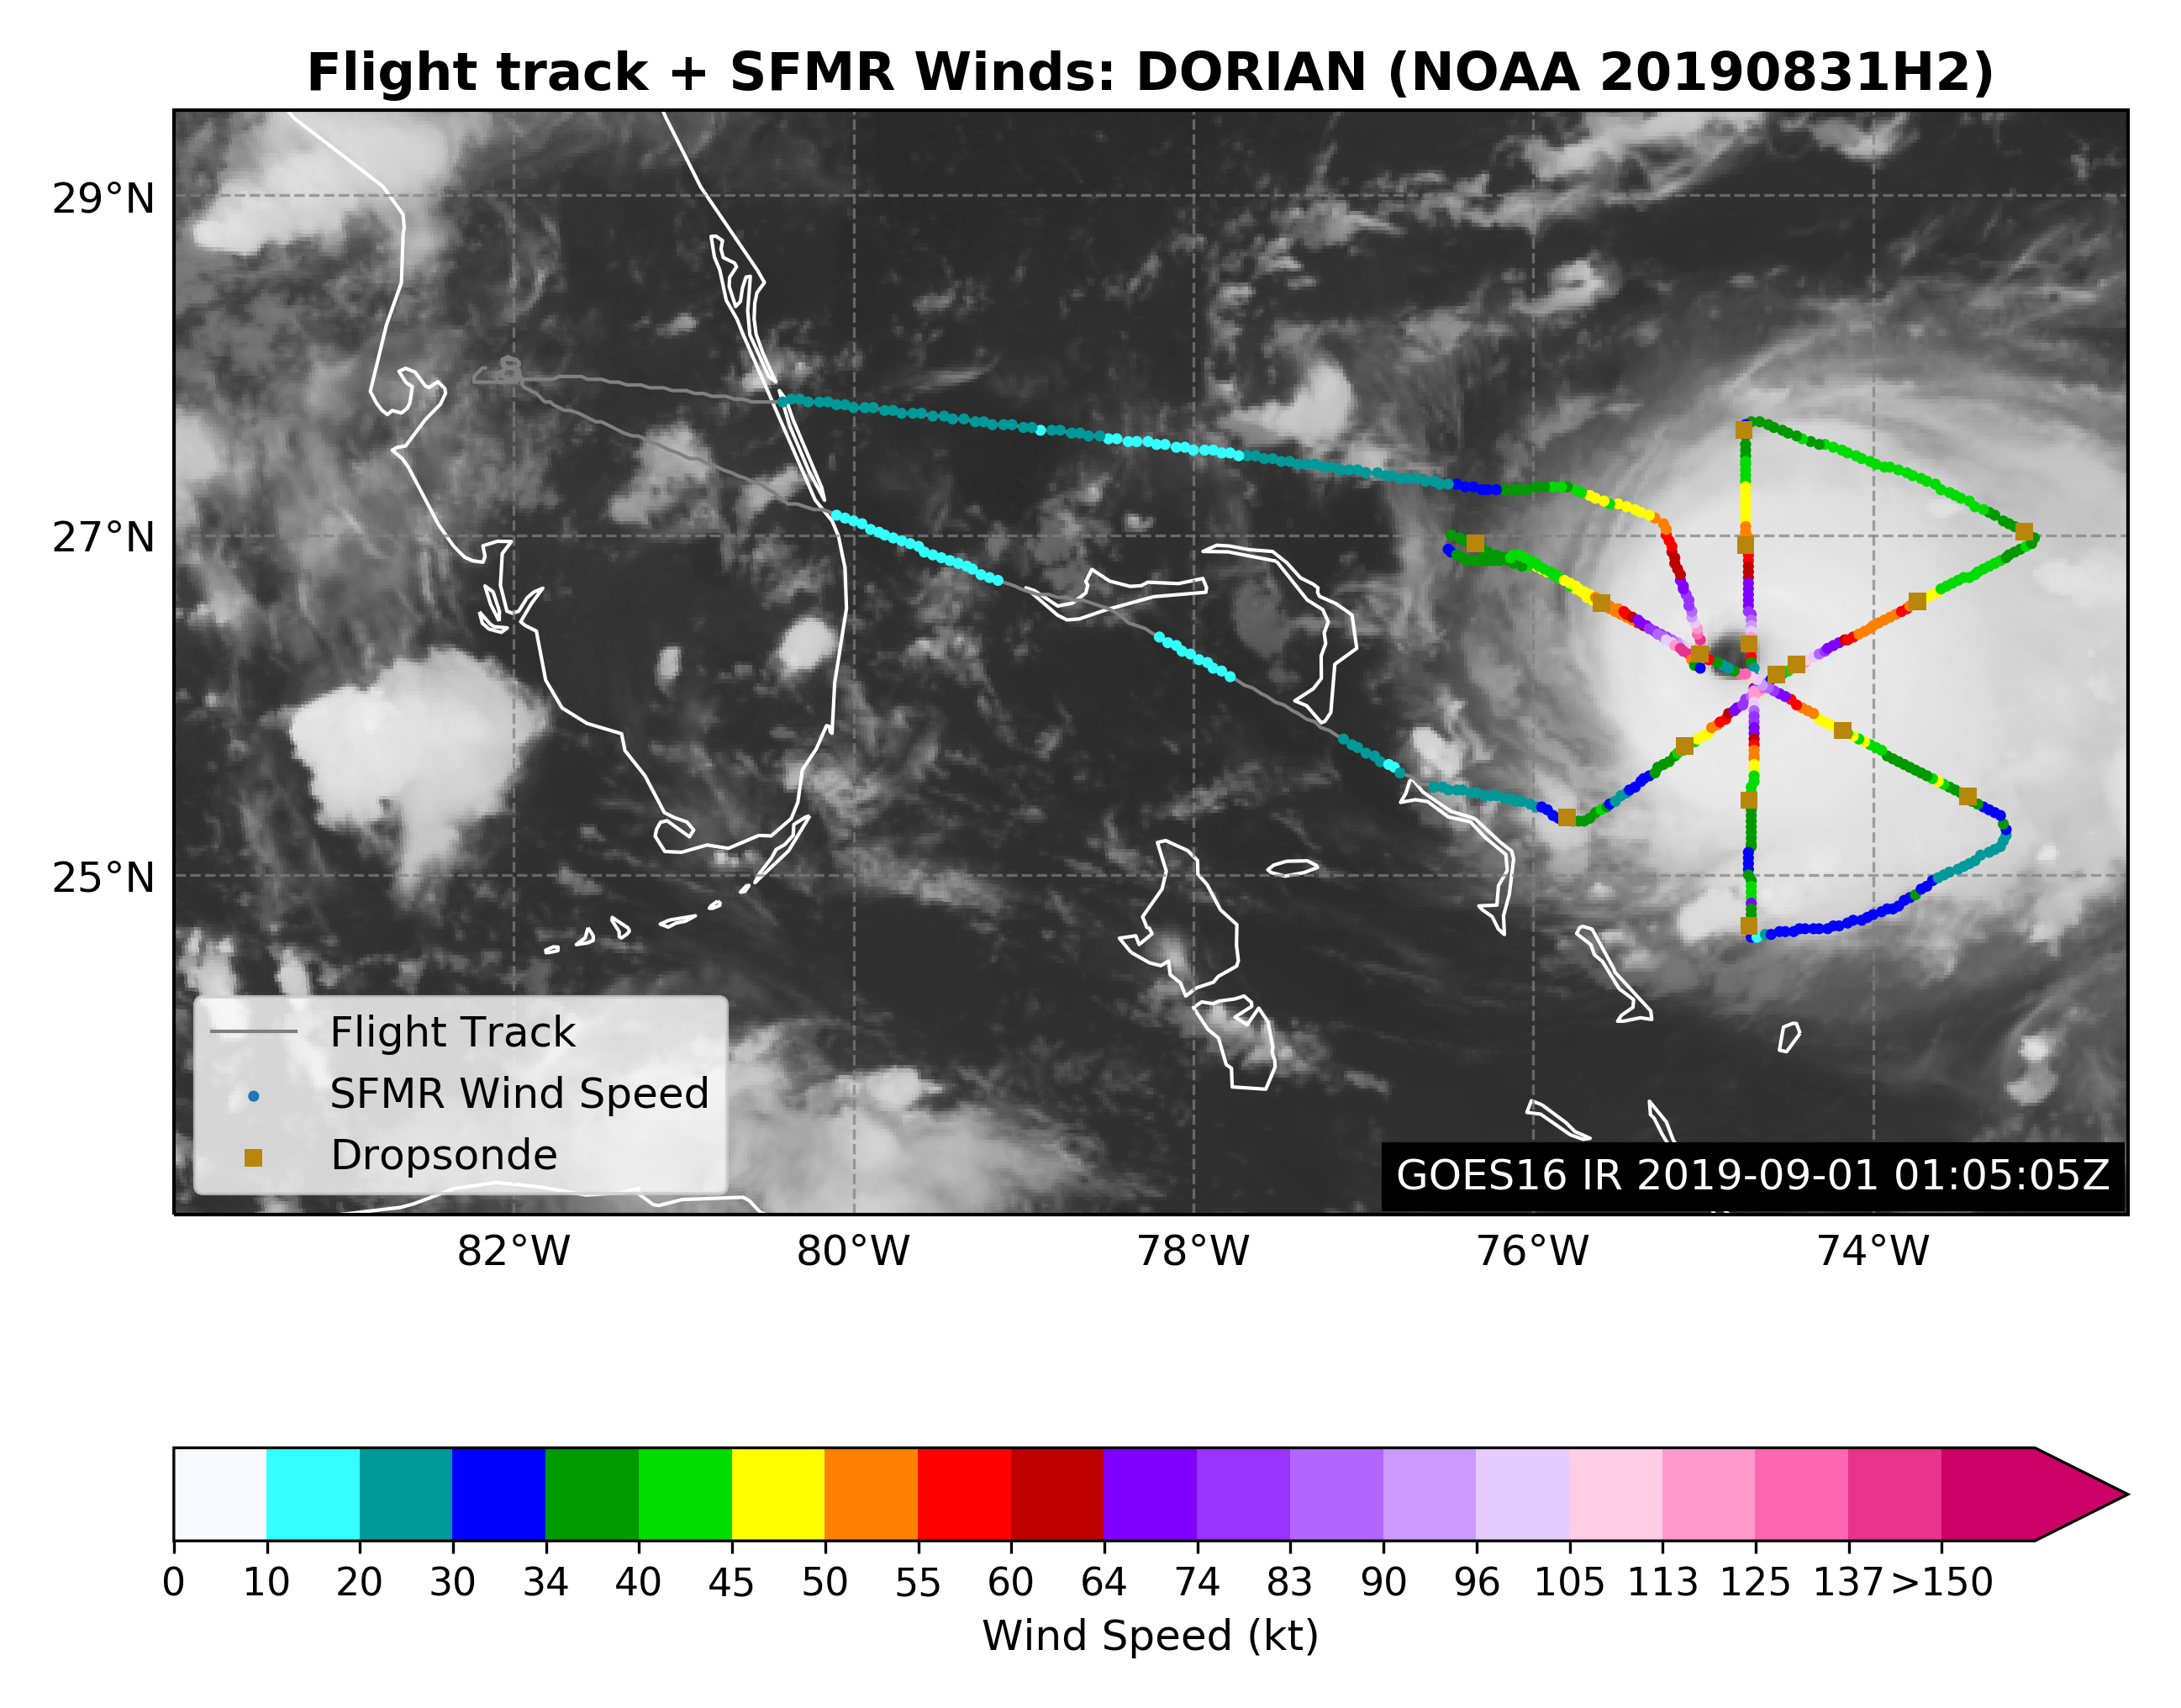
Figure 6: SFMR wind speed (colors) and dropsonde locations (brown squares) along the flight track during the 20190831H2 mission (Image from Heather Holbach). |
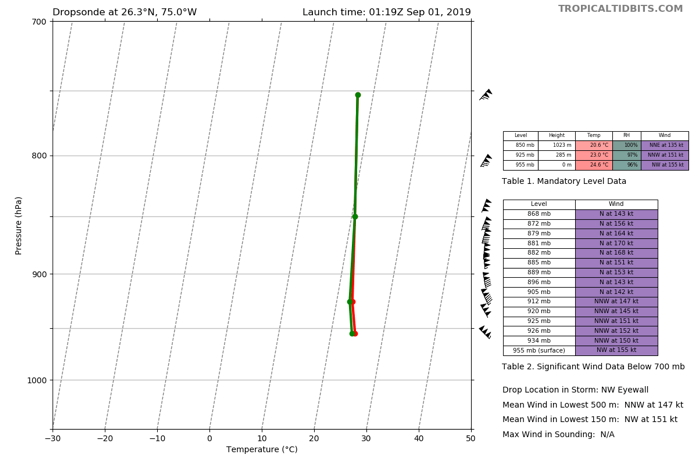
The mission was successful in gathering and delivering TDR data. 3 successful passes across the center were made, and two NESDIS ocean-winds passes through the eyewall were also accomplished (Figure 6). There were no major problems with the flight. 31 sondes were dropped and the data was good on 30 of the 31. No AXBTs were dropped on this mission. The data gathered throughout the flight showed a storm that had continued to intensify to the threshold of Category 5 status, with flight level winds of ~145 kt and SFMR winds of ~150 kt (Figure 7). These values were supported by dropsonde winds, including one sonde with 151 kt mean winds in the lowest 150 m of the sounding (Figure 8).
 Flight level wind along track |
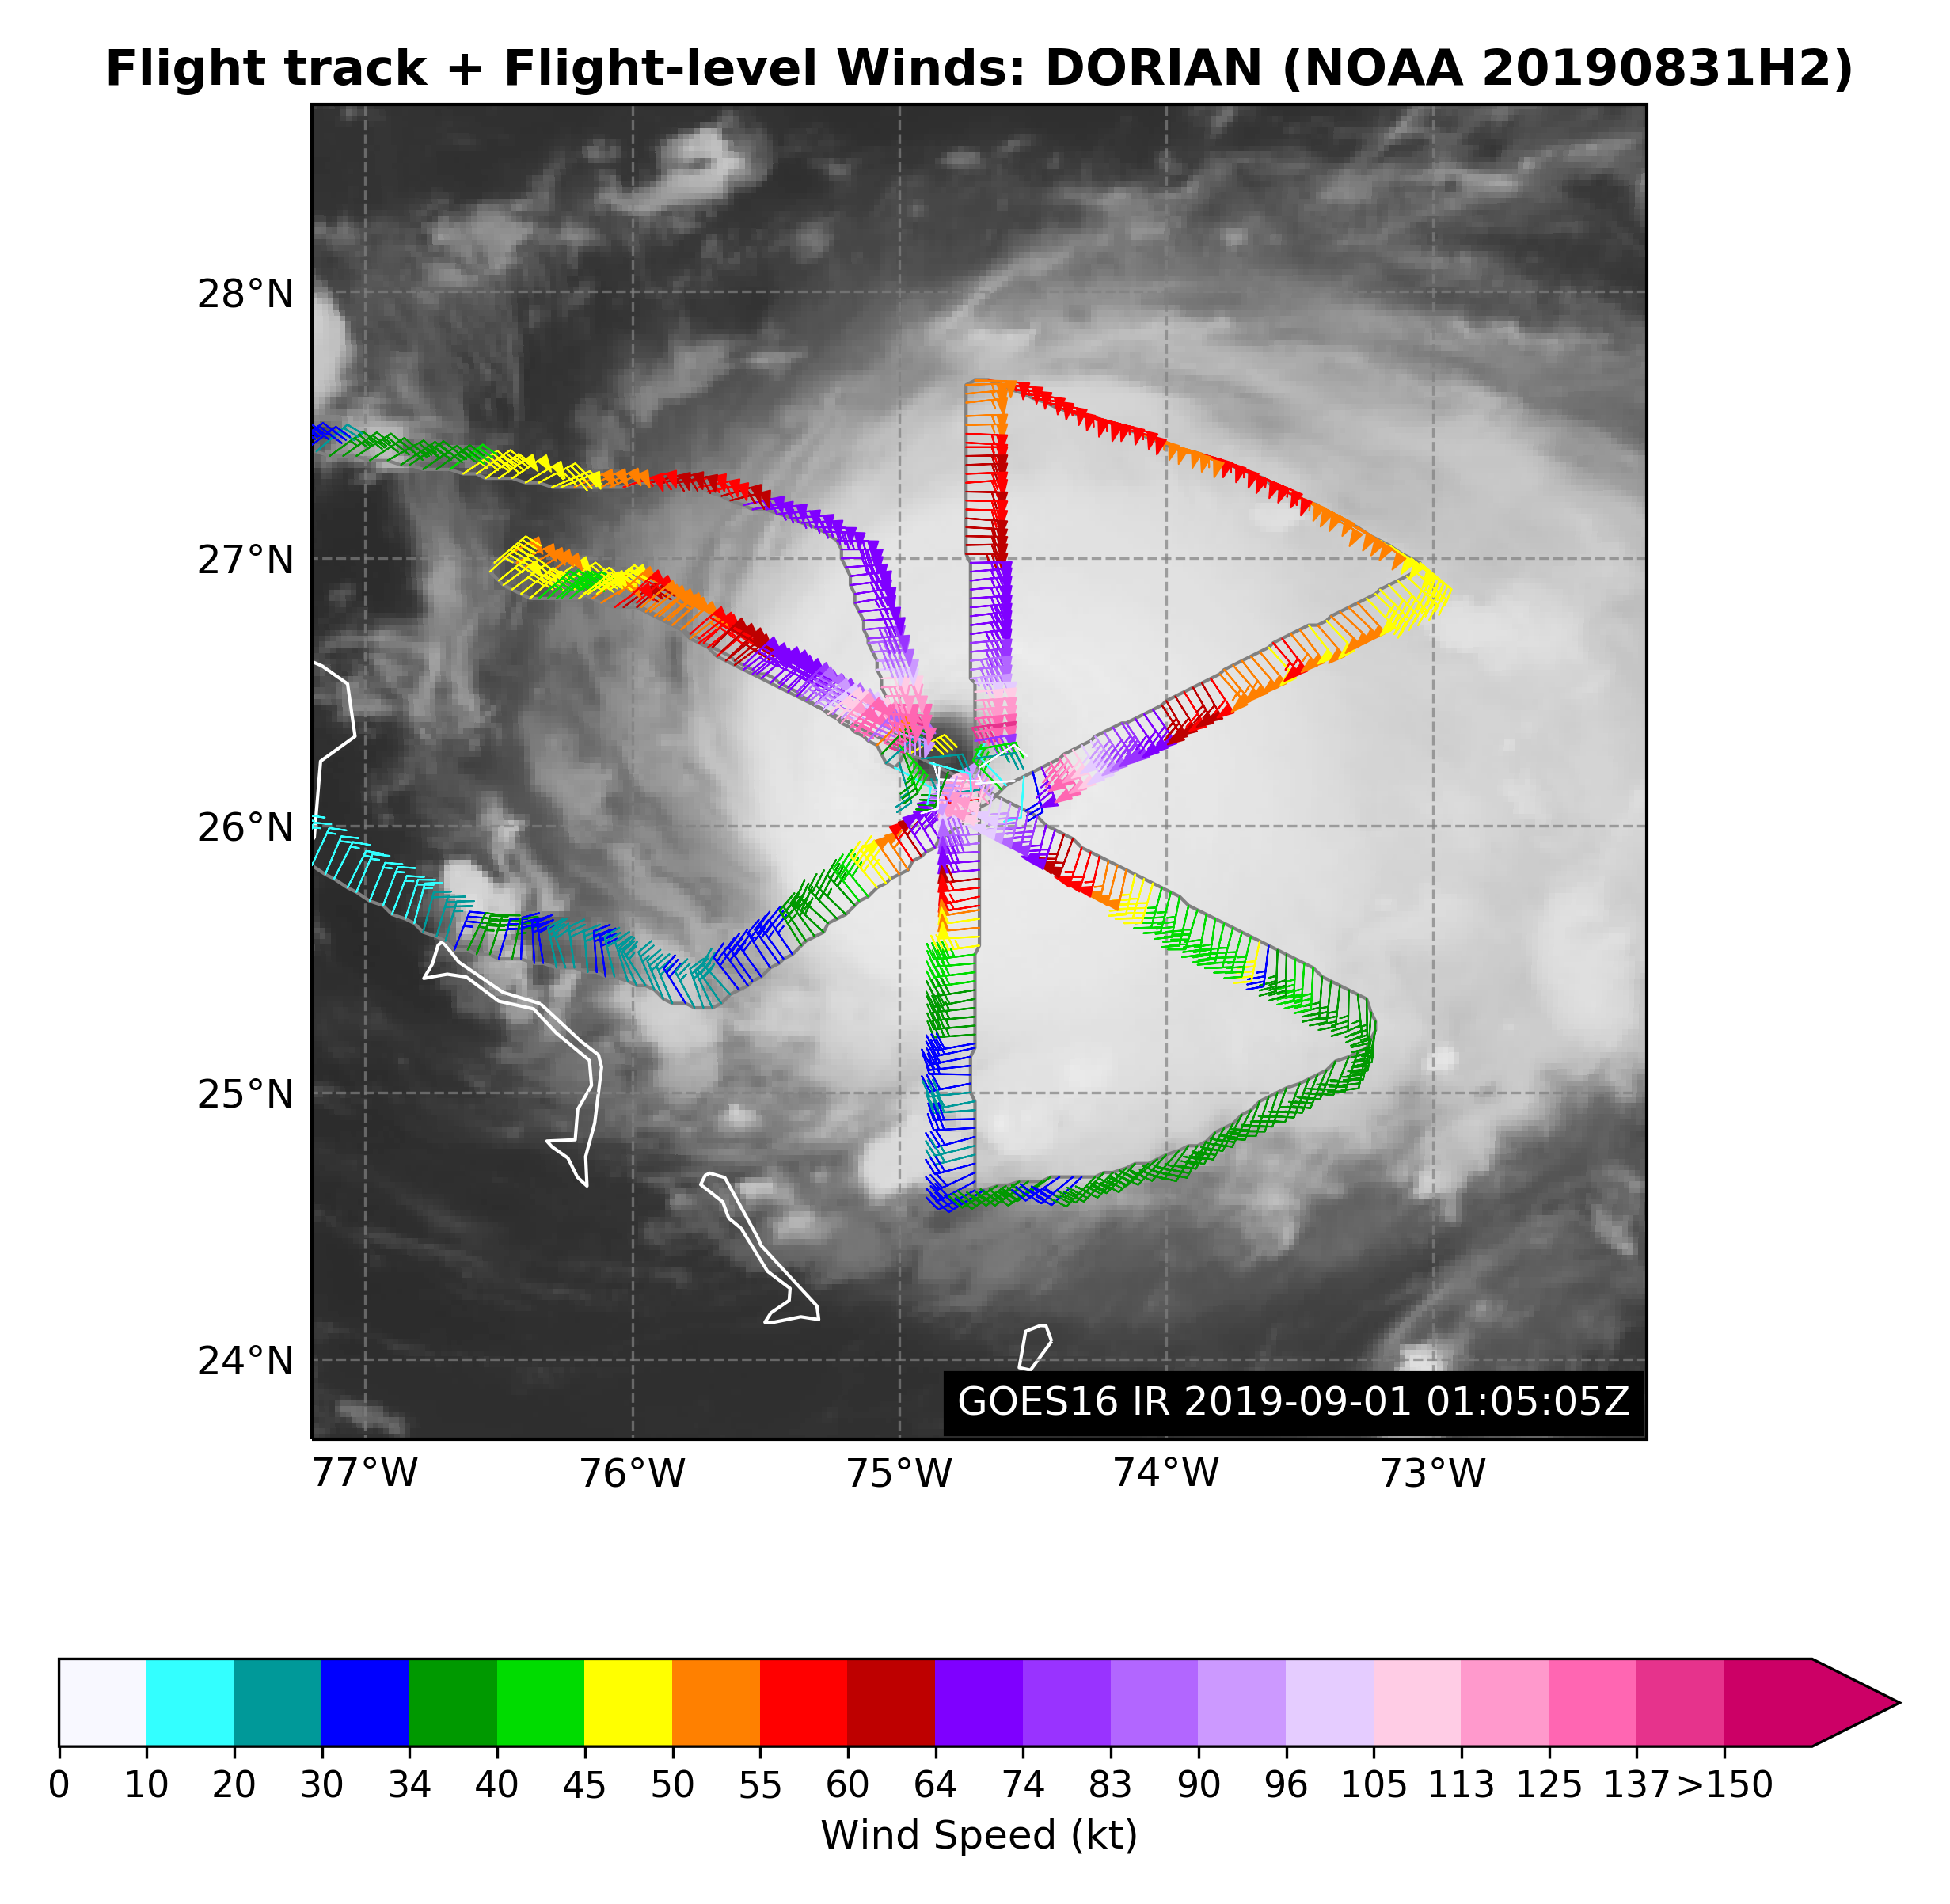 Flight level wind along track in storm |
 SFMR wind along flight track |
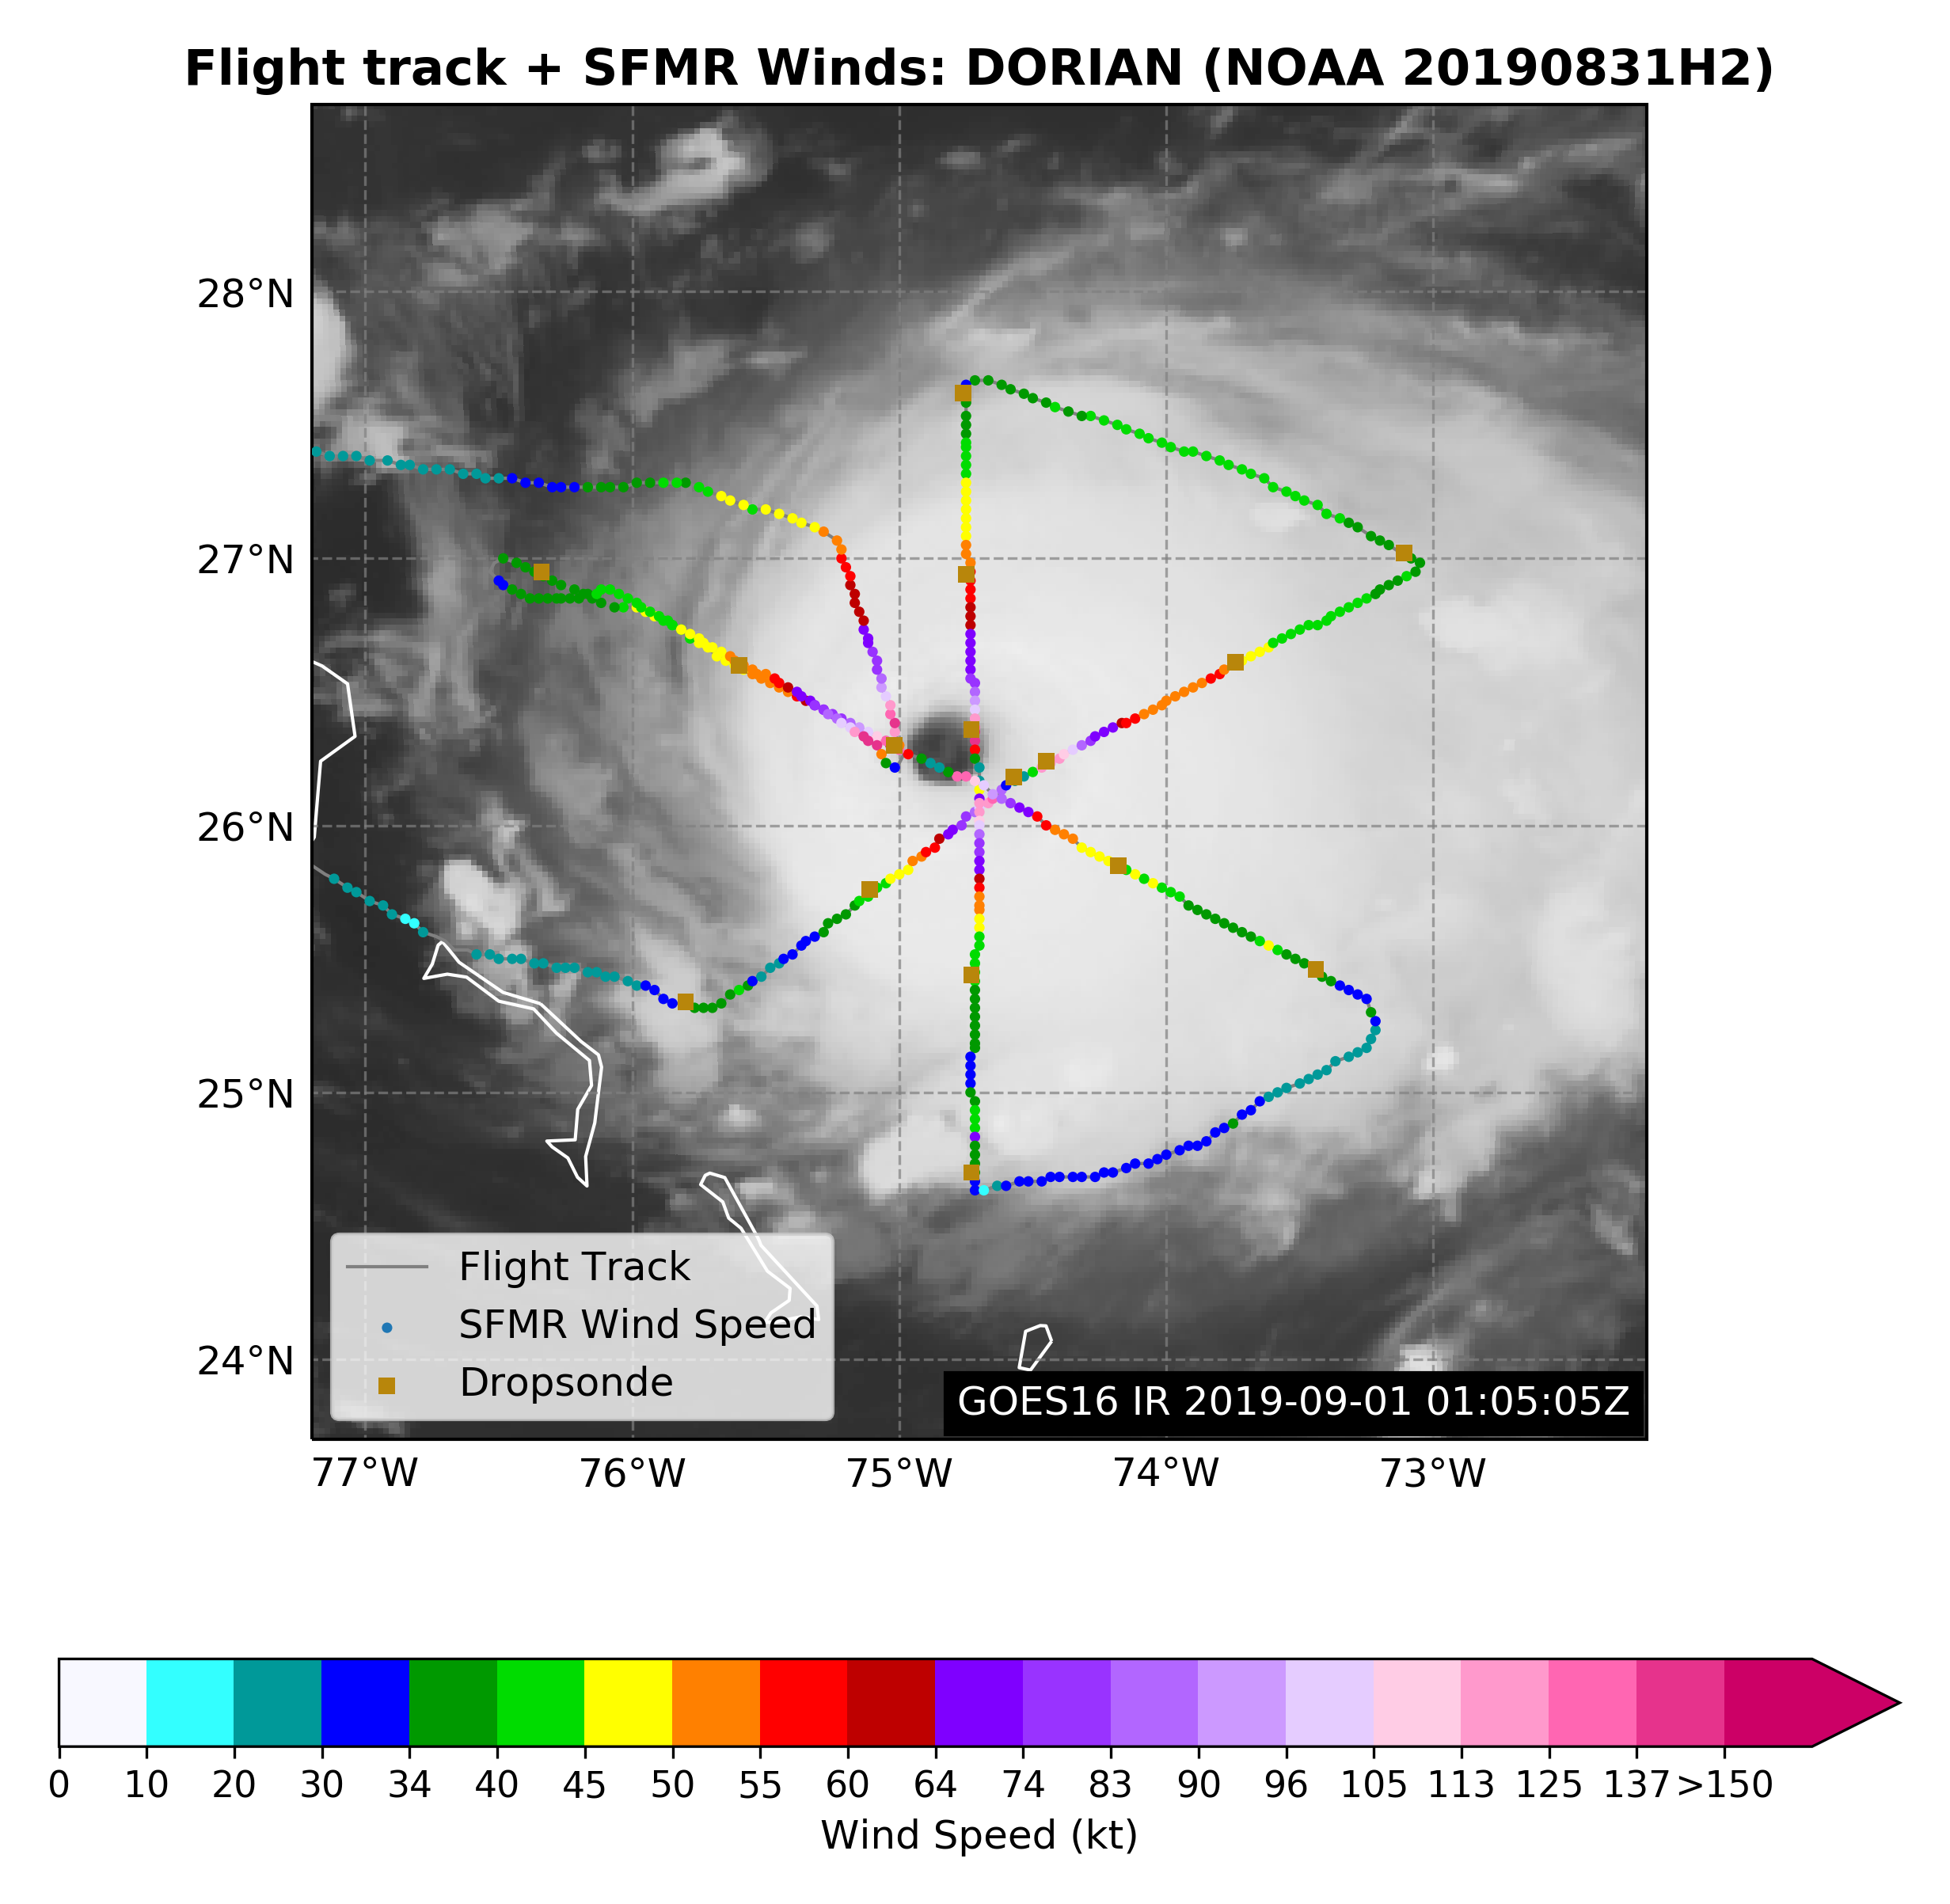 SFMR wind along flight track in storm |
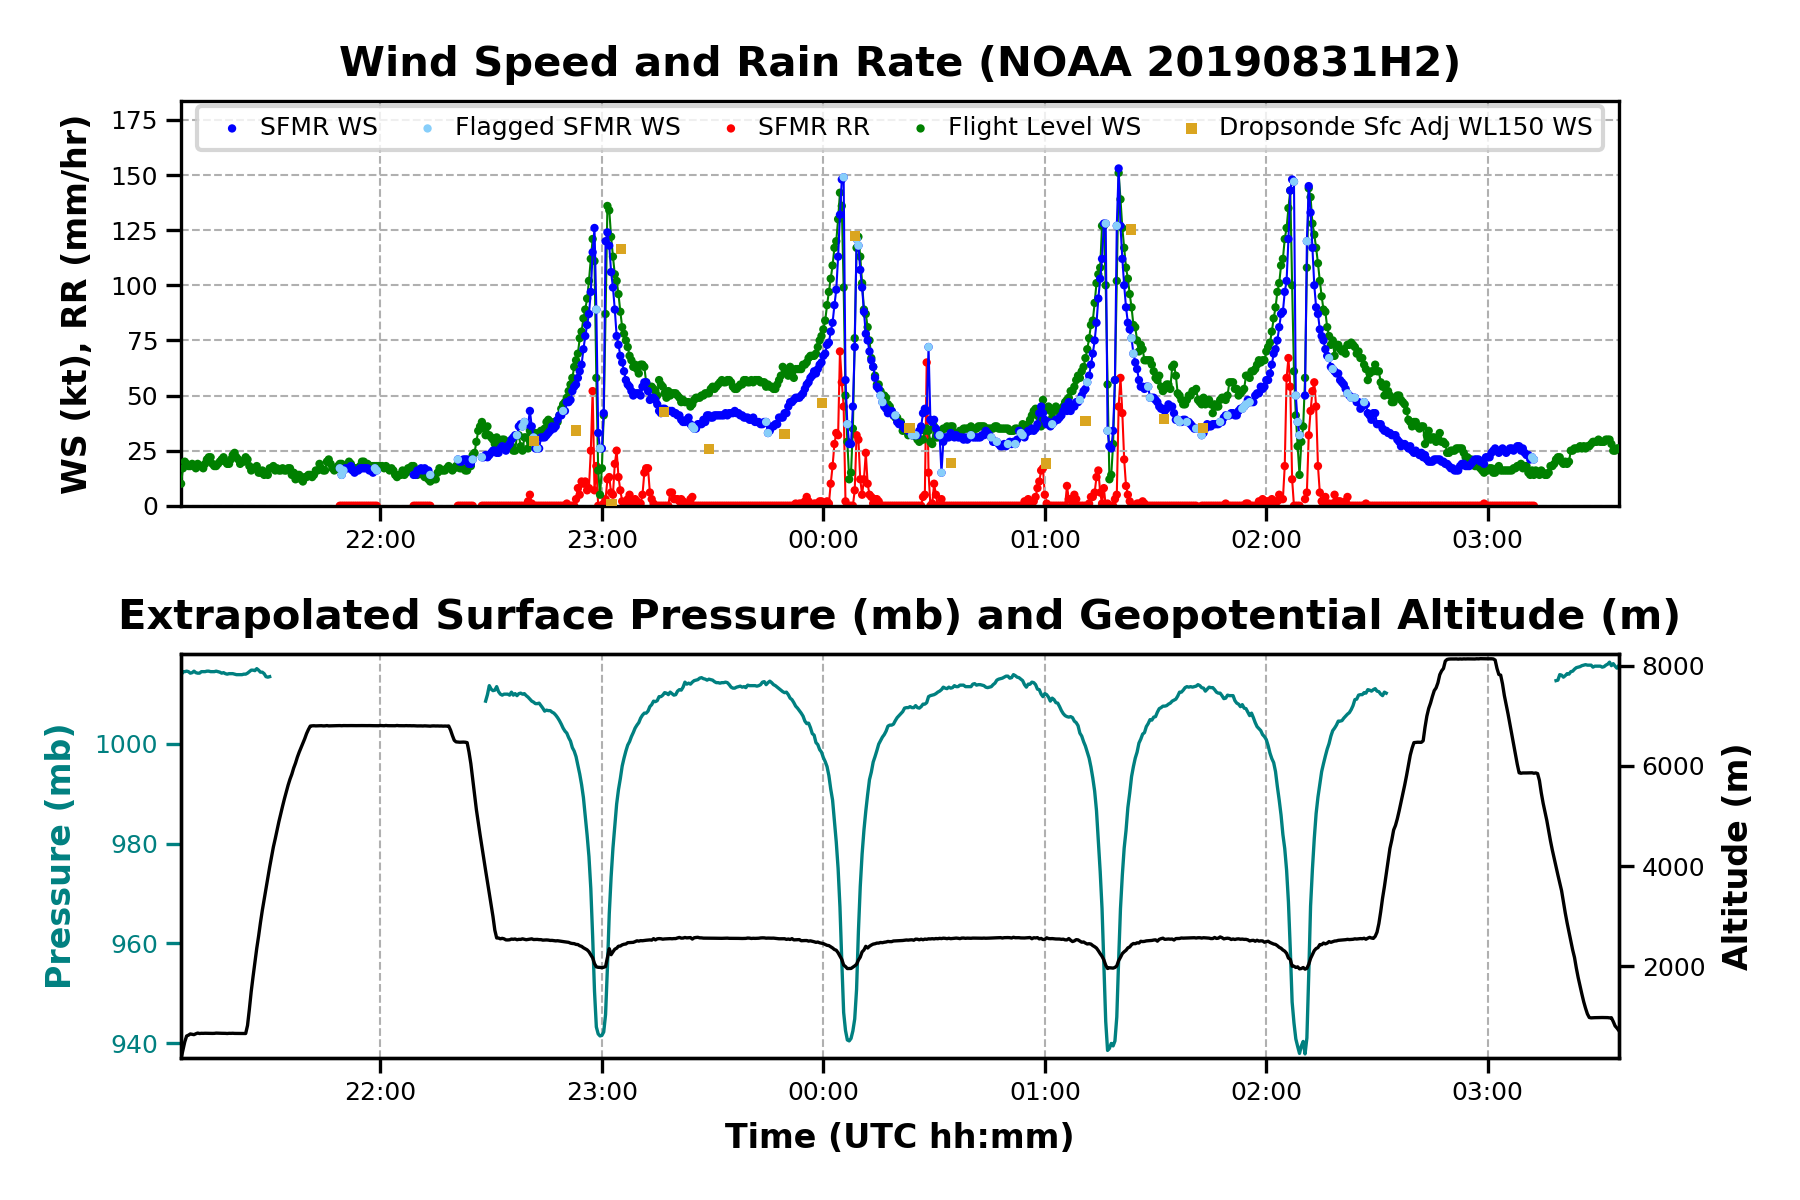 Altitude, Pressure, Rain Rate, and Wind |
|
LPS log | Radar log | Drop log Flight Director's log | Flight Director's manifest | NetCDF data |