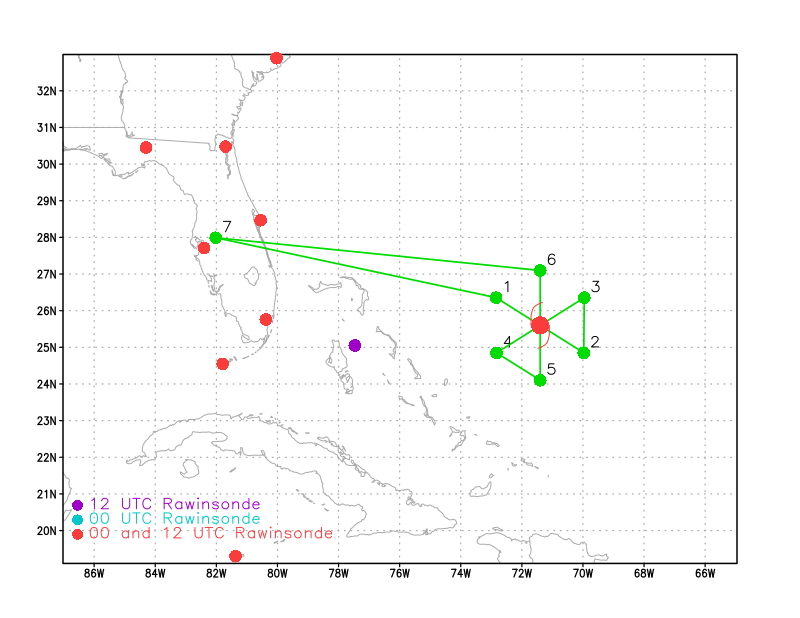
Figure 1a. Flight plan for 20190830H2 mission for Dorian |
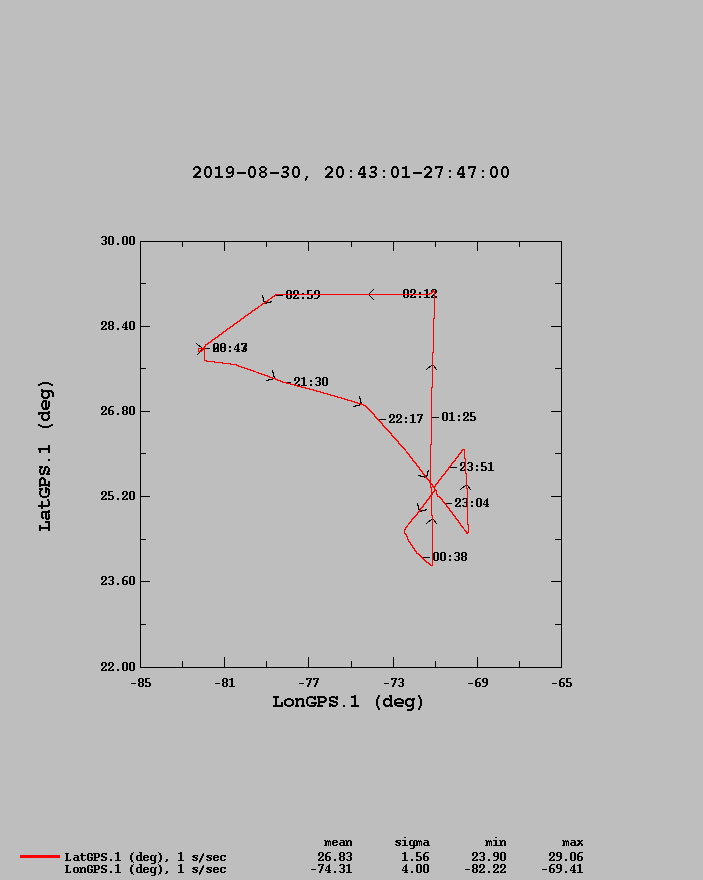
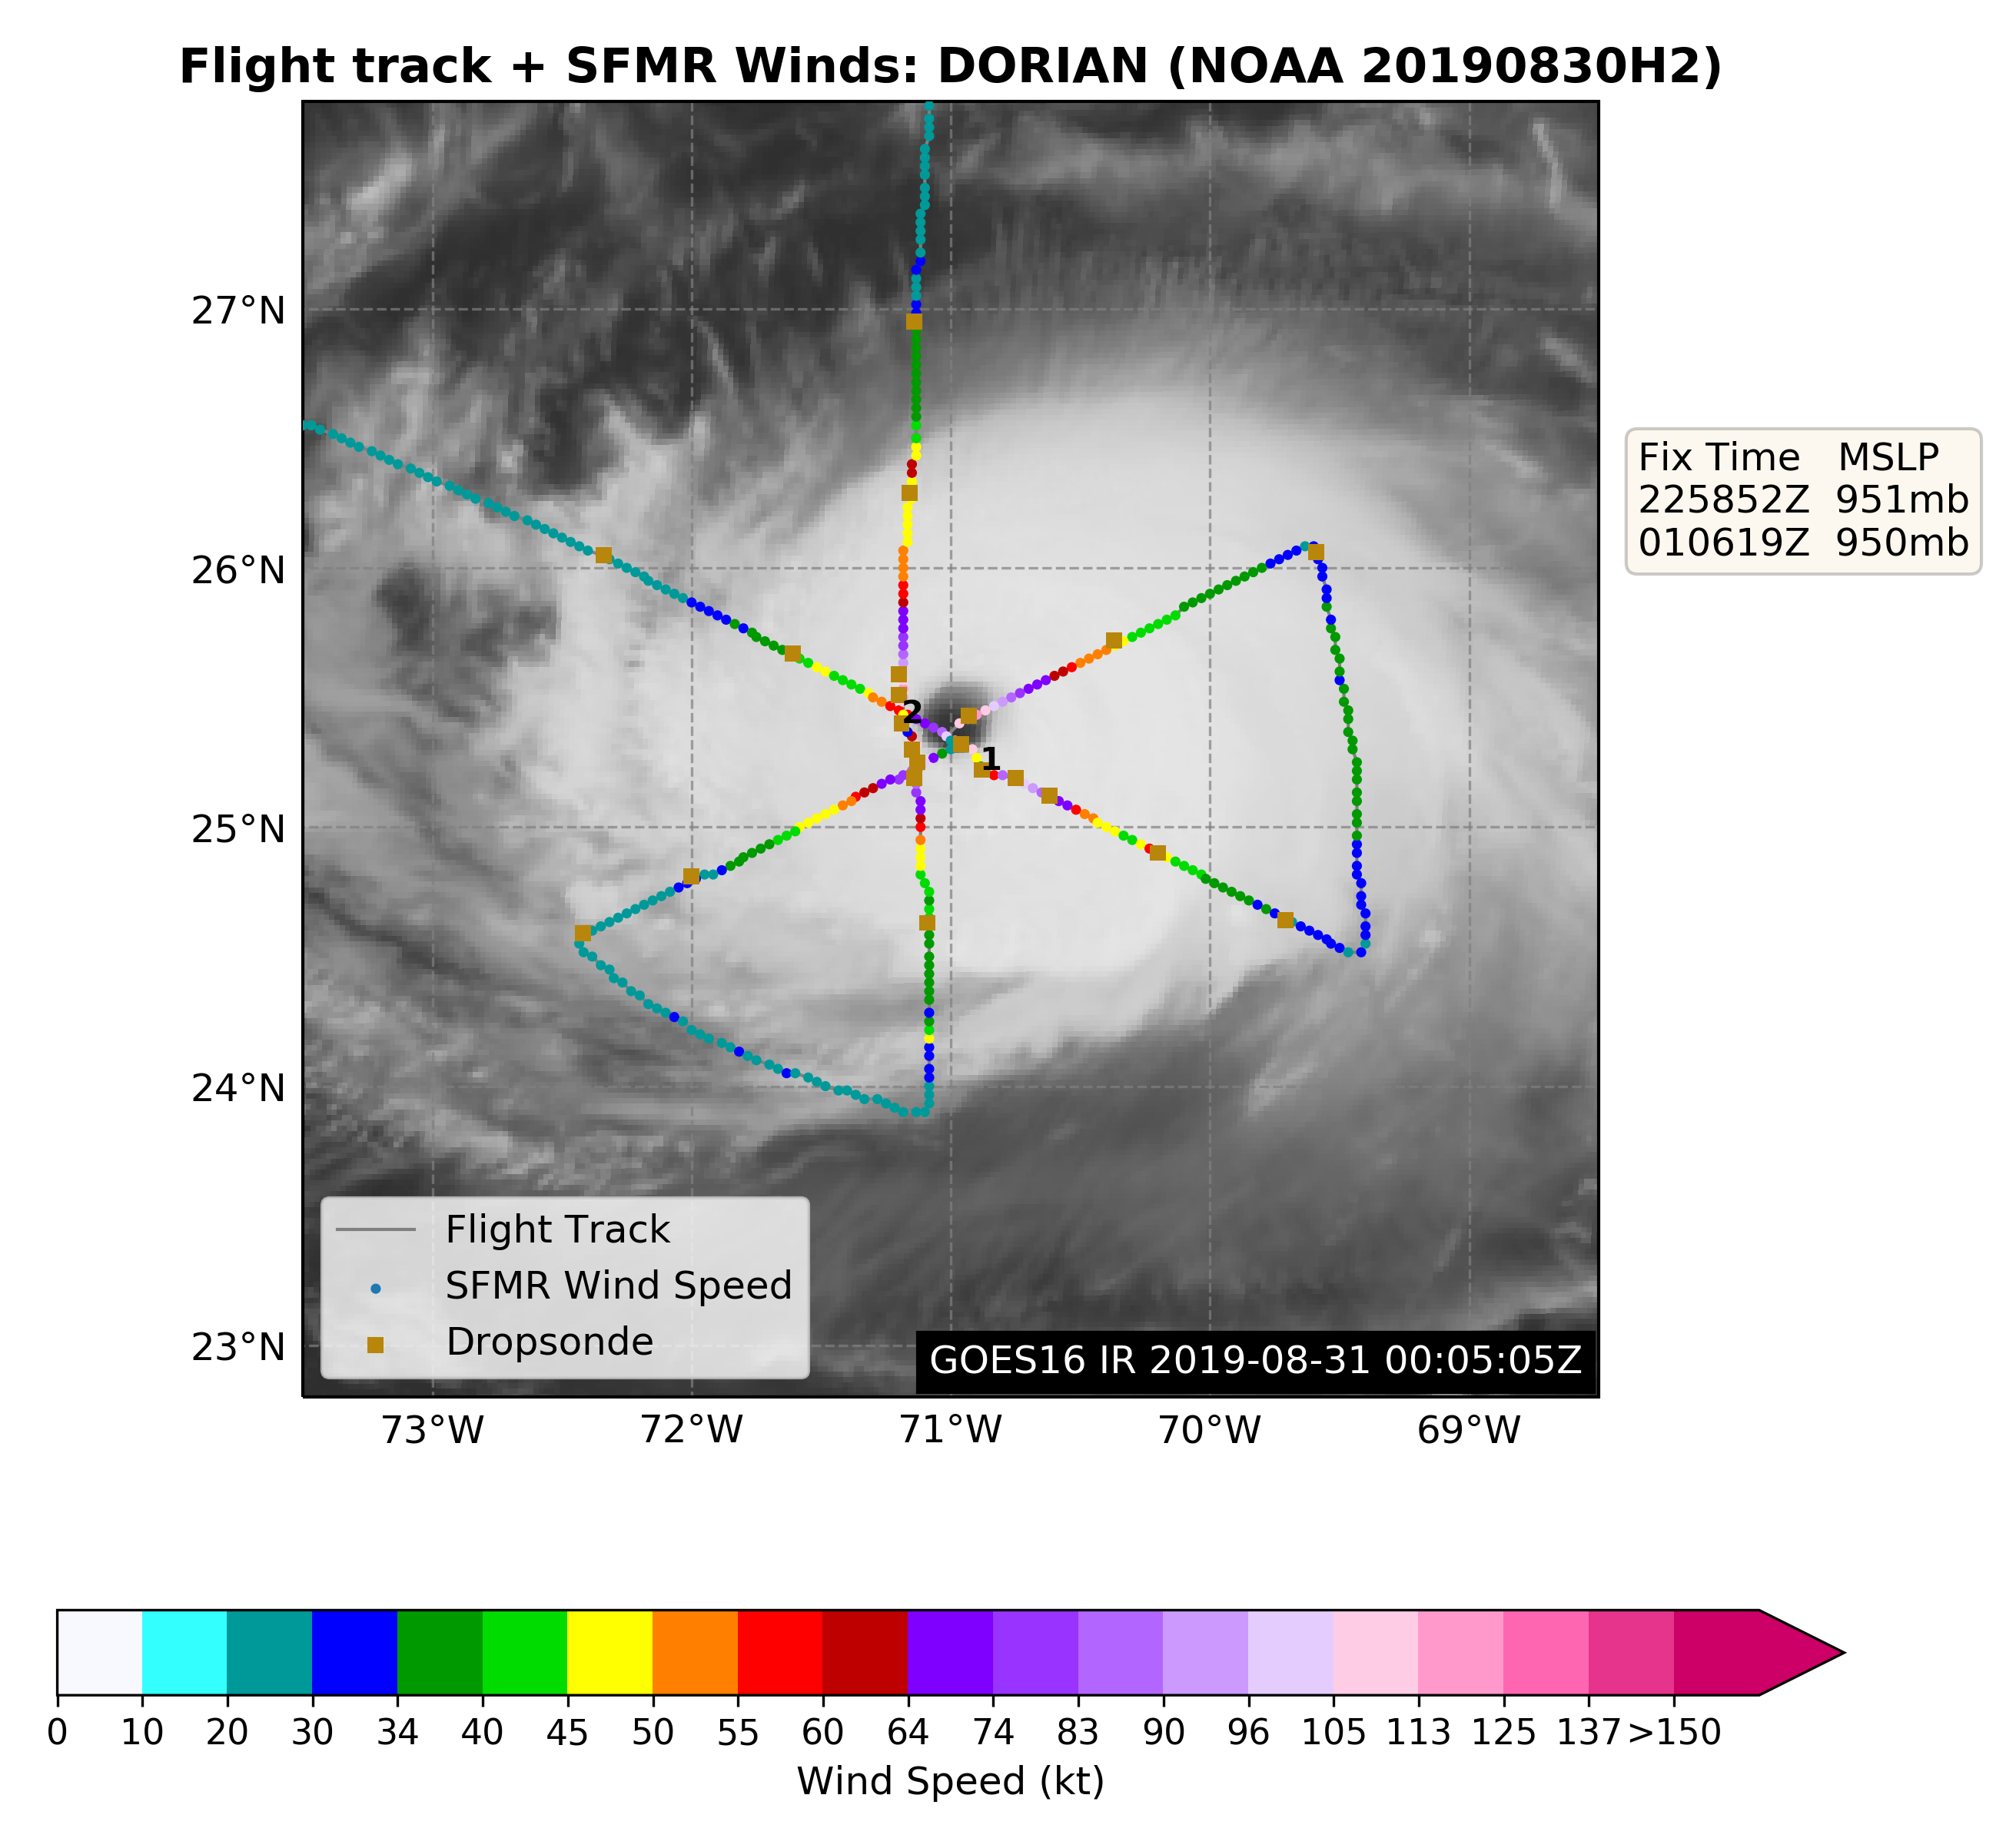
Figure 1b. Actual Flight track for 20190830H2 mission for Dorian |
| Aircraft Commander | Justin Kibbey |
| Co-pilot | John Rossi |
| Co-pilot | Adam Abittol |
| Flight Engineer | Mike Sanchez |
| Flight Engineer | Tuffnel |
| Navigator | Sam Urato |
| Flight Director | Ian Sears |
| Flight Director | Jack Parrish |
| System Engineer | Mac McAllister |
| Data Technician | Mike Mascaro |
| AVAPS | Todd Richards |
| Observer | James McFadden |
| LPS | Andrew Hazelton | HRD |
| Dropsonde | Kathryn Sellwood | HRD |
| Radar | Rob Rogers | HRD |
| Observer | Zorana Jelenak | NESDIS |
| Observer | Joe Sapp | NESDIS |
| Observer | Todd Reid | |
| Observer | Shaffer Shasta |
| Radar | John Gamache | HRD |
|
Figure 1a. Flight plan for 20190830H2 mission for Dorian |
Figure 1b. Actual Flight track for 20190830H2 mission for Dorian |
Mission Plan :
This was an EMC-tasked Tail Doppler Radar (TDR) mission with a proposed butterfly pattern (Figure 1). The pattern was executed nearly perfectly.
Mission Summary :
| Take off | Landing
| Linder_Lakeland, FL
| 20:43 UTC
| Linder_Lakeland, FL
| 03:47 UTC
| Penetrations
| 3
| Expendables
| 33 GPS all good
| AXBT 2 good, 1 bad | ||||||
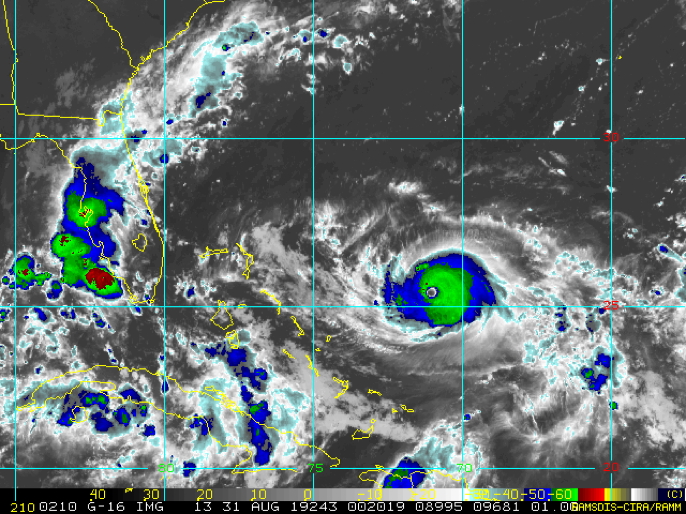
Figure 2: GOES-16 infrared satellite image captured at 0020 UTC 31 August 2019 (RAMSDIS-CIRA) |
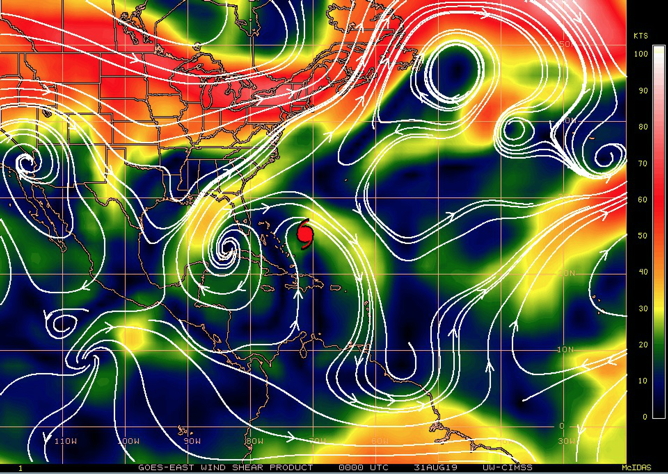
Figure 3: 850-200 hPa vertical shear analysis from UW-CIMSS at 00 UTC 31 August 2019. |
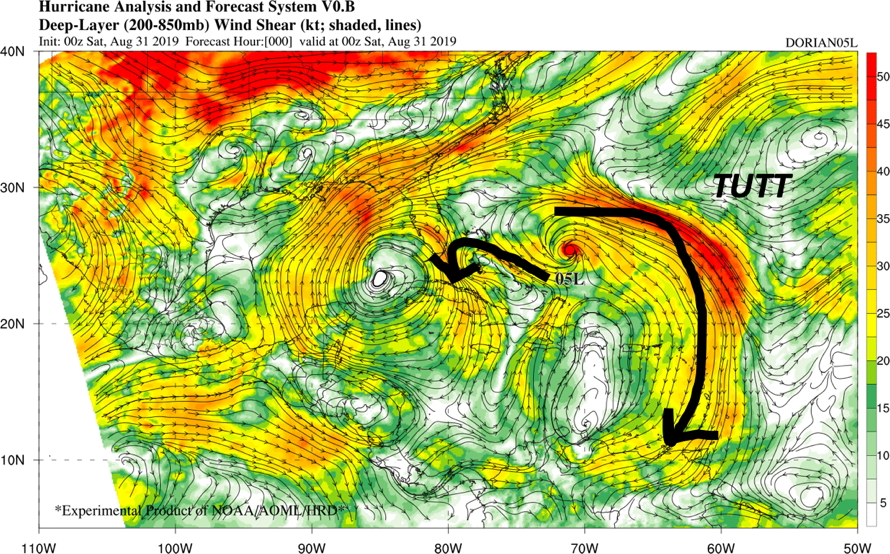
Figure 4: Hurricane Analysis and Forecast System (HAFS) analysis of 850-200 hPa shear. The two outflow channels aided by upper-level lows to the southwest and northeast of Dorian are highlighted. |
|
Prepared by the Hurricane Research Division Aug. 28, 2019 12:15 PM EDT Aircraft: N42RF Proposed takeoff: 30/2030Z | |||||||
| DROP LOCATION TABLE | |||||||
| # | LAT | LON | RAD/AZMON | Time | |||
| deg min | deg min | deg nm | hr:min | ||||
| 1S | 26 21 | 72 51 | 90/300 | 1:33 | |||
| 2S | 24 51 | 69 58 | 90/120 | 2:19 | |||
| 3S | 26 21 | 69 57 | 90/060 | 2:42 | |||
| 4S | 24 51 | 72 50 | 90/240 | 3:28 | |||
| 5S | 24 06 | 71 24 | 90/180 | 3:51 | |||
| 6S | 27 06 | 71 24 | 90/360 | 4:37 | |||
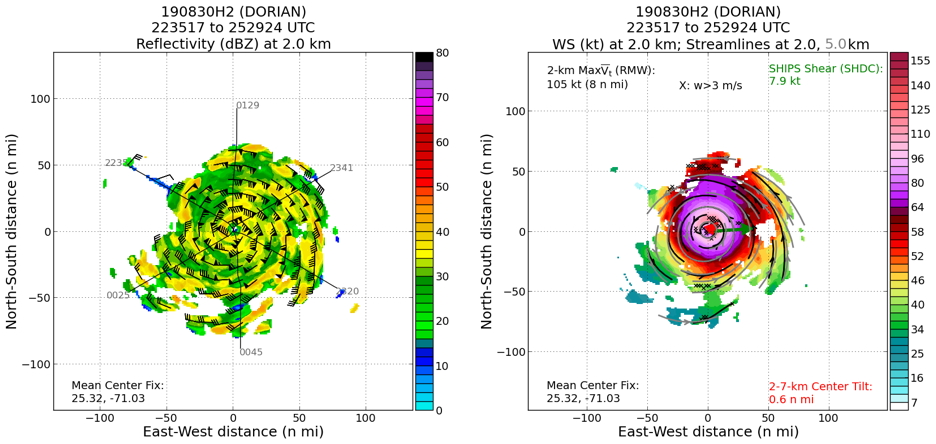
Figure 5: 2-km TDR reflectivity/wind for the 20190830H2 mission (image from Paul Reasor). |
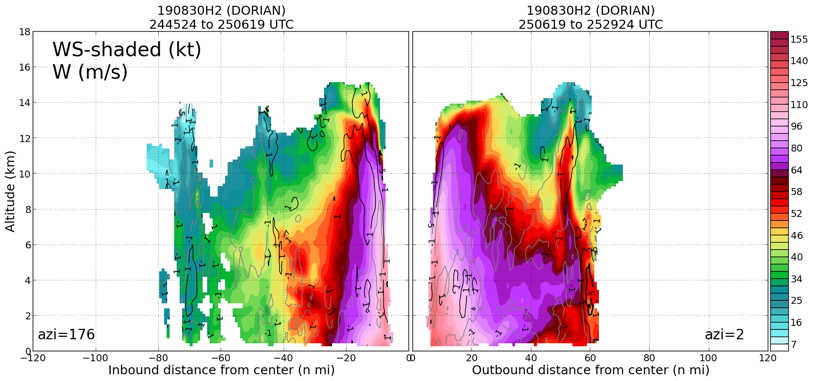
Figure 6: Profile wind speed from the final inbound/outbound passes (S-N) of 20190830H2. |
The radar data collected on the flight for assimilation into HWRF provided good coverage of the entire inner-core region of Dorian. Figure 5 shows the 2-km reflectivity and velocity data from the TDR, composited over the course of the flight. The storm had a small eye at this time (RMW 8 n mi), and despite the presence of several robust outer bands, there was no sign of an eyewall replacement cycle at this time. Profile analyses (e.g. Figure 6) showed that the strongest winds were around 0.5-km altitude.
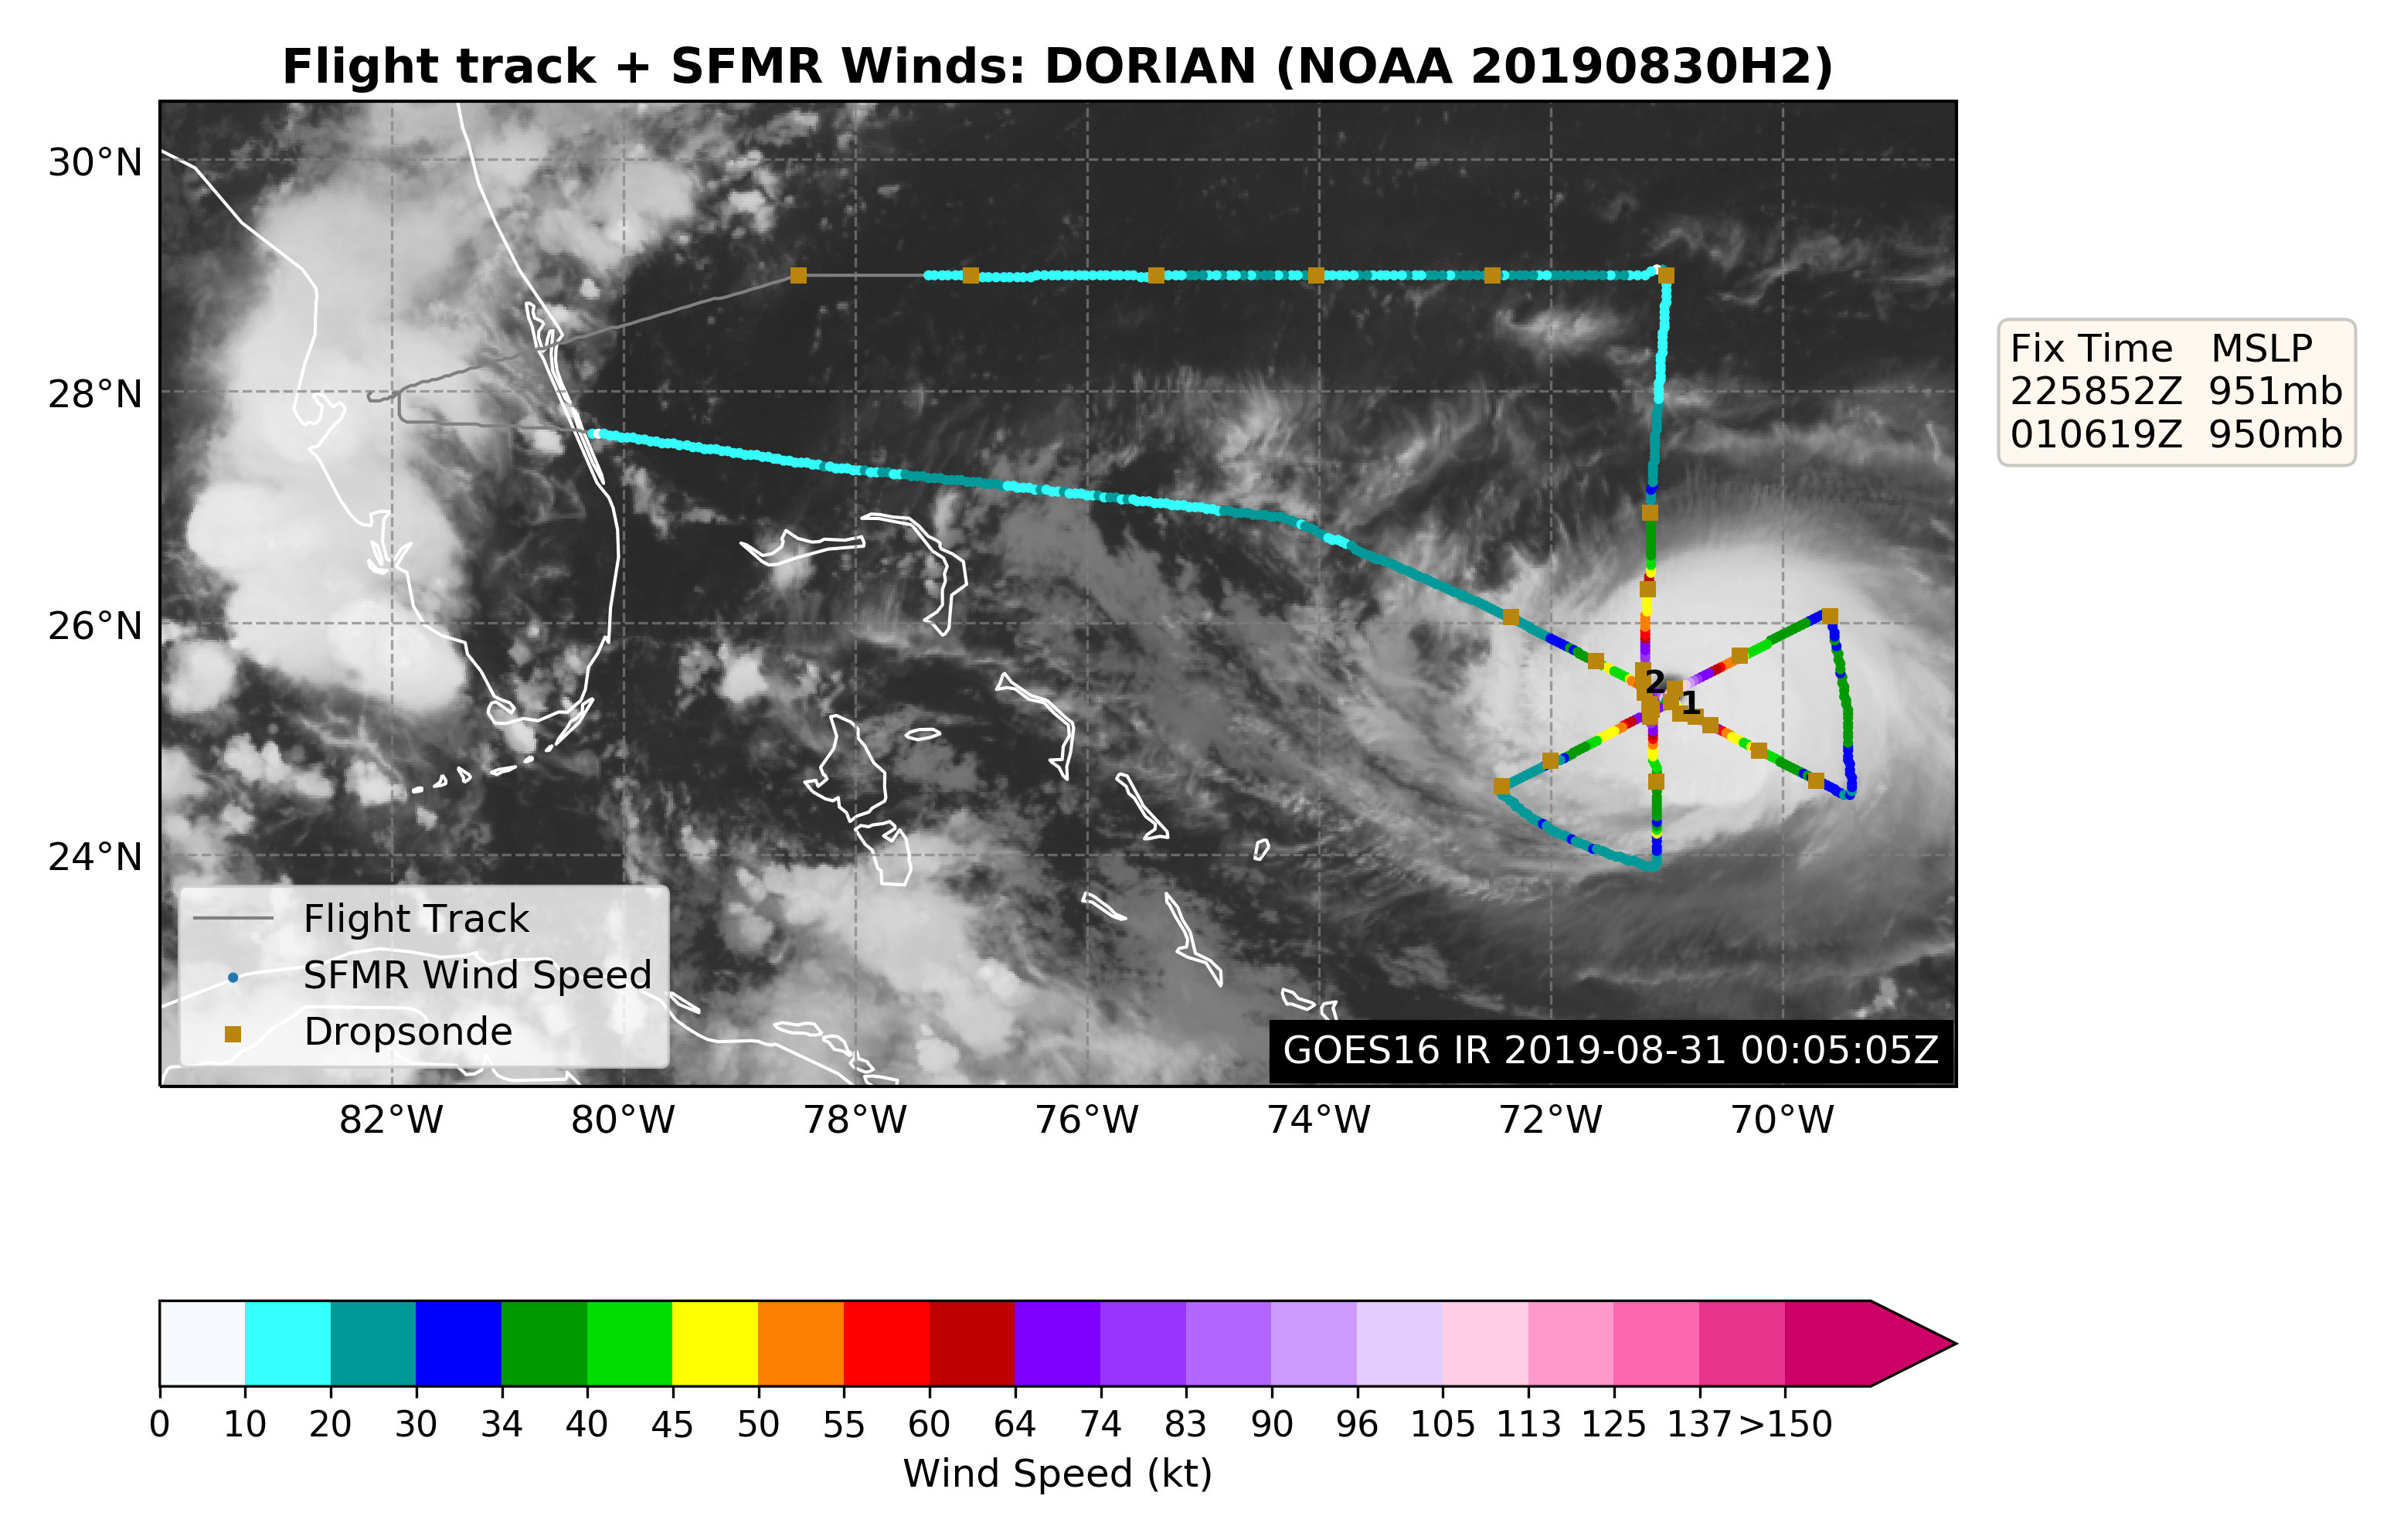
One scientific module was carried out at the request of Nick Shay and Josh Wadler (UM RSMAS). This involved high-density dropsonde sampling of rainbands, to study the thermodynamic variability in and near convective features on both sides of the TC. This was done on the second pass across the TC, on the NE and SW sides, and involved dropping 3 mini sondes on either side of and in two rain bands (Figure 7), as well as performing a similar drop pattern in the RMW using regular sondes (Figure 7).
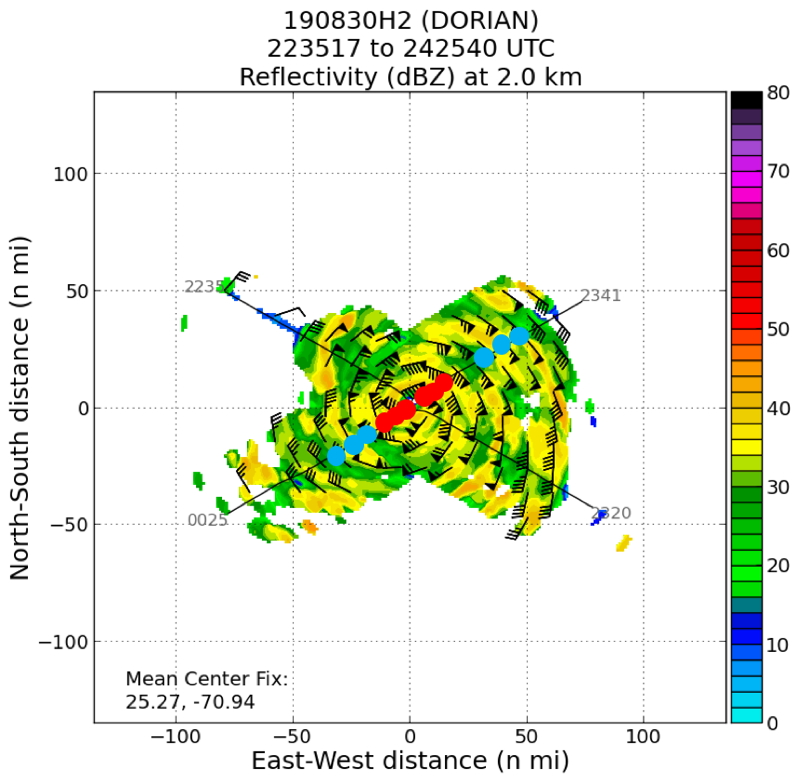
Figure 7: TDR 2-km reflectivity from the first two passes of 20190830H2, with the approximate drop locations of regular sondes (red) and mini sondes (blue) on the second pass. |
One final (late-added) objective of this mission was some high-altitude dropsondes (6 in total) along 29N to sample the strength of the subtropical ridge, which was critical to the steering of Dorian. This was requested by CARCAH and executed well by the flight crew.
Mission Evaluation / Problems :
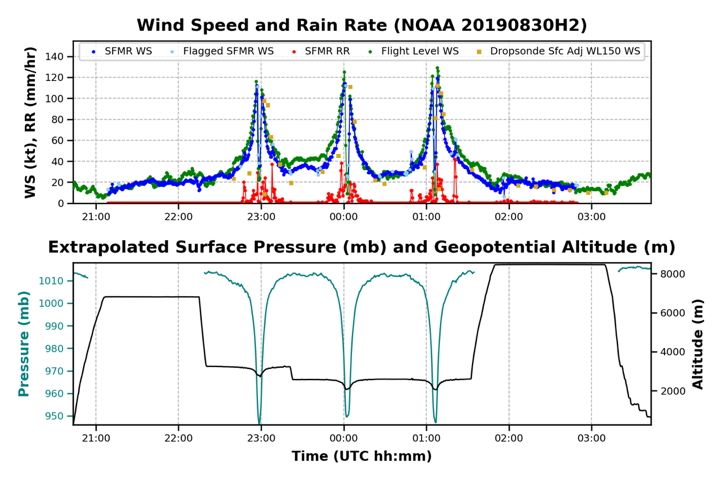
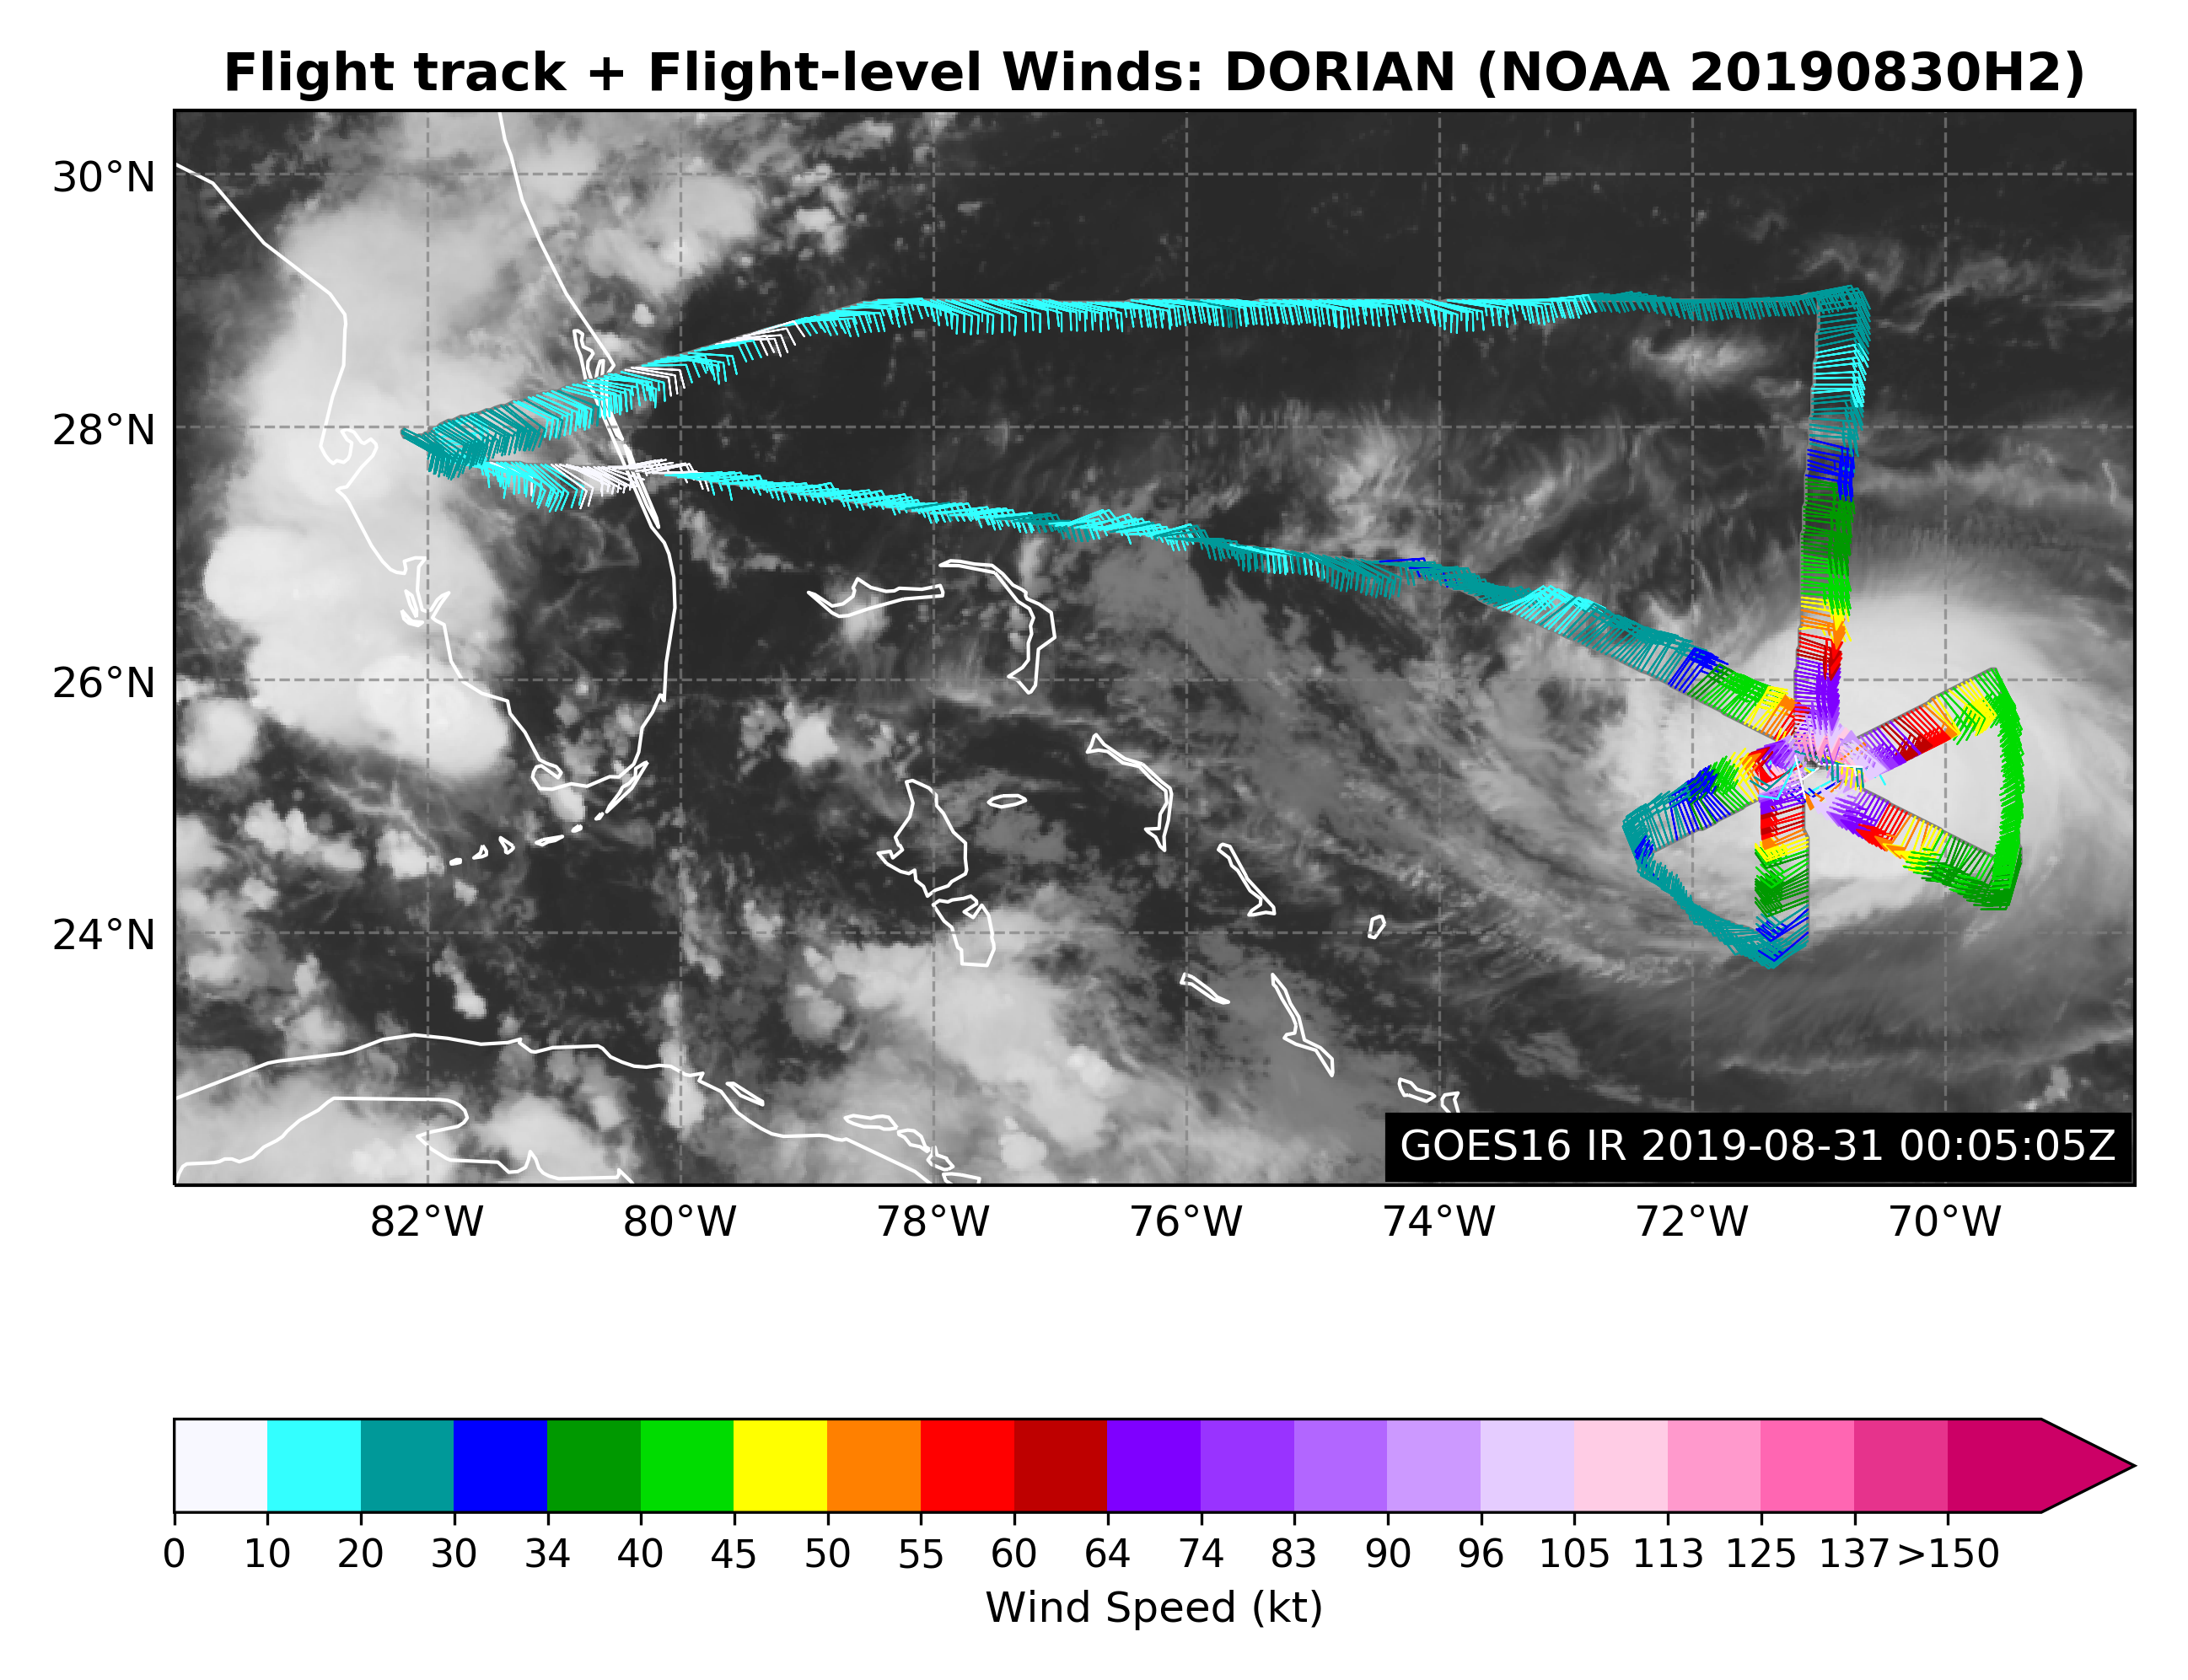
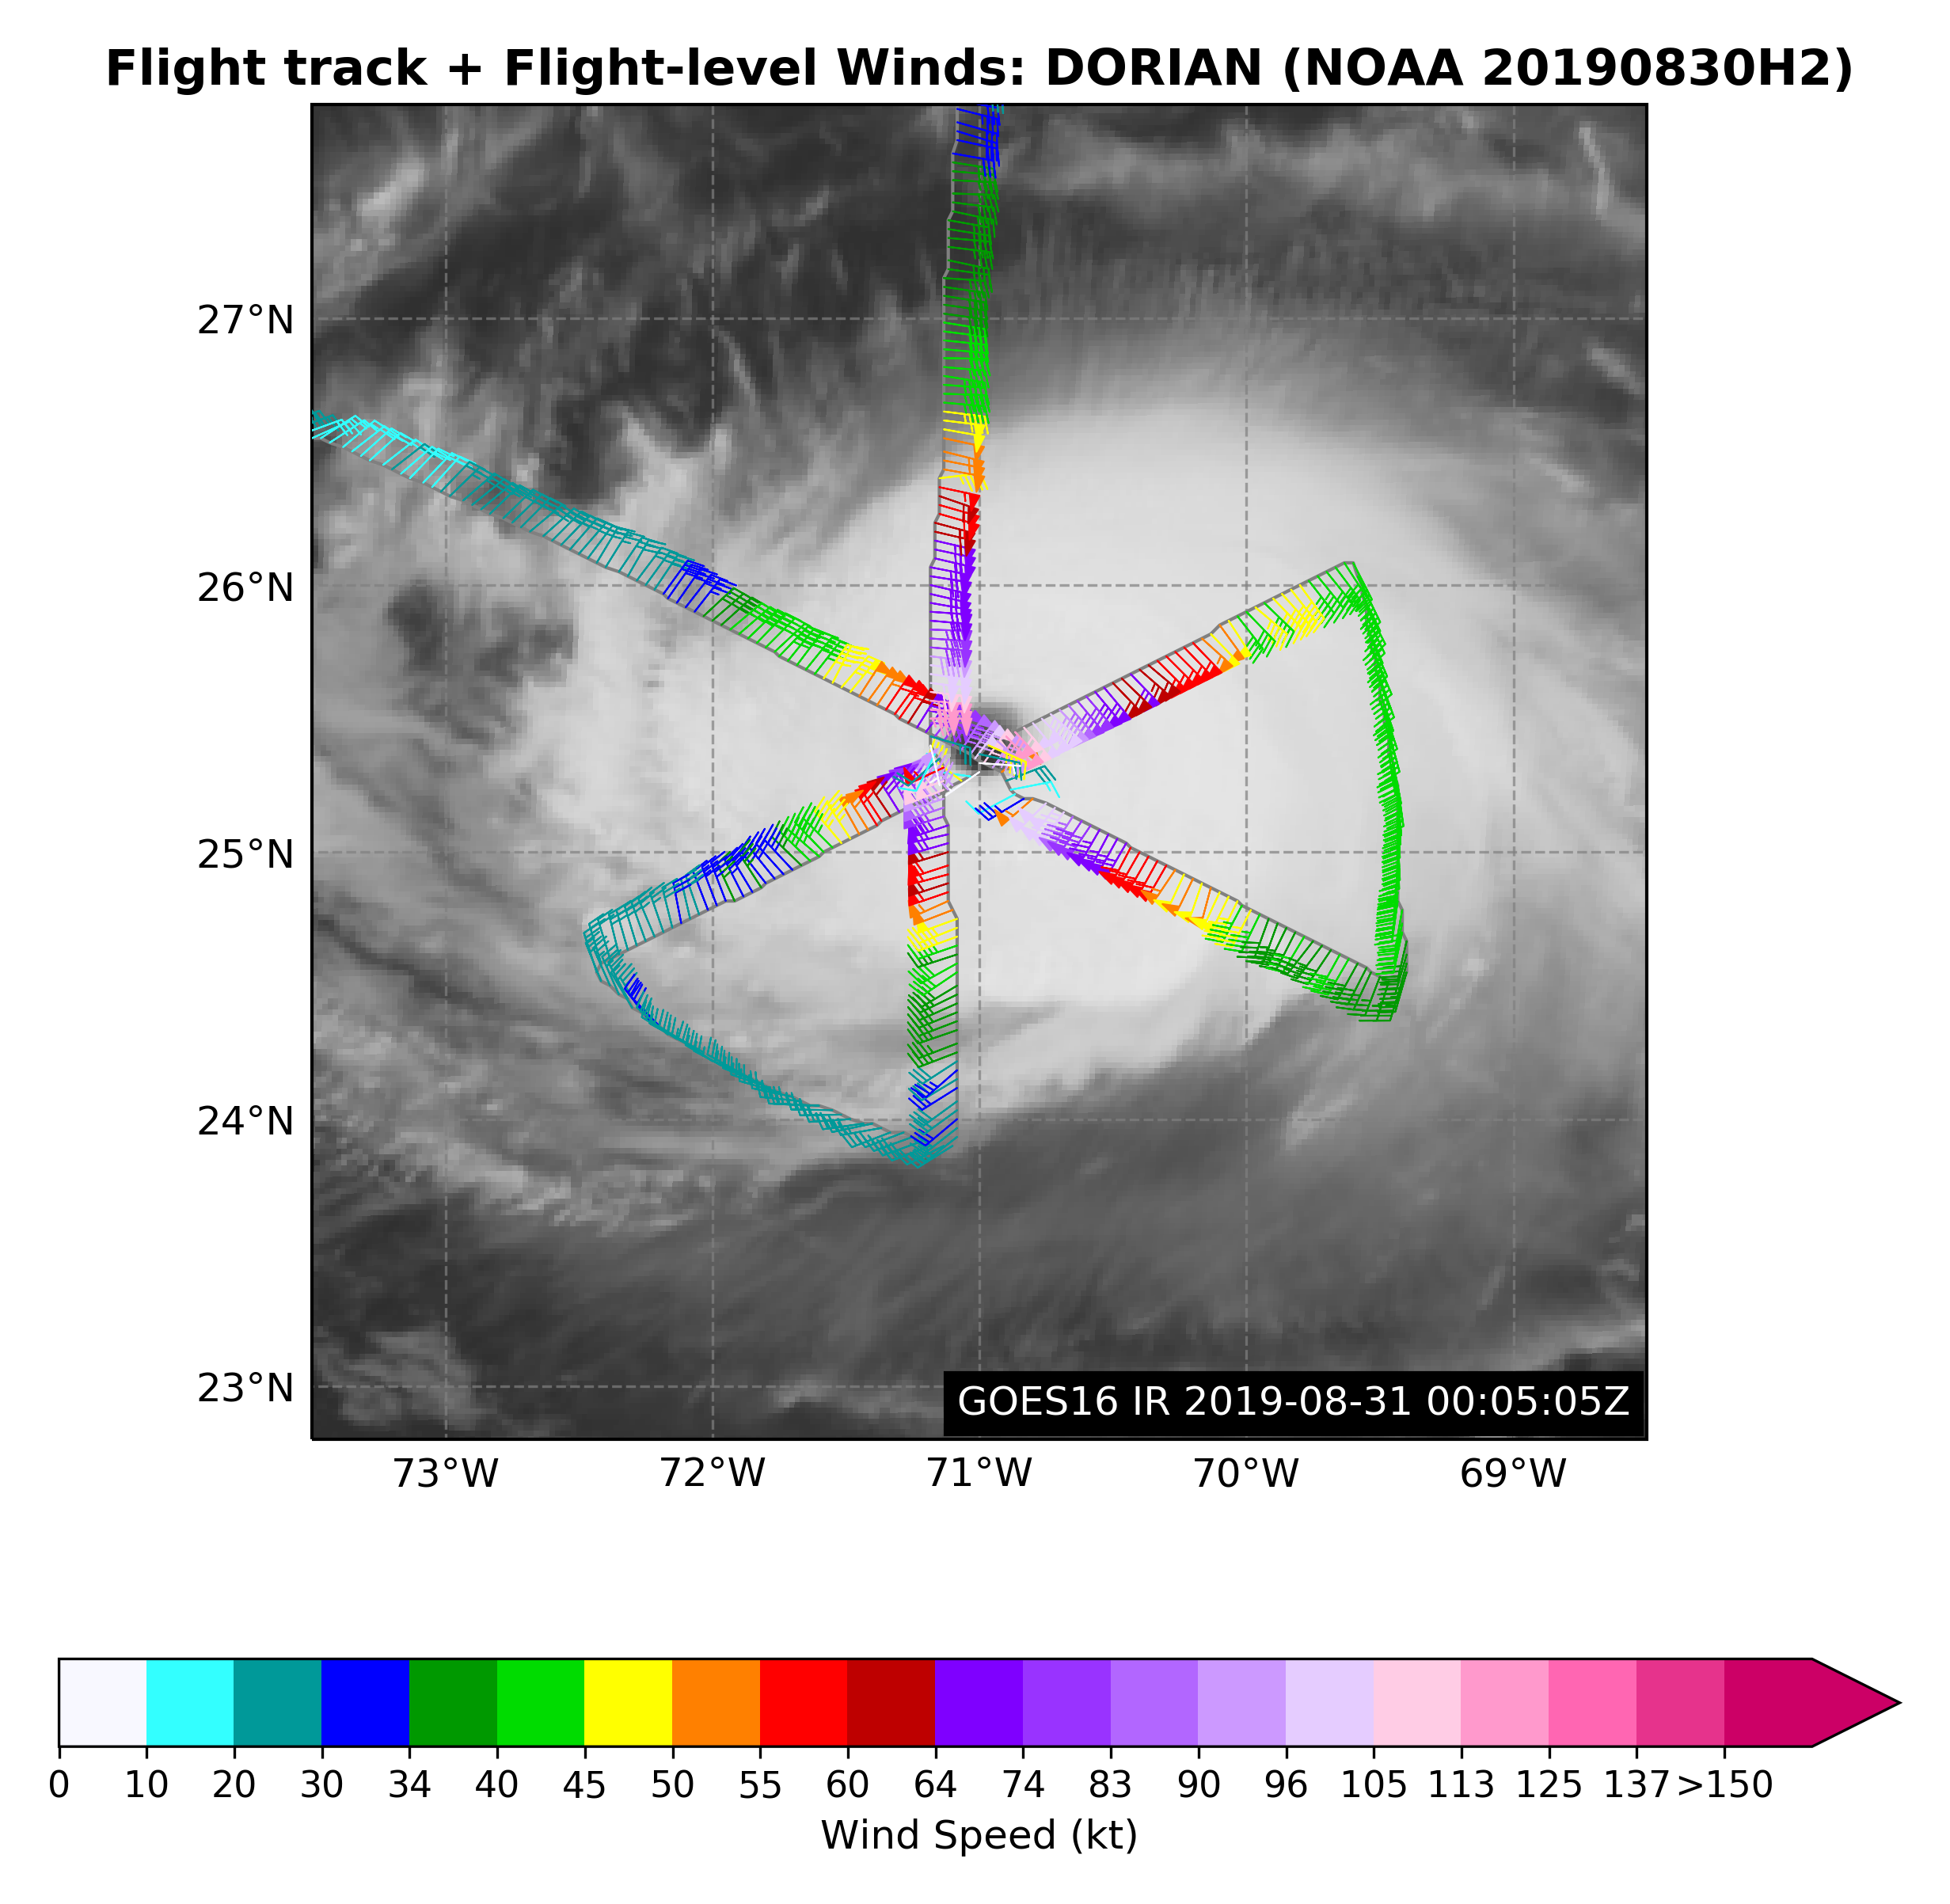
The mission was successful in gathering and delivering TDR data. 3 successful passes across the center were made, and a rainband structure module was also executed on the second. A high-altitude sonde sampling pattern was added in flight and executed successfully (Figure 8), altho ugh this prevented the gathering of ocean winds data. There were no major problems with the flight. 38 sondes were dropped and the data was good. 3 AXBTs were also dropped (two endpoints and one in the center) on the final pass across the storm, but only one of these was successful (the final endpoint). The data gathered throughout the flight showed a storm that had become quite strong, with pressure 950 hPa or lower and flight-level winds of 125 kt (Figure 9). This intensification continued as Dorian approached the Bahamas.
 Flight level wind along track |
 Flight level wind along track in storm |
 SFMR wind along flight track |
 SFMR wind along flight track in storm |
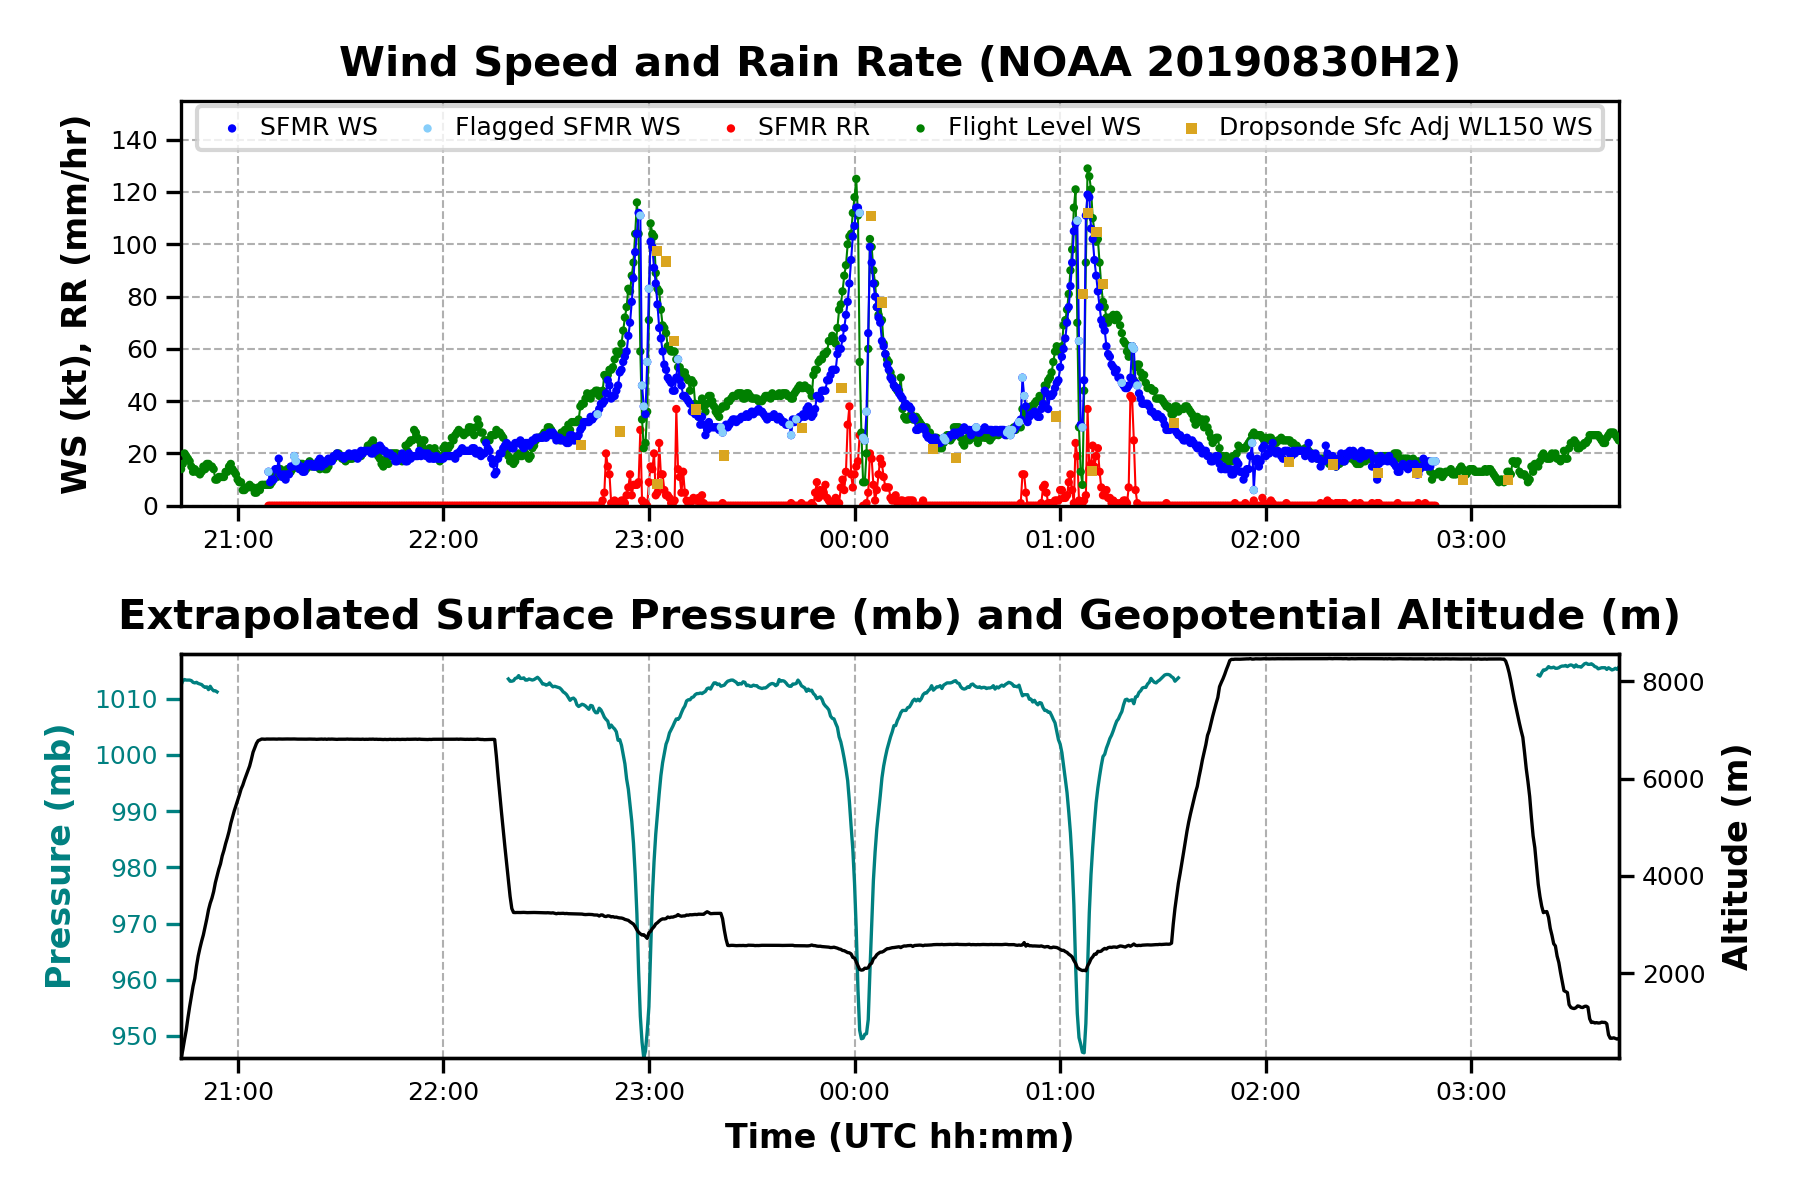 Altitude, Pressure, Rain Rate, and Wind |
|
LPS log |
Radar log |
Drop log
Flight Director's manifest |
NetCDF data |