| Aircraft Commander | Carl Newman |
| Co-pilot | Chris Kerns |
| Co-pilot | Cathy Martin |
| Flight Engineer | Paul Darby |
| Navigator | Ryan Kidder |
| Flight Director | Ian Sears |
| Flight Director | Jack Parrish |
| Data Technician | Terry Lynch |
| Data Technician | Joe Bosko |
| Electronics Technician | Bill Olney |
| Electronics Technician | Todd Richards |
| Lead Scientist | Robert Rogers (HRD) |
| Radar Scientist | John Gamache (HRD) |
| Observer | Michael Shook (NOAA) |
| Observer | Matt Mahalik (NWS) |
| Observer | Nick Slavich (Pro Sensing) |
|
Aircraft: N42RF
Proposed takeoff: 28/2000Z | ||||||
| Turn # | LAT | LON | RAD/AZM | LEG | TOTAL | TIME |
| (d m) | (d/m) | (nm/dg) | (nm) | (nm) | (h:mm) | |
| 1 | MACDILL | 0. | 0. | 0:01 | ||
| 2S | 25 59 | 90 38 | 105/060 | 449. | 449. | 1:58 |
| 3S | 24 14 | 93 58 | 105/240 | 210. | 659. | 2:53 |
| 4S | 23 21 | 92 18 | 105/180 | 106. | 764. | 3:22 |
| 5S | 26 51 | 92 18 | 105/000 | 210. | 974. | 4:17 |
| 6S | 25 59 | 93 58 | 105/300 | 104. | 1078. | 4:45 |
| 7S | 24 14 | 90 38 | 105/120 | 210. | 1288. | 5:40 |
| 8 | MACDILL | 489. | 1777. | 7:19 | ||
Mission Plan :
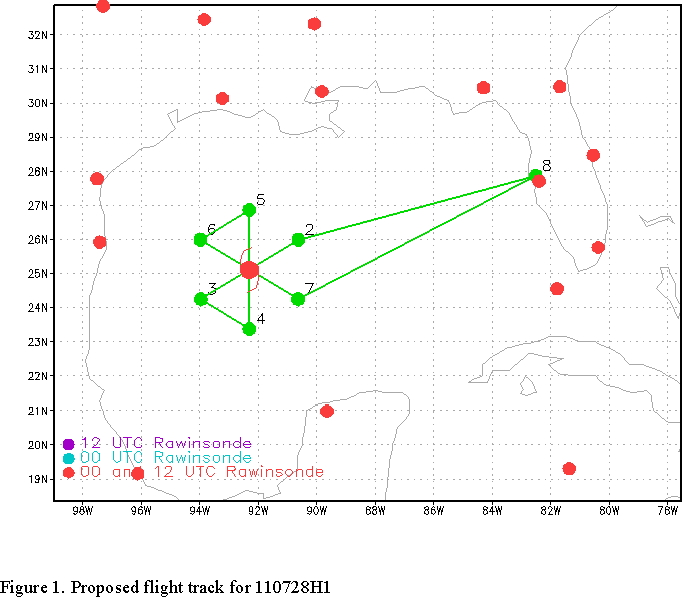
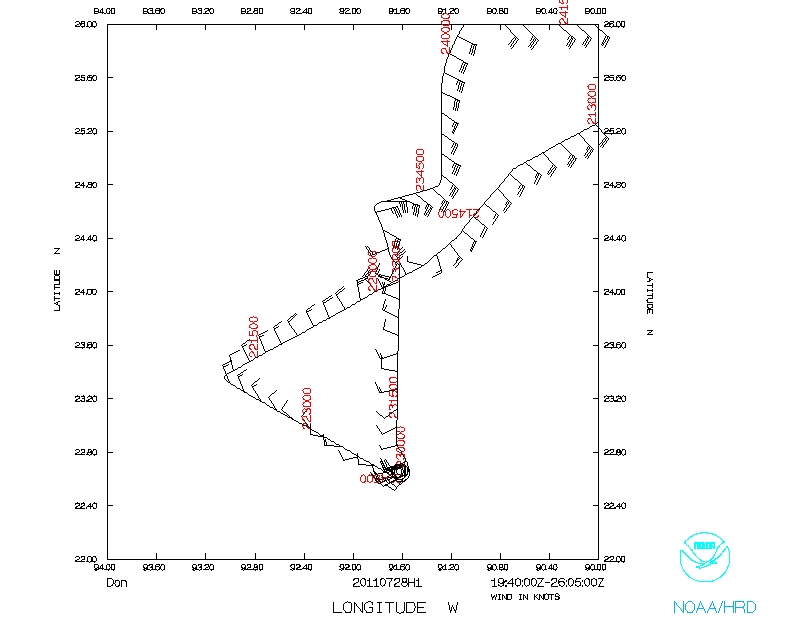
NOAA 42RF will perform a Tail Doppler Radar (TDR) and possible RI mission into Hurricane Irene. Fly a butterfly pattern (Fig. 1) at 8000 ft, with IP 105 nm northeast of center. Drop combination GPS sonde/AXBTs at turn and midpoints, RMW and the first and third passes, and GPS sondes only at turn and midpoints on second pass. Drop a center drop on the first and third center pass.
Mission Summary :
| Take off | Landing
| MacDill AFB, FL | 28/19:55 UTC
| MacDill AFB, FL | 29/01:59 UTC
| | ||
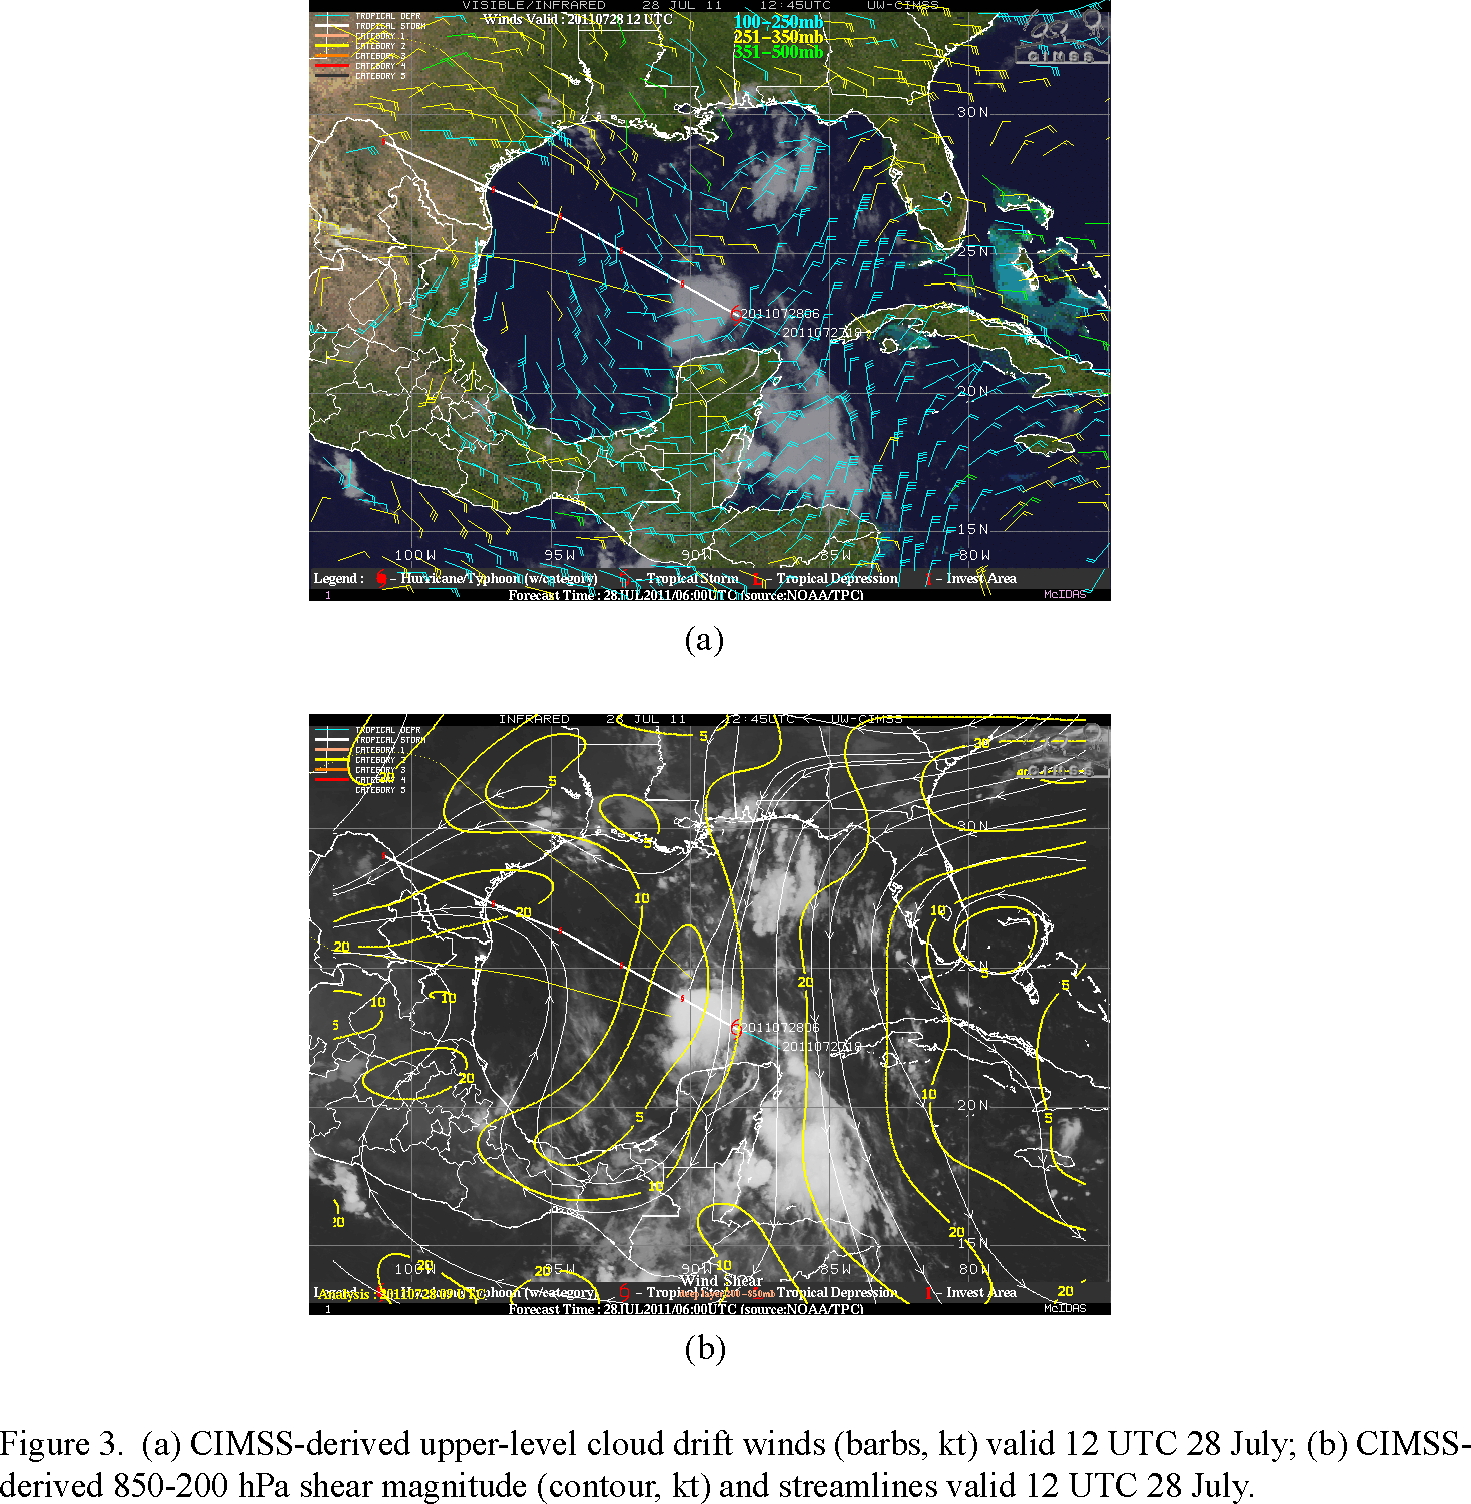
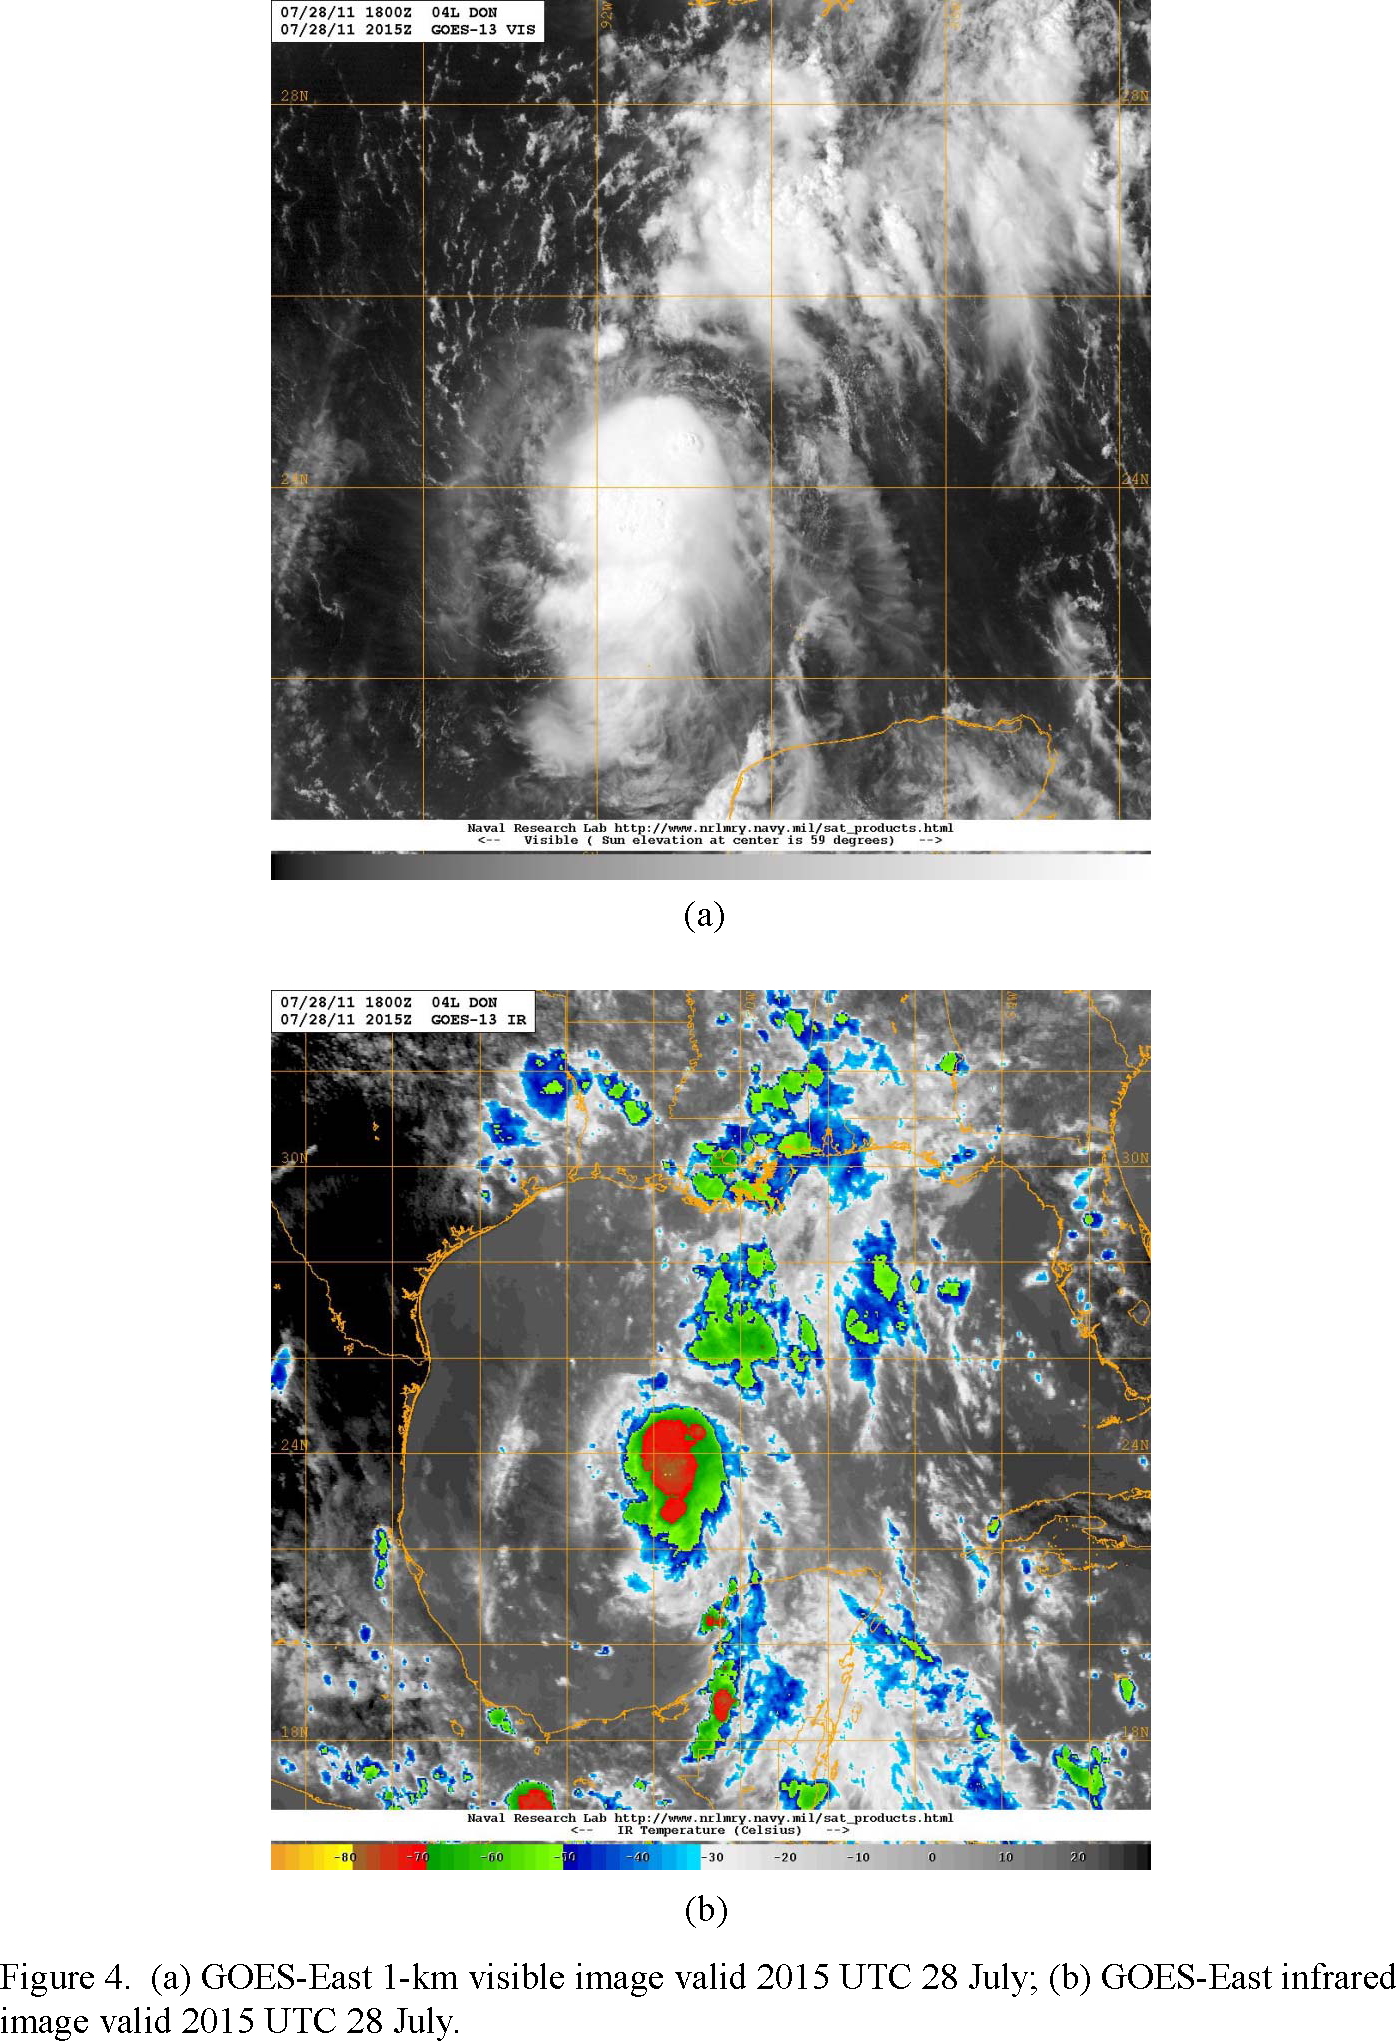
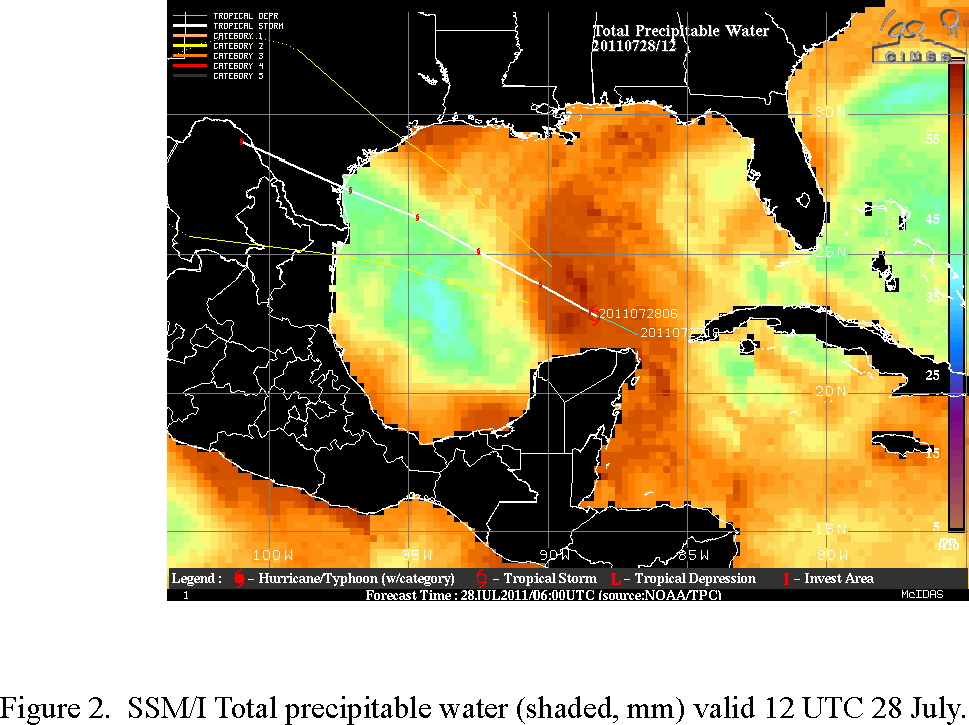
Don was in moist lower-tropospheric humidity in the immediate vicinity of the storm, but there was dry air to the west of the system (Fig. 2). An upper-level ridge axis was located over the storm (Fig. 3a), with strong northerly and northeasterly flow to the east of the system and interacting with the precipitation associated with the storm. Vertical shear (Fig. 3b) is weak to moderate right over the center, at 10-15 kt, but there is an axis of lower shear values associated with the ridge axis just to the west of the storm. Visible and infrared imagery (Fig. 4) show that active convection is located within the system, but the pattern of the upper-level cirrus outflow in the visible image and the gradient in the infrared image show the impact of the northerly shear on the system.
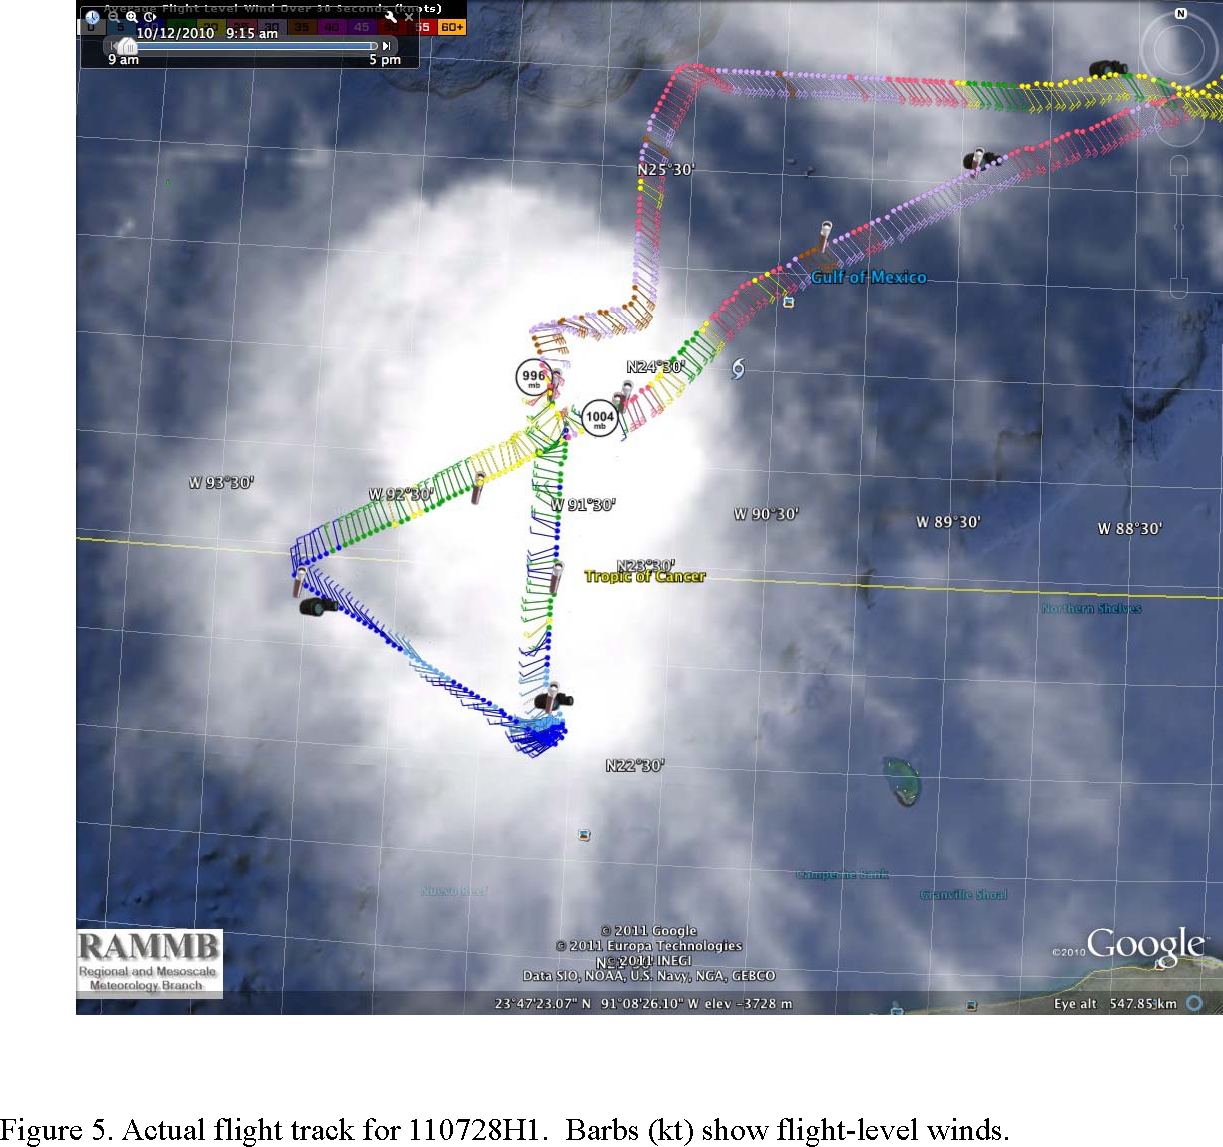
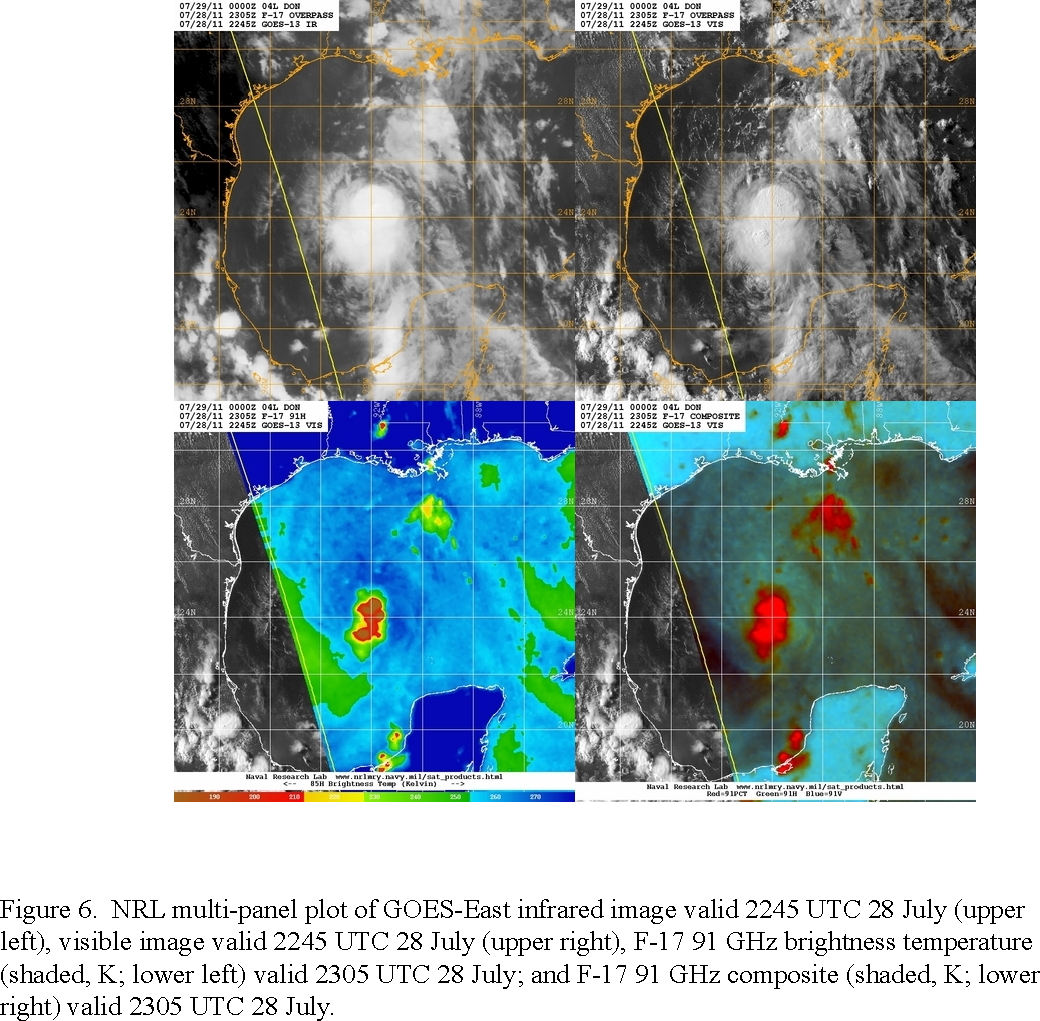
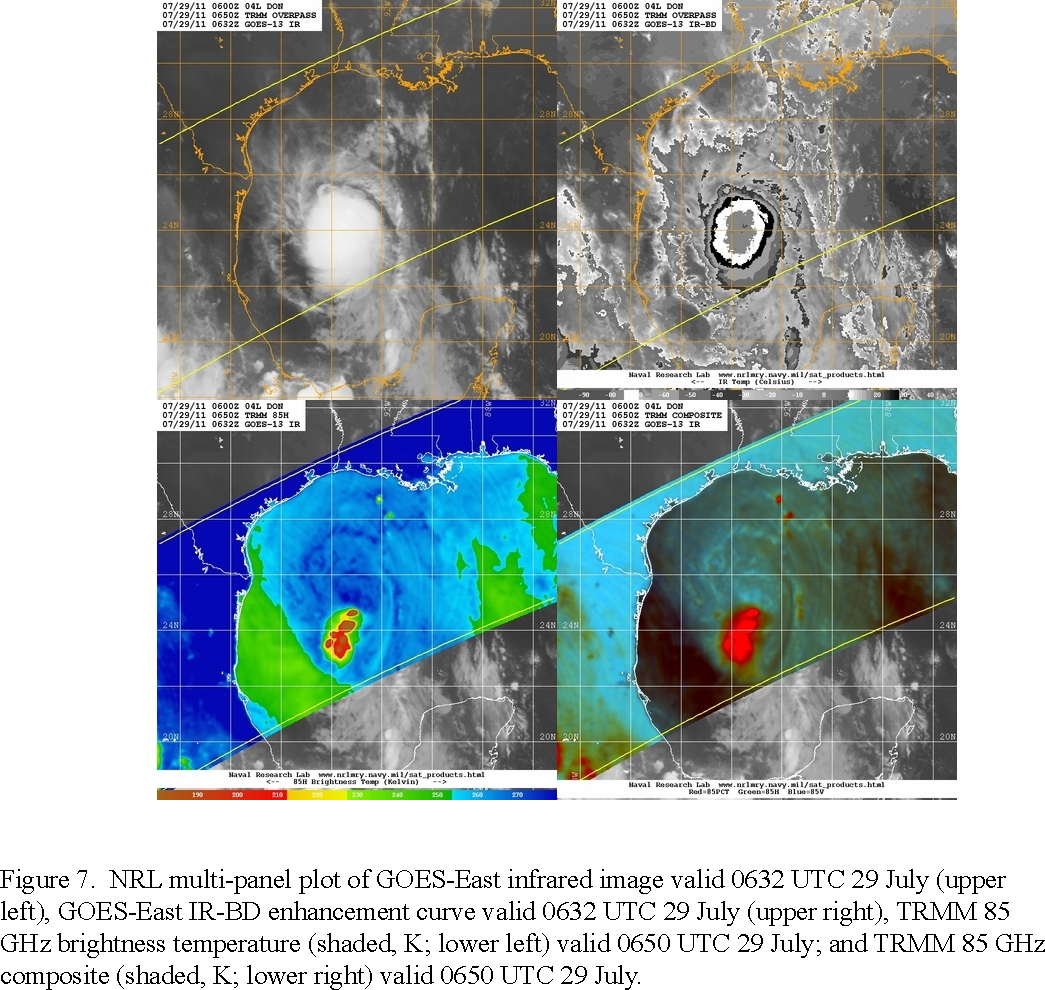
Takeoff was at 1955 UTC. As the aircraft began its pattern, there was some indication that convection was developing closer to the circulation center, as shown by visible and infrared imagery (Fig. 5), indicating the vortex was possibly becoming covered by convection and better aligned. This was also supported by microwave imagery at 2305 UTC (Fig. 6). However, after several hours (and after the mission was complete), it was clear that the convection did not persist near the low-level center, and microwave imagery at that time (Fig. 7) showed that the vortex remained exposed.
Upon reaching the IP, it was found that the Doppler radar was inoperable. Efforts were made to repair the radar during the first pass and on the downwind. However, this was unsuccessful, and with the cancellation of all subsequent P-3 missions, this mission was aborted. Twelve GPS sondes were released and nine were transmitted. Additionally, seven AXBT’s were released in the pattern. Upon scrubbing of mission, the aircraft returned to base, but on the return portion of the flight the aircraft released the remaining five AXBT.s at 1° longitude increments at 26°N to sample the ocean eddy there.
12 dropsondes released (9 transmitted), 12 AXBTs released.
Mission Evaluation:
With the unavailability of the tail Doppler radar, the mission failed to accomplish its objectives. Some sondes and AXBT's were dropped within the storm, but there was not total coverage around the storm due to the scrubbing of the mission. Also, the five AXBT's dropped during the RTB should help to map out the ocean warm-core eddy located around 26 N.
Problems :
The major problem was with the tail Doppler radar. There also was a communications problem between AVAPS and workstation that meant that it was necessary to manually copy D-files from AVAPS to Mac, then ftp those files to the workstation. This significantly slowed down the dropsonde processing.
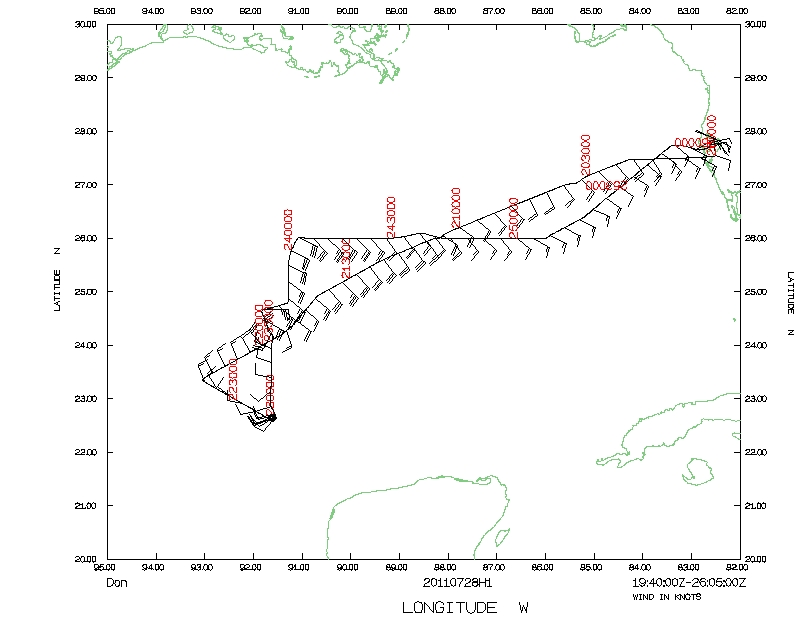 Track |
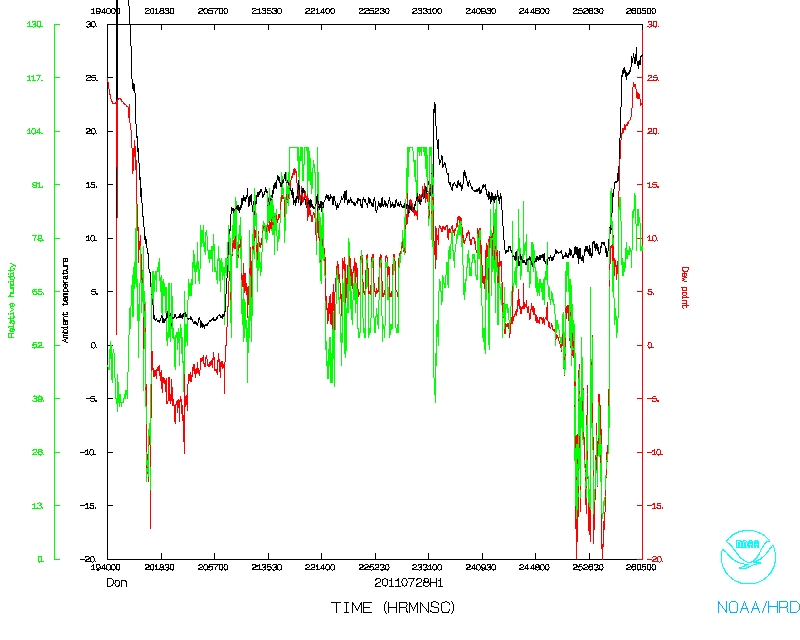 Temperature and Moisture |
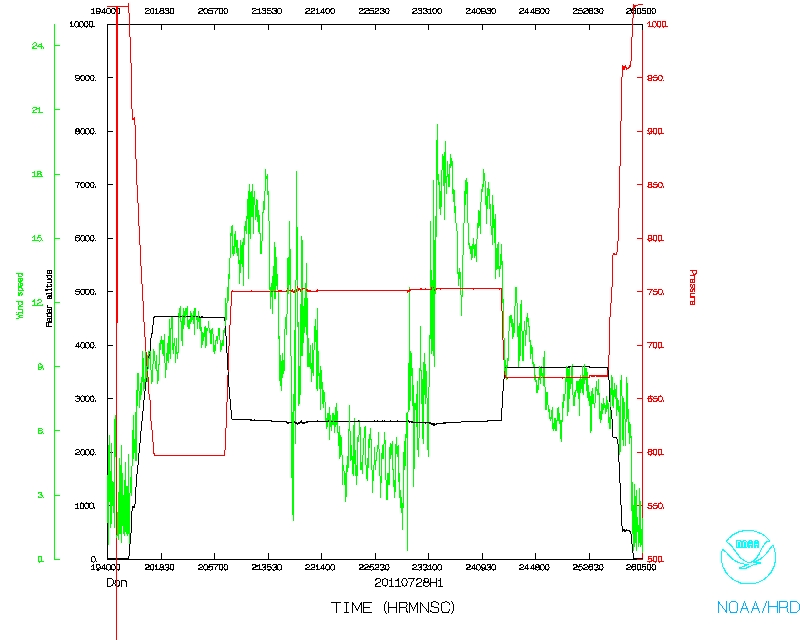 Wind and Atlitude |
 Track Detail |
LPS log | Radar log | Dropsonde log