Mission Summary
20080722H2 Aircraft 42RF
3-D Doppler Winds Operational Mission
Tropical Storm Dolly flight 2008
Scientific Crew (42RF)
| Lead Scientist | Rob Rogers |
| Doppler Scientist | John Gamache |
| Dropsonde Scientist | Kathryn Sellwood |
Flight Crew (42RF)
| Pilots | Mark Nelson
Carl Newman |
| Flight Director | Jack Parrish |
| Navigator | Joe Bishop |
| Flt. Eng. | Dewie Floyd |
| Data Tech | Terry Lynch
Jeff Smith |
| Elec. Tech | Damon SanSouci
|
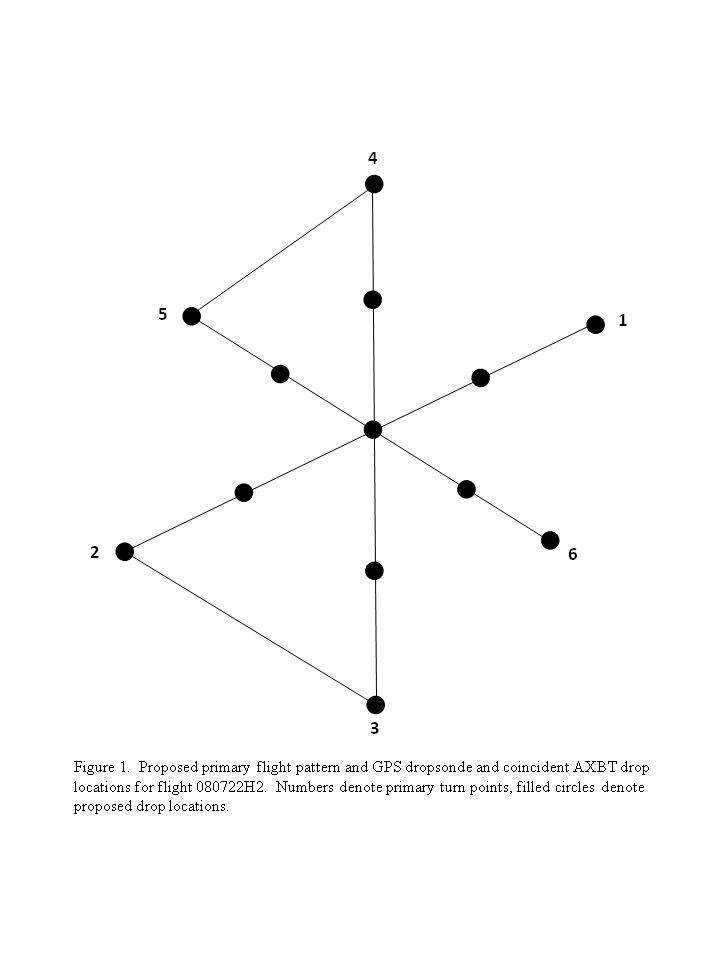
Mission Plan :
This was another combination EMC 3-D Doppler winds/NHC fix mission with an
AXBT module for HRD into Hurricane Dolly. The plan called for the aircraft to
fly a butterfly pattern at 8000 ft altitude, setting up an IP 100 nm northeast
of the center (Fig. 1). Once
north of the storm (after reaching point 4 in Fig. 1), the aircraft would fly
an SFMR module where we would track directly to the coast, dropping four sondes
across the bathymetry gradient near the coast in onshore flow, then down south
to fly along the coast, dropping two sondes, and then once the aircraft reaches
offshore flow, fly perpendicular out from the coast, dropping four more sondes.
At that point the aircraft would return to a point northwest of the storm and
finish the butterfly pattern. Within the primary pattern, the aircraft would
release combination GPS/AXBT drops at the turn points and midpoints on the
radials, and on the first and third points through the center. If possible,
we would also drop AXBT's at coincident points from the previous flight.
Mission Summary :
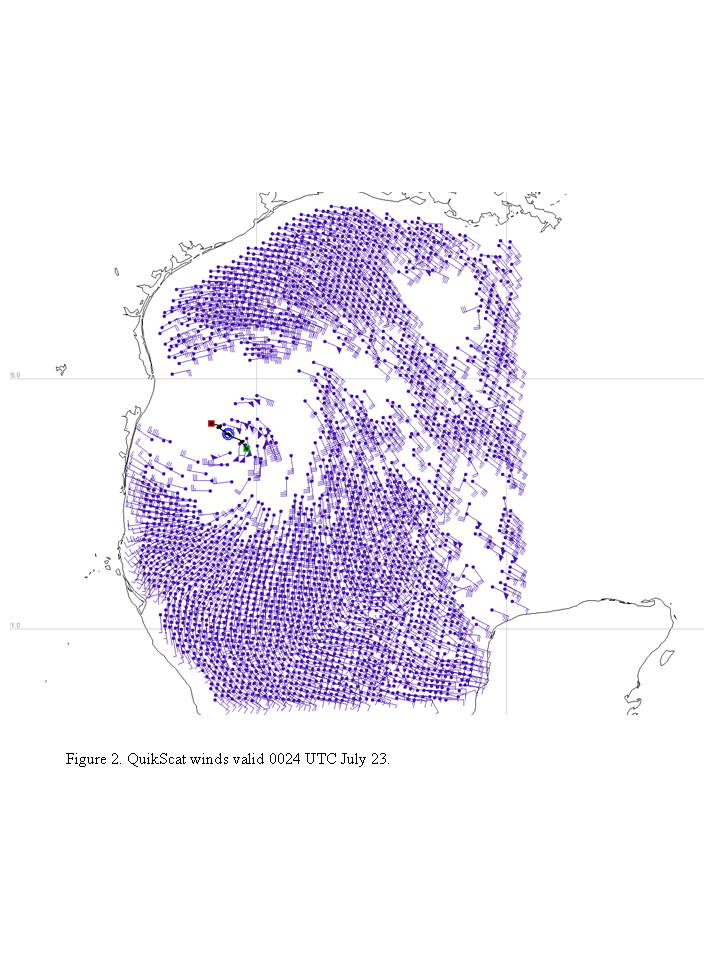
Takeoff from Tampa was at 2037 UTC July 22. Dolly was located in the western
Gulf of Mexico, approaching the Texas/Mexico border at this time
(Fig. 2). The storm had
intensified to a hurricane prior to takeoff. Infrared satellite imagery
(Fig. 3) showed that deep
convection surrounded the center. Cloud top temperatures as low as -70°C
surrounded the circulation center. Enhanced gradients in the cloud tops on
the southwest side of the storm, however, suggested that outflow was restricted
on this side of the storm and Dolly was experiencing some southwesterly shear.
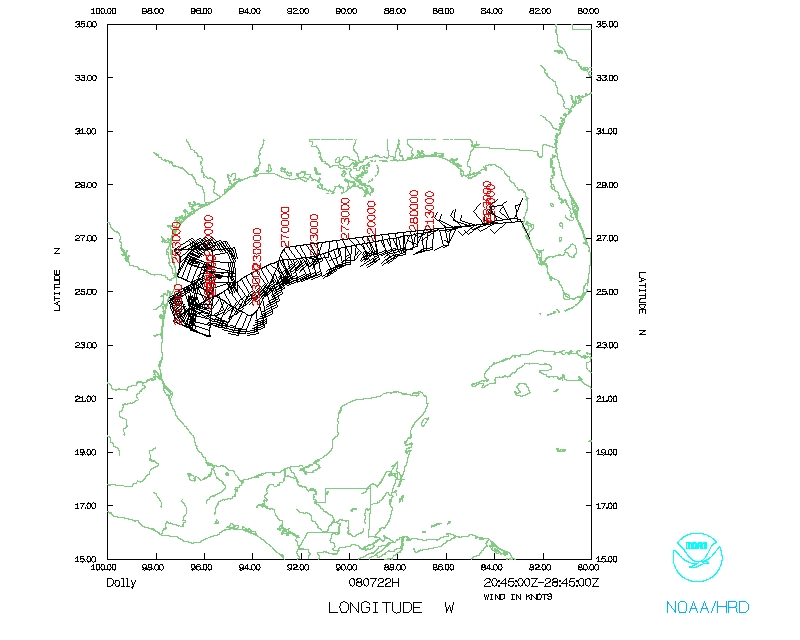
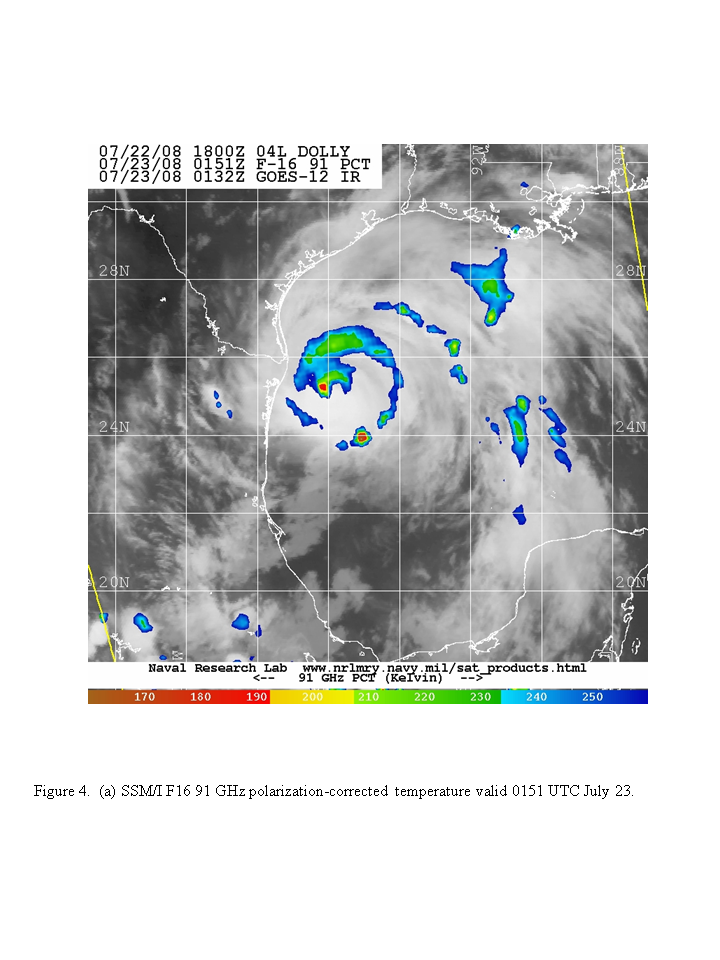
Areas of deep convection were also evident in the microwave imagery both in
the inner core in an outer band on the southeast side of the storm
(Fig. 4).
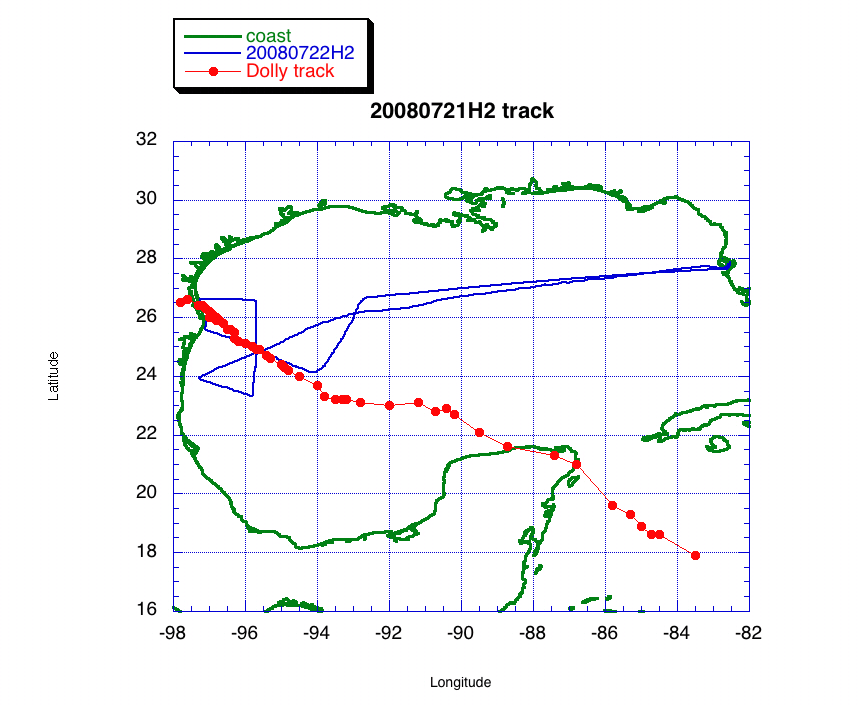
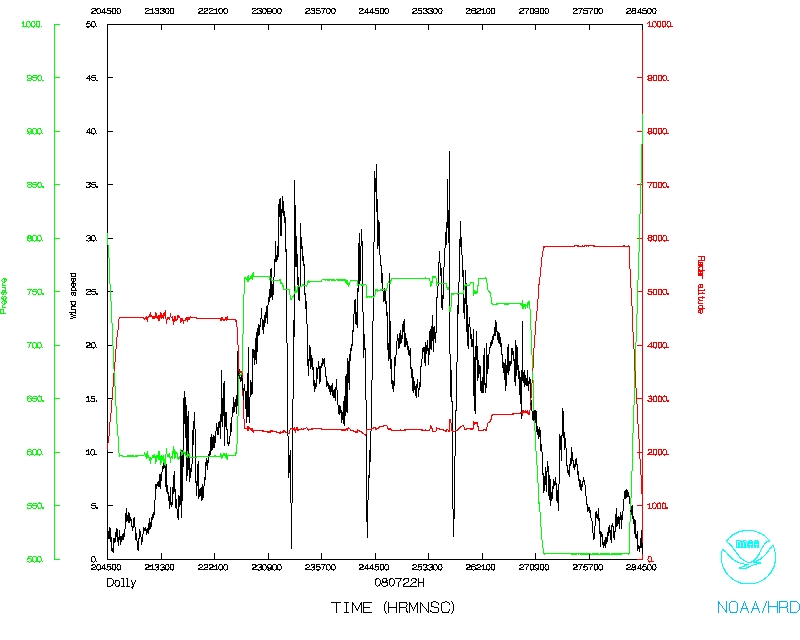
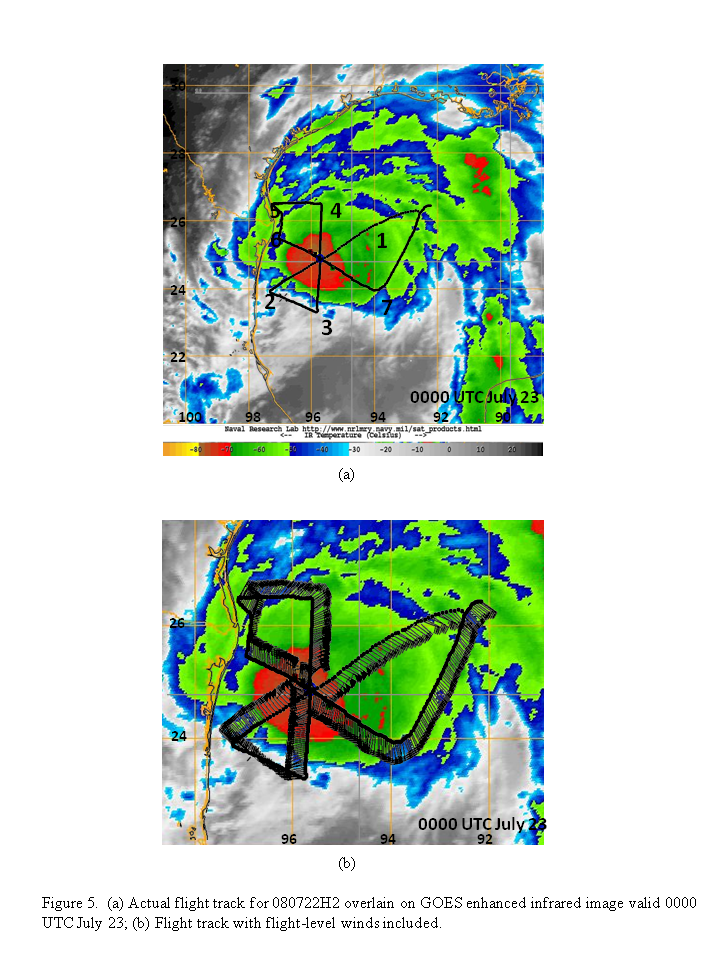
Figure 5 shows the actual
flight track. The butterfly pattern was flown successfully, as was some of
the SFMR module. On the way to the storm we encountered deep convection in
outer bands well-removed northeast from the storm center. At one point we hit
an 8 m s-1 updraft in one of these cells. During the first pass through the
eyewall was open on the northeast side. Lower-fuselage radar showed vigorous
convection on the northwest side, however, and mammatus was seen in the eye
over the aircraft. Peak flight-level (surface) winds of 70 (60) kt were on the
southwest side of the storm during this pass. The sea-surface temperature at
the center was 28°C. The ratio of surface to flight-level winds, and its
variation from the northeast to the southwest side of the storm, suggested that
the storm was tilted toward the northeast, which was consistent with the
presentation on IR imagery (cf. Fig. 3).
The relationship between the flight-level and surface center, however,
indicates that flight-level center was displaced to the west or southwest of
the surface center. By the time we were flying the next inbound leg, from
the south, the intense eyewall convection seemed to have rotated a bit to be
located on the west side, and the northeastern eyewall appeared to have filled
in. The radar presentation did not show a closed center, but rather a band of
convection spiraling out from the center, beginning on the west side of the
eyewall and wrapping around the north, east, and south sides. Convection was
most prevalent at the leading tip of this band (on the southwest side), with a
transition to more stratiform precipitation downwind. Peak flight-level
(surface) winds once the entire flight was completed of 72 (74) kt were
measured on the northwest side of the storm. Extrapolated minimum sea-level
pressure was 980 hPa on the last pass; the pressure from a GPS dropsonde was
982.4 hPa, though the winds 8 m above the surface for this drop were 16 kt,
indicating the center was slightly displaced from the drop location. Because
of time constraints due to the long ferry to the storm (approximately 2.5 h),
we were not able to extend the along-coast leg down to where the surface flow
became offshore. Also, because the storm was still relatively far offshore,
we did not encounter very strong winds in the onshore component (SFMR winds
were only about 25 kt on this leg).
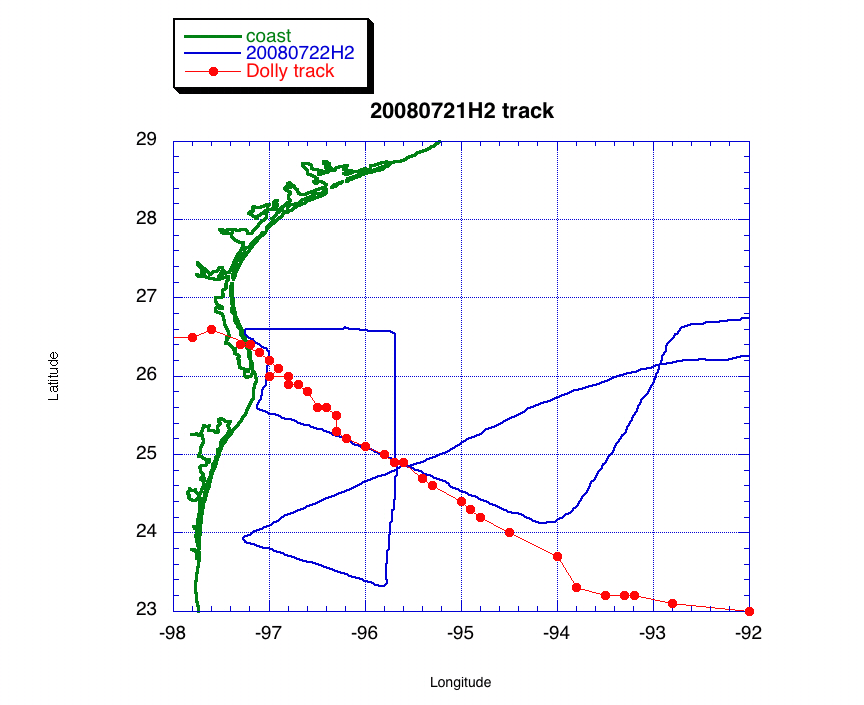
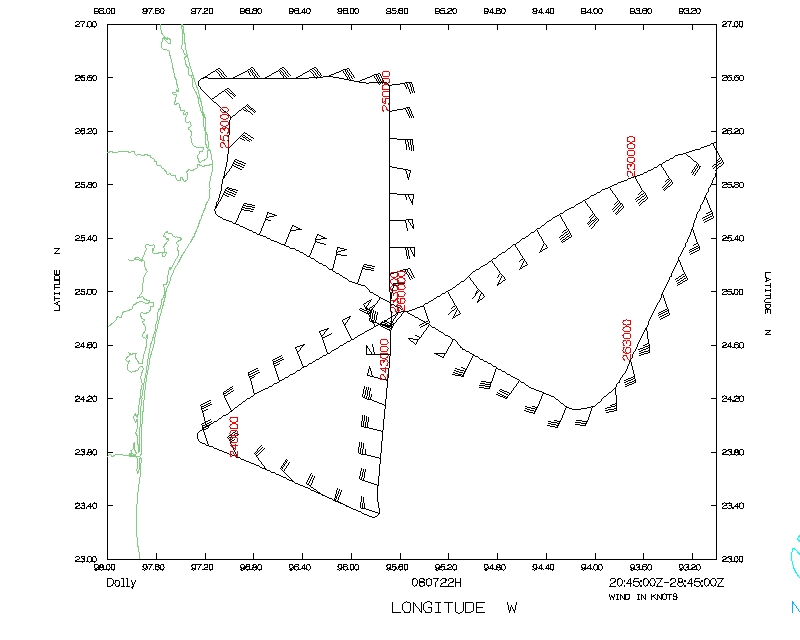
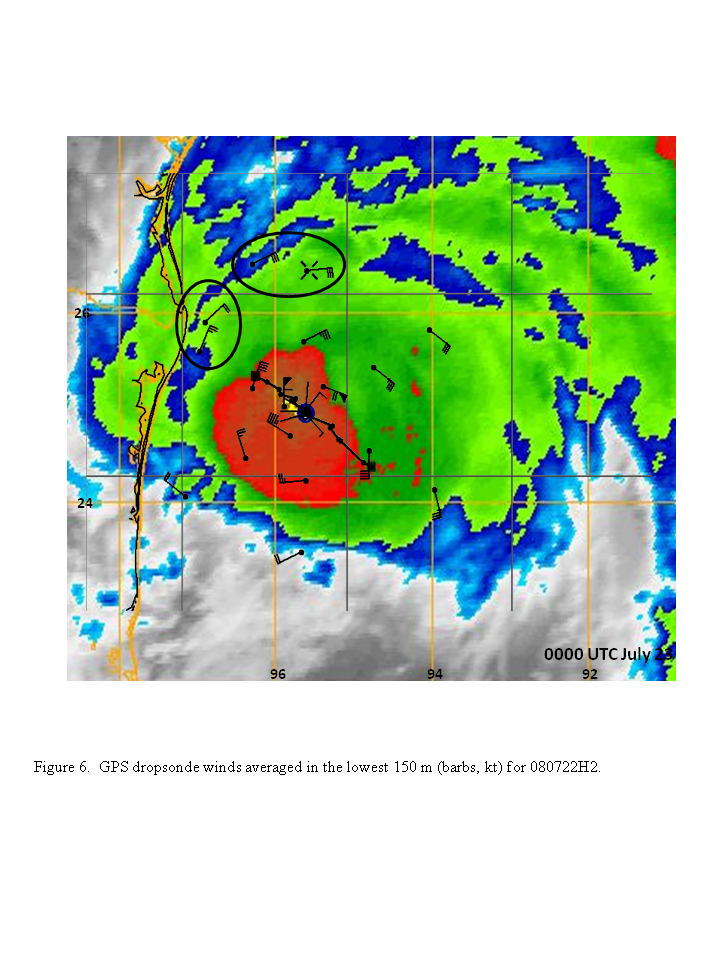
Figure 6 shows the location of
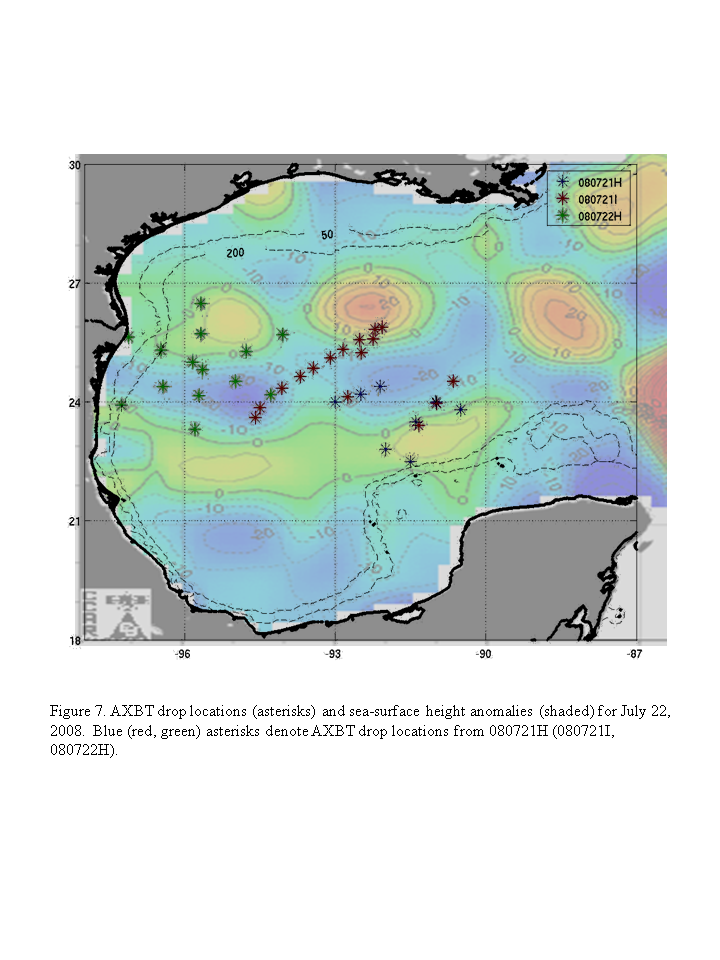
some of the drops during this module (circled in the figure). Some of the AXBT
drops were also coincident with drops from previous days' missions
(Fig. 7), though the flight
immediately prior to this one is not included in this figure.
Overall the mission was successful. The pattern was flown generally as
planned, though the northwest leg had to be shortened because of the proximity
to land. Good Doppler coverage and radar analyses were produced on all legs.
Most of the GPS drops worked, except for the one along the coast on the SFMR
module, possibly because of interference from land. All of the AXBT's worked.
The storm was strengthening while we were out there, though not rapidly. Dolly
showed asymmetries in the convection and the wind fields, with eyewall
convection mostly on the northwest and west side. Peak flight-level and
surface winds were located on the north and northwest side. The SST and
oceanic mixed-layer depth were high (28 C and 40 m). The lack of symmetric
convection in the eyewall and the size of the eye (about 30-40 nm in diameter)
were possible reasons for the lack of rapid intensification during this time.
Convection in the northwestern eyewall did extend to 18 km, though, so there
was deep convection present.
Problems :
There were only limited problems today. There was a total of 20 GPS sondes
dropped, of which two failed (no launch detect) and 14 AXBT's all of which
worked.
Robert Rogers
8/4/08
Mission Data
1 second listing |
FDir manifest |
NetCDF listing
Page last updated August 4, 2008
Return to Mission page.