Mission Summary
20150823I2 Aircraft 43RF
TDR mission Hurricane Danny
Aircraft Crew (43RF)
| Aircraft Commander | Scott Price
|
| Co-pilot | Pat Didier
|
| Co-pilot | Nate Kahn
|
| Navigator | Pete Siegel
|
| Flight Engineer | Joe Klippel
|
| Flight Engineer | ChrisLalonde
|
| Flight Director | Ian Sears
|
| Data Technician | Dana Naeher
|
| Dropsonde Operator | Jeff Smith
|
| Dropsonde Operator | Bobby Peek
|
Scientific Crew (43RF)
| Lead Scientist | Sim Aberson
|
| Radar Scientist | Paul Reasor
|
| Doppler Wind Lidar Scientist | Lisa Bucci
|
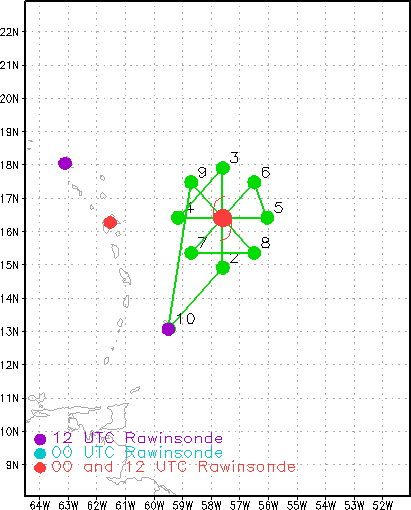
Figure 1: Initial flight plan for the mission into Tropical Storm
Danny.
Green dots are the turn points. Purple and red dots represent
locations of rawinsonde observations.
|
Mission Plan :
An Environmental Modeling Center-tasked Tail Doppler Radar (TDR) Mission into
Tropical Storm Danny, which was weakening as it moved westward toward the
Leeward Islands. The plan was for a rotated figure 4 (90 nmi legs) with four
passes through the center of Danny with a return to Barbados (Fig. 1).
TDR MISSION PLAN: Danny
Prepared by the Hurricane Research Division
August 20, 2015
Aircraft: N43RF
Proposed takeoff: 23/1400Z
|
TURN LOCATION TABLE
|
| #
| LAT
| LON
| RAD/AZM
| LEG
| TOTAL
| Time
|
|
| deg min
| deg min
| naut mi/deg
| nmi
| nmi
| hr:min
| | 1 | BARBADOS | | 0. | 0. | 0:01
| | 2S | 14 54 | 57 36 | 90/180 | 156. | 156. | 0:39
| | 3S | 17 54 | 57 36 | 90/000 | 180. | 336. | 1:23
| | 4S | 16 24 | 59 10 | 90/270 | 127. | 463. | 1:54
| | 5S | 16 24 | 56 02 | 90/090 | 180. | 643. | 2:38
| | 6S | 17 28 | 56 30 | 90/045 | 69. | 712. | 2:56
| | 7S | 15 20 | 58 42 | 90/225 | 180. | 892. | 3:39
| | 8S | 15 20 | 56 30 | 90/135 | 127. | 1020. | 4:11
| | 9S | 17 28 | 58 42 | 90/315 | 180. | 1200. | 4:55
| | 10 | BARBADOS | | 269. | 1468. | 5:49
| |
Mission Summary :
| Take off
| Landing
| Barbados, BWI | 17:41 UTC
| Barbados, BWI | 21:20 UTC
| | Penetrations | 2
| |
At the beginning of the mission, Danny was located about 345 km east of
Guadeloupe and moving westward at 24 km h-1. The maximum sustained wind speed
was 85 kmh-1, making it a weak tropical storm, and the minimum central pressure
was 1004 hPa. During the early morning, there was a flare-up of convection
near the center, and considerably lightning was observed by the previous NOAA
mission. Southwestly vertical wind shear was increasing over the center, and
dry air was surrounding Danny, making further weakening likely.
During the mission, convection waned rapidly, and the center became exposed.
The first pass was completed at 10,000 ft altitude, but it was difficult to
close off a center there. The aircraft descended to 8000 ft altitude, which
made finding a center on the second pass much easier. Dropwindsondes were
released at the end points, center, and midpoints, and during these first two
passes, the highest surface wind speed from dropwindsondes was 28 kt, and the
minimum central pressure rose to 1009 hPa.
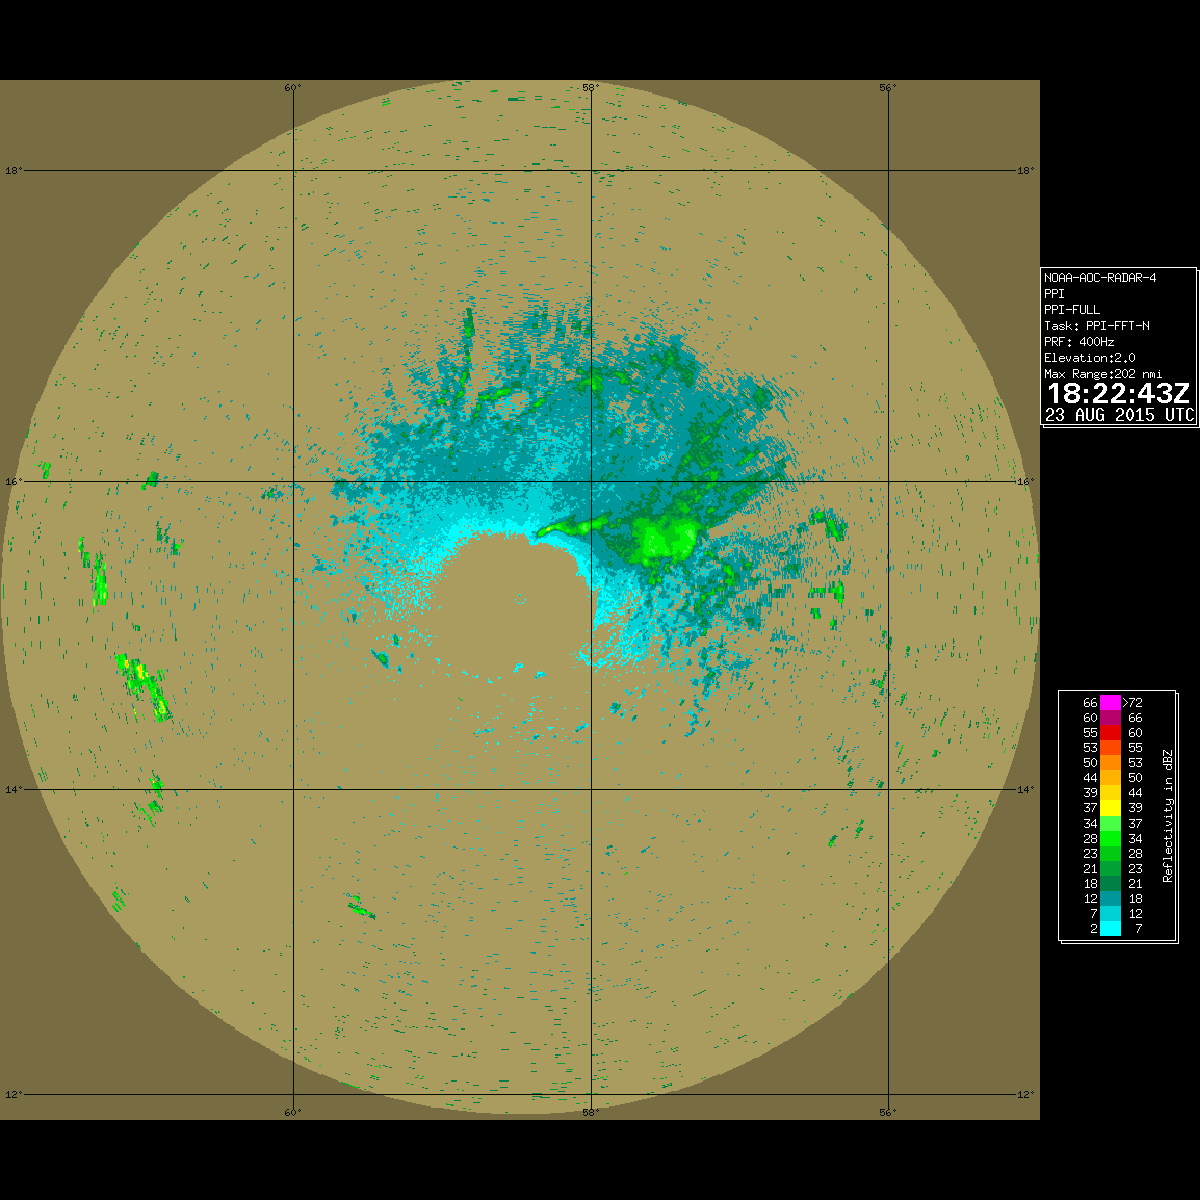
Figure 2: Radar reflectivity at 182243 UTC from the lower-fuselage
radar at closest approach to the wind center at 10,000 ft altitude.
|
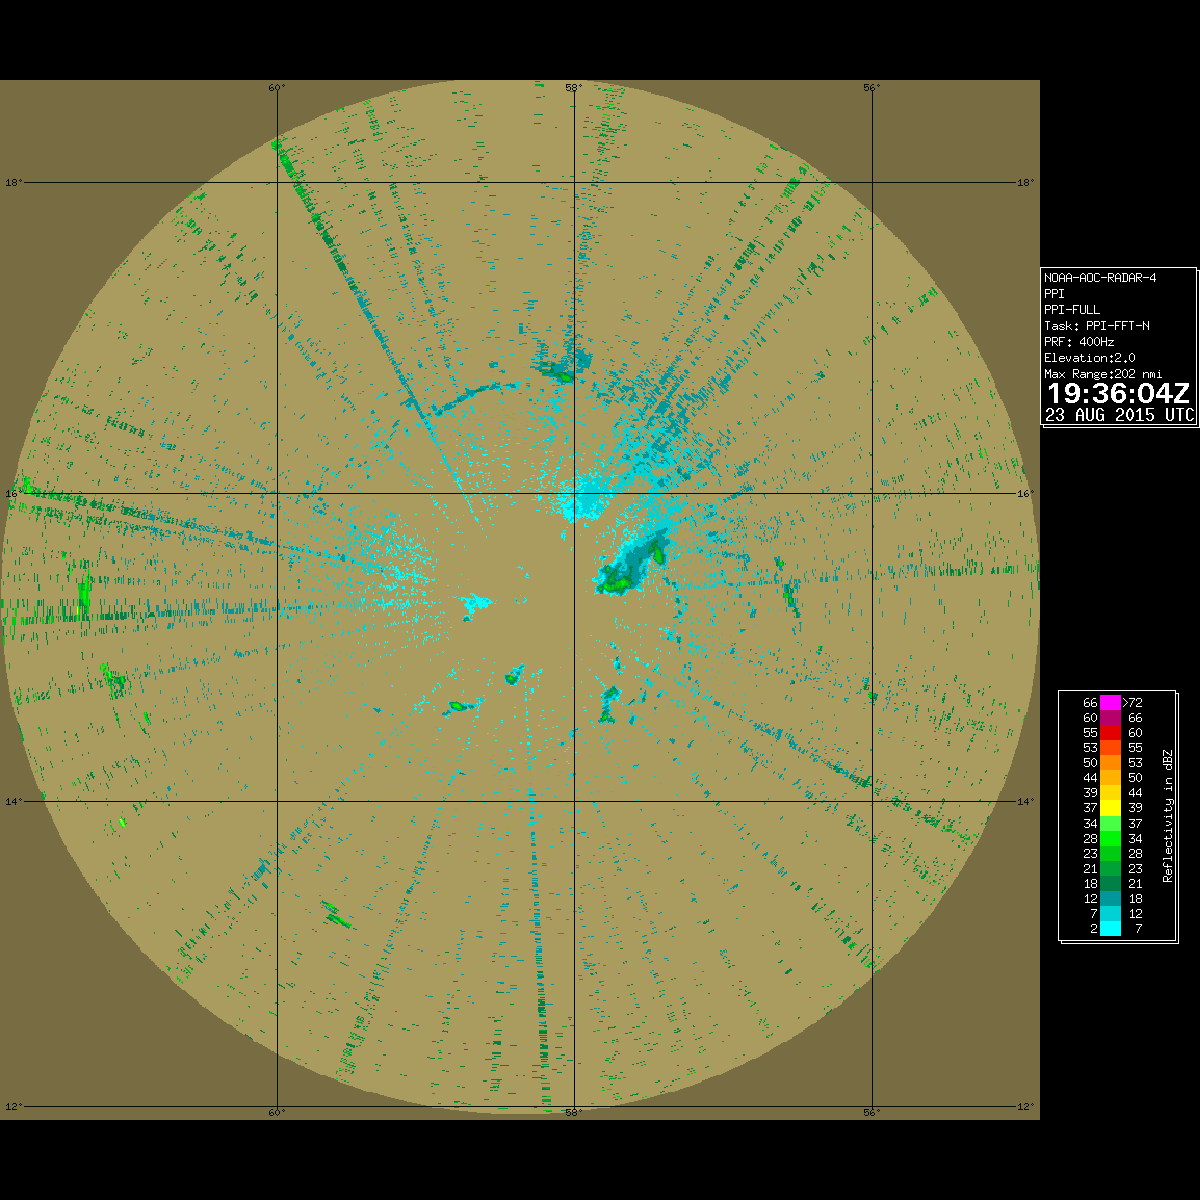
Figure 3: Radar reflectivity at 193604 UTC from the lower-fuselage
radar at closest approach to the
wind center at 8000 ft altitude.
|
Figure 2 shows the reflectivity from the lower-fuselage radar at the time of
the first center fix. A curved, convective feature, reminiscent of a remaining
northern eyewall, is evident just northeast of the fix location, and moderate
convection is evident to the north and east, suggesting the aforementioned
southwesterly shear. By the time of the second center fix, the convection had
nearly completely dissipated, and this was confirmed by satellite imagery. A
decision was thus made to return to base, since the ability to collect further
Doppler data was compromised.
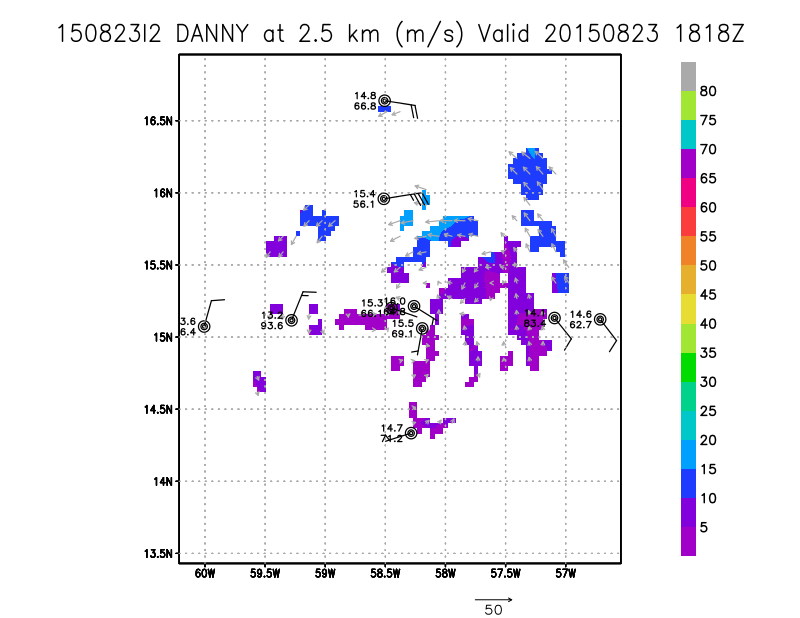
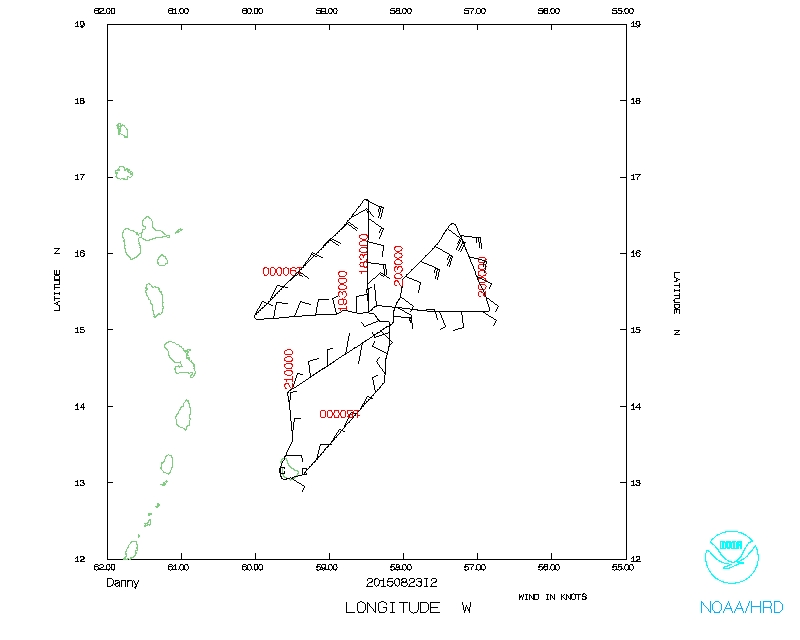
Figure 4:Storm-relative composite of radar analyses and
dropwindsonde data during the mission.
|
Figure 4 shows the (minimal) coverage of Doppler radar data for the case.
Dropwindsonde data shows exceedingly dry air even in the core of Danny. Data
near the center were not available above 7.5 km altitude, showing the weakness
of the convection. There were too few scatterers near the center to see how
the center changed with altitude.
Two radar analyses and fourteen dropwindsonde reports were successfully
transmitted. One other dropwindsonde was a fast fall and was not processed
for transmission.
Problems :
Sim Aberson
Sept. 3, 2015
Mission Data :
Flight Director's log |
NetCDF data |
1 second data |
serial data
Page last updated January 12, 2016
Return to Mission page.