Mission Summary
20090827I2 Aircraft 43RF
Genesis flight into Tropical Storm Danny 2009
Aircraft Crew (43RF)
| Aircraft Commander | Mark Nelson |
| Co-pilot | Amelia Ebhardt |
| Flight Engineer | Joe Klippel |
| Navigator | Joe Bishop |
| Flight Directors | Jack Parrish
Richard Henning |
| Data Tech | Terry Lynch |
| Dropsonde Operator | Dana Naeher |
| Electrical Engineer | Jim Roles |
Scientific Crew (43RF)
| Lead Project Scientist | Rob Rogers |
| Radar Scientist | Sylvie Lorsolo |
| Dropsonde Scientist | Shirley Murillo |
Mission Plan :
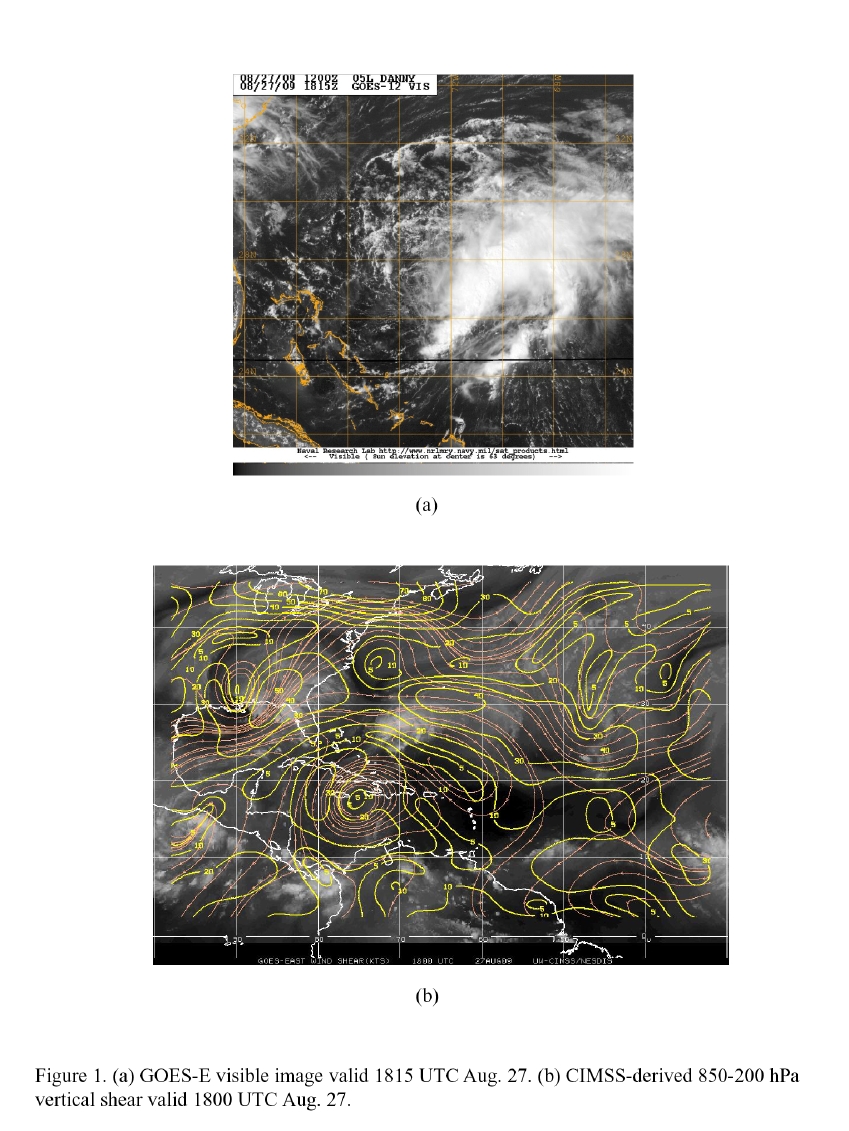
Fly another TDR/genesis-type pattern into T.S. Danny, which has minimally
intensified according to NHC. The system is still highly disorganized, with
an exposed LLCC displaced about 120 nm from any deep convection and shear
still impacting system (Fig. 1). Visible animation shows a midlevel
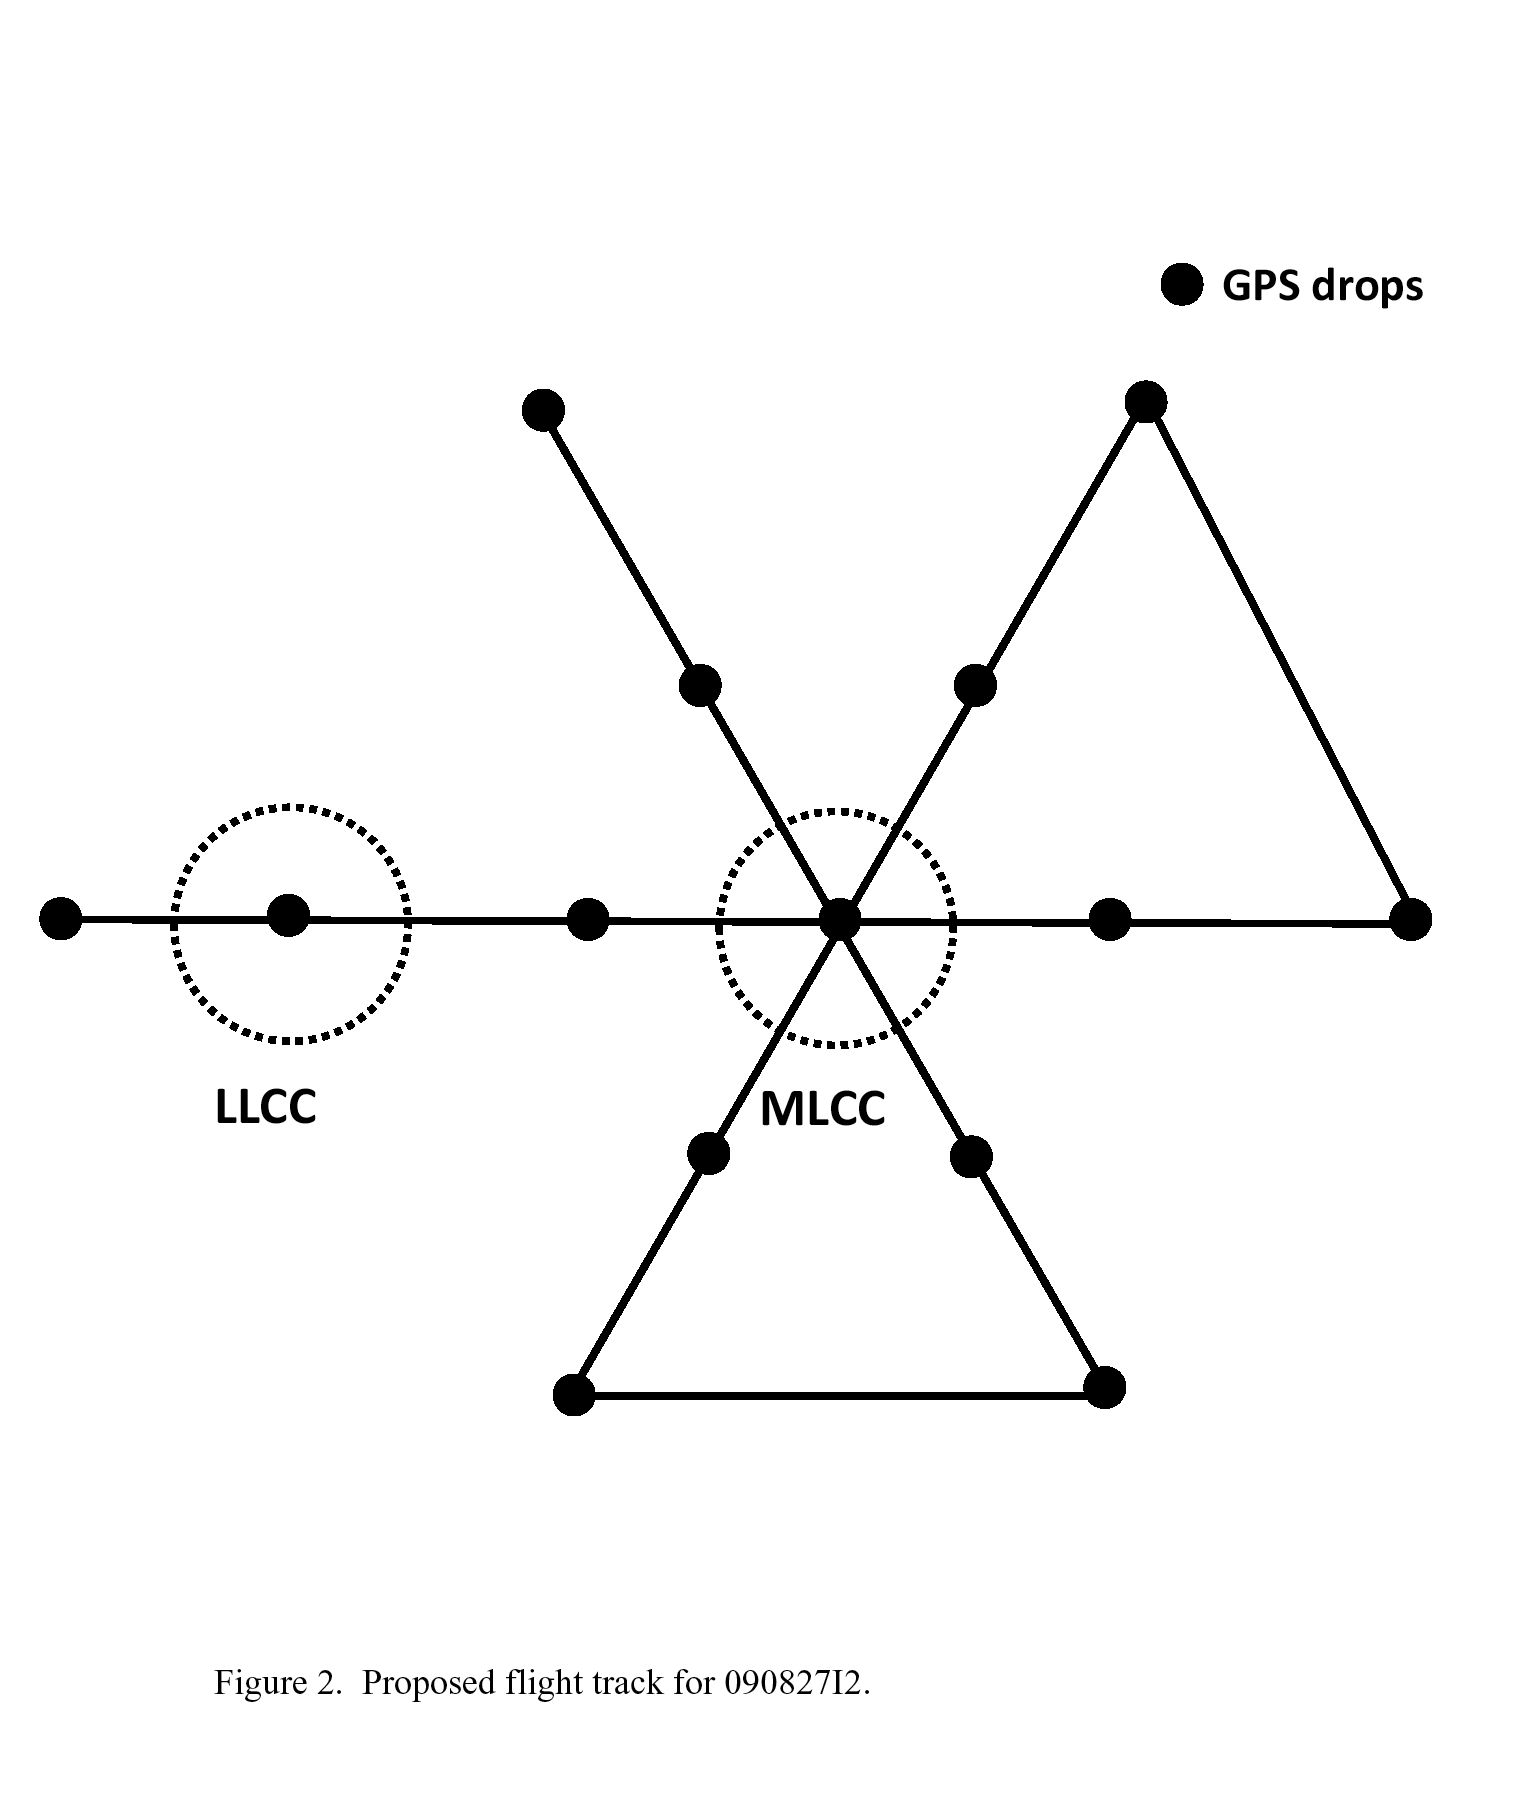
circulation center (MLCC) developing in convection to the east. Fly a
butterfly pattern anchored on the MLCC in the convection (Fig. 2). Set up IP
further to the west (about 180 nm) to traverse low-level swirl. Drop sonde at
the IP on the W side of the swirl, then over low-level center. Continue
pattern with 120 nm legs, end up on the NW side. Drop sondes at turn points,
midpoints, and first center 'pass' at flight-level. Drop AXBT's at integer
longitudes on ferries, plus at turn points. Fly the pattern at 15,000 ft.
prior to reaching the LLCC, then descend to 10,000 ft.
Mission Summary :
| Take off
| Landing
| MacDill AFB, FL | 20:06 UTC
| MacDill AFB, FL | 03:34 UTC
| |
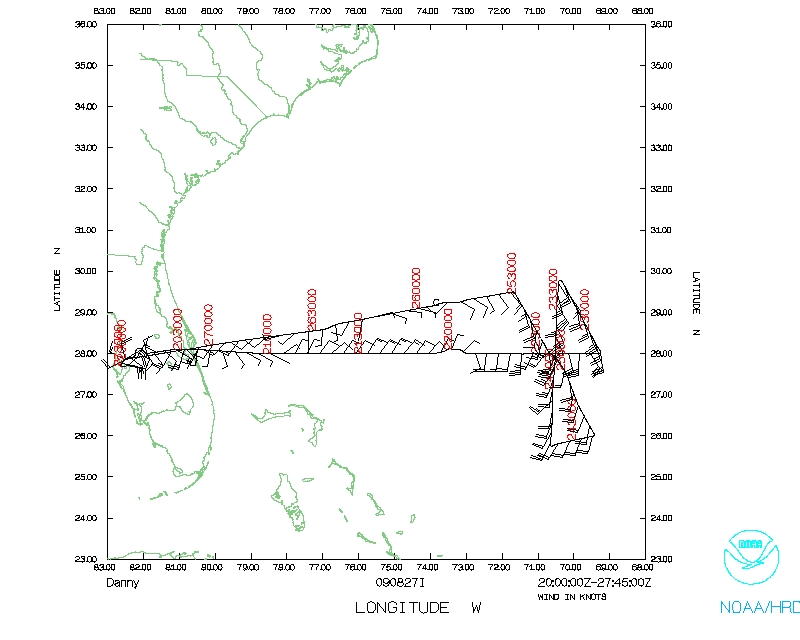
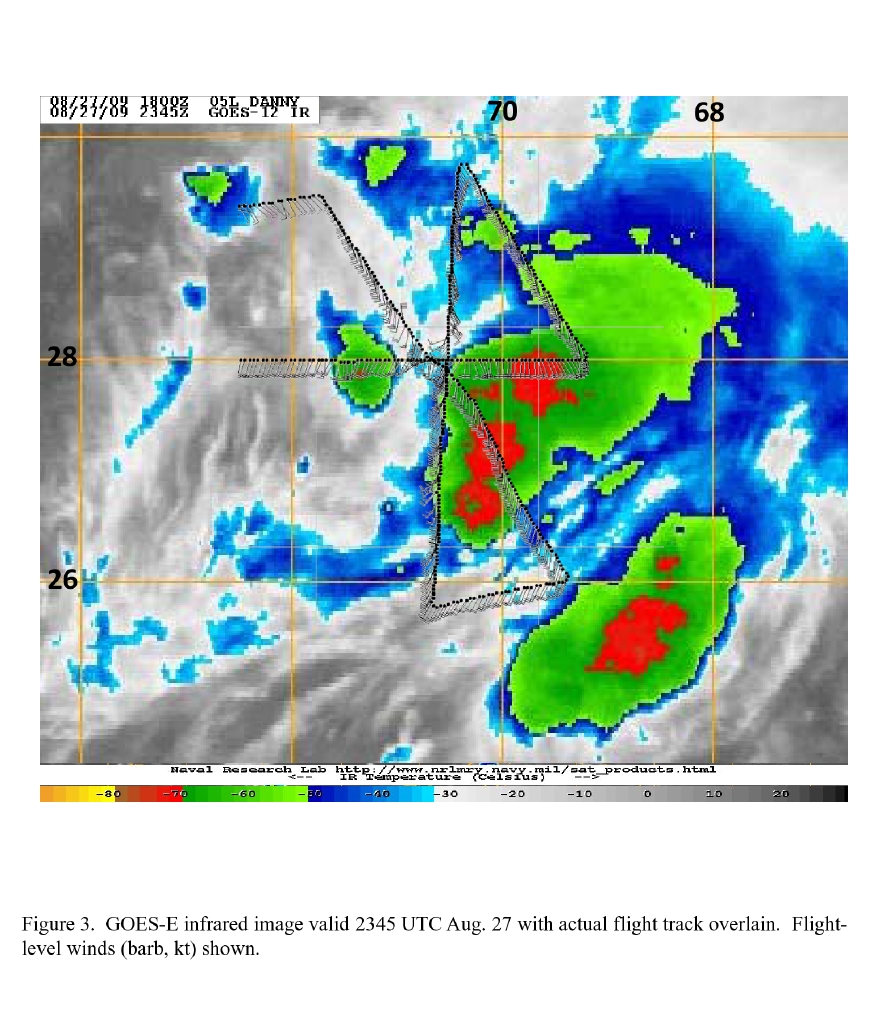 Takeoff was at 2006 UTC. The pattern was flown generally as planned (Fig. 3).
On the first west-east leg, we saw a wind shift at flight-level just displaced
to the east of the LLCC. At the place where we anticipated a MLCC we found a
slight wind shift line from SW to SW, suggesting a convergence line there.
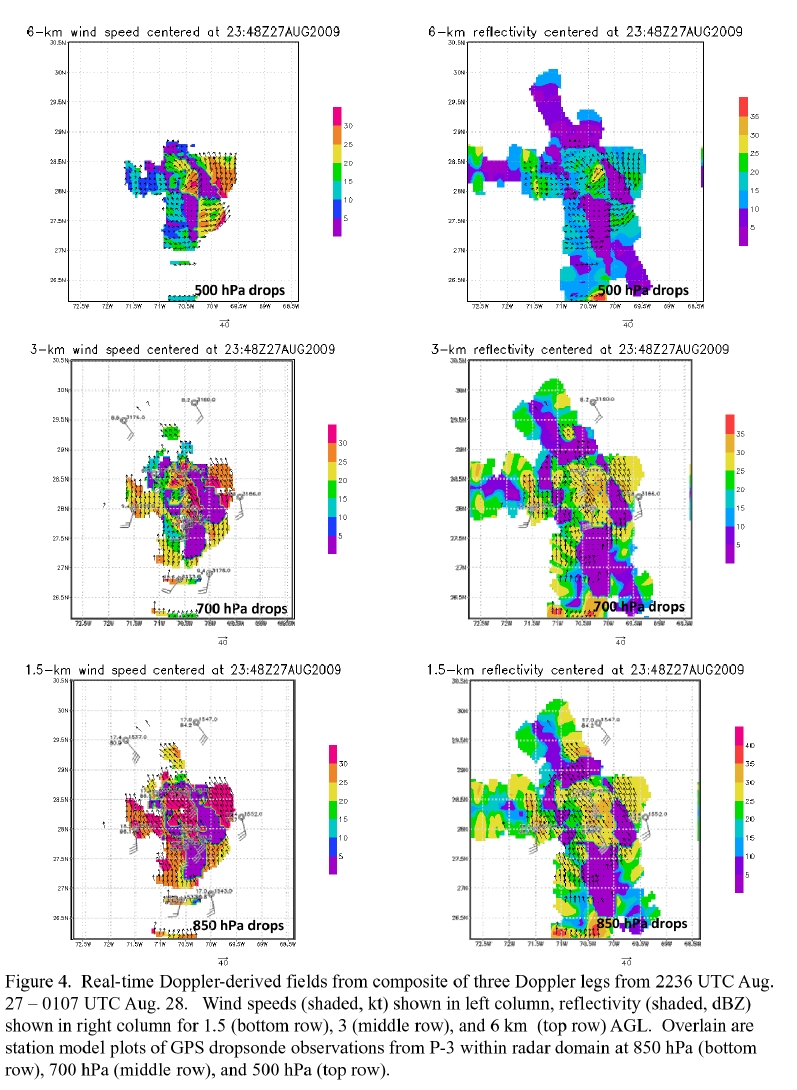
Otherwise the flight-level winds were southerly and southeasterly. Radar
analyses showed a circulation starting at about 6 km altitude (Fig. 4) and
peaking at 8 km. So there was a midlevel vortex, but it was above flight-level
. Below this altitude there were strong southerlies, so there was no chance
for reformation there. The system is becoming less organized. Isolated
convection continues, but it is becoming less widespread and remains on the
east side of the LLCC. There are some indications that dry air has wrapped
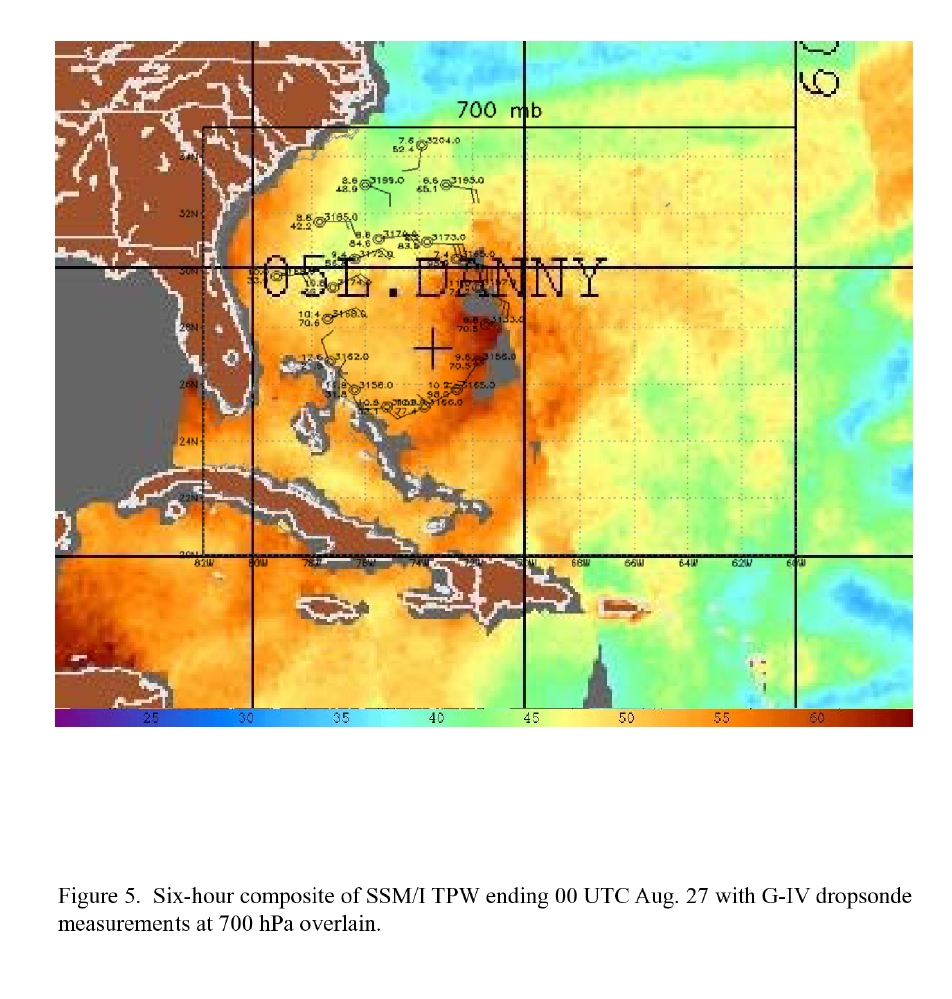
around the system at 700 hPa (Fig. 5), further choking it off. Peak SFMR winds
are about 40 kt on the east side of the LLCC. The aircraft returned to Tampa
at 0334 UTC. A total of 15 GPS sondes and 19 AXBT's were dropped.
Takeoff was at 2006 UTC. The pattern was flown generally as planned (Fig. 3).
On the first west-east leg, we saw a wind shift at flight-level just displaced
to the east of the LLCC. At the place where we anticipated a MLCC we found a
slight wind shift line from SW to SW, suggesting a convergence line there.
Otherwise the flight-level winds were southerly and southeasterly. Radar
analyses showed a circulation starting at about 6 km altitude (Fig. 4) and
peaking at 8 km. So there was a midlevel vortex, but it was above flight-level
. Below this altitude there were strong southerlies, so there was no chance
for reformation there. The system is becoming less organized. Isolated
convection continues, but it is becoming less widespread and remains on the
east side of the LLCC. There are some indications that dry air has wrapped
around the system at 700 hPa (Fig. 5), further choking it off. Peak SFMR winds
are about 40 kt on the east side of the LLCC. The aircraft returned to Tampa
at 0334 UTC. A total of 15 GPS sondes and 19 AXBT's were dropped.
Mission Evaluation:
To the extent that the mission was to sample a system struggling to organize
in shear and dry air, this flight accomplished its objectives. We targeted
convection to the east of the LLCC instead of the LLCC itself, which was
devoid of scatterers. Radar analyses produced in real time showed very
complex structures, including multiple vortices of different horizontal scale
at different altitudes. Ultimately the system was unable to reform in
convection, and likely will dissipate soon. Intensity guidance has been very
diverse, with mesoscale models predicting Danny to intensify to hurricane
strength. This case should provide good data to compare with models to find
error sources in the intensity forecasts.
Problems :
There were no problems with the flight.
Mission Data :
LPS log |
axbt log |
radar log |
Drop log
Error log |
NetCDF file |
1 seond data |
Fast data
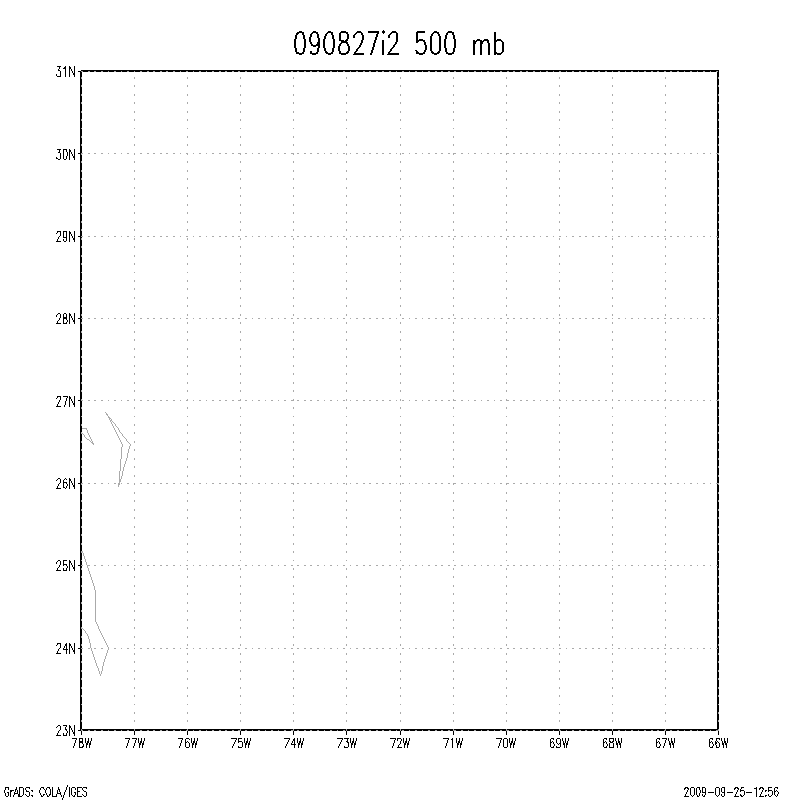
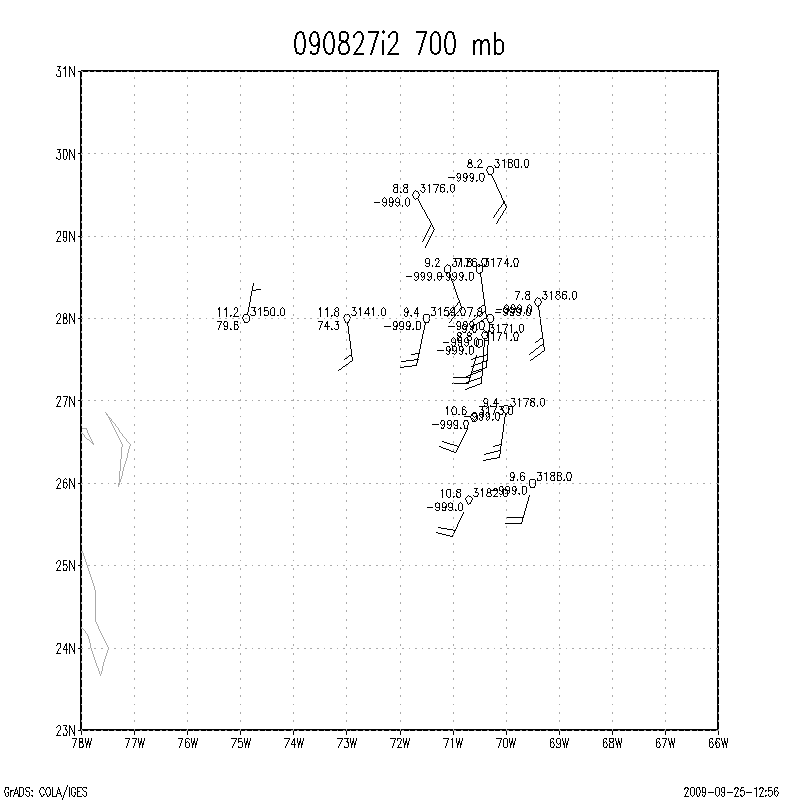
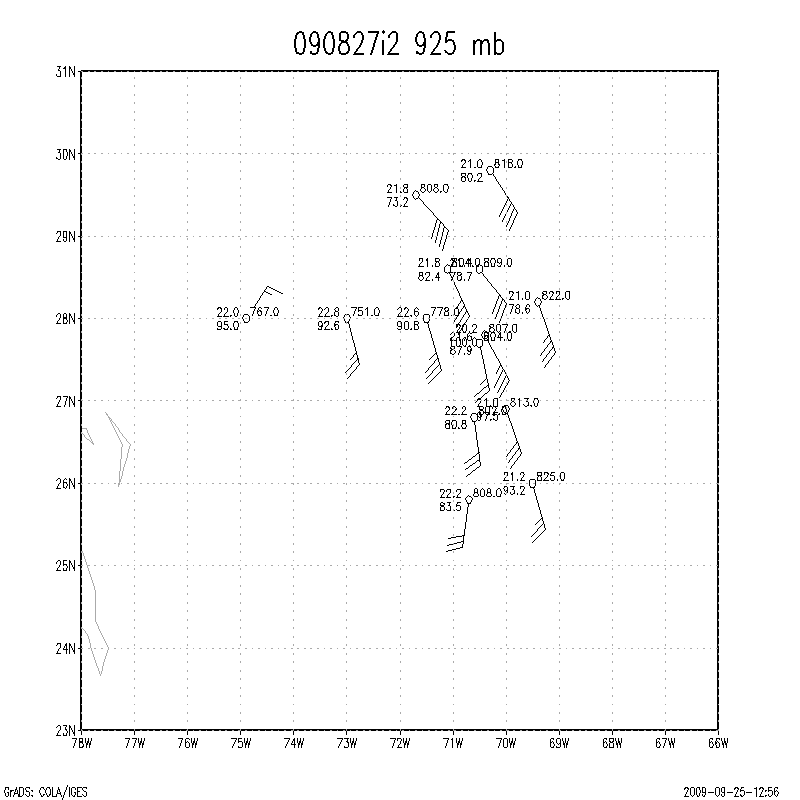
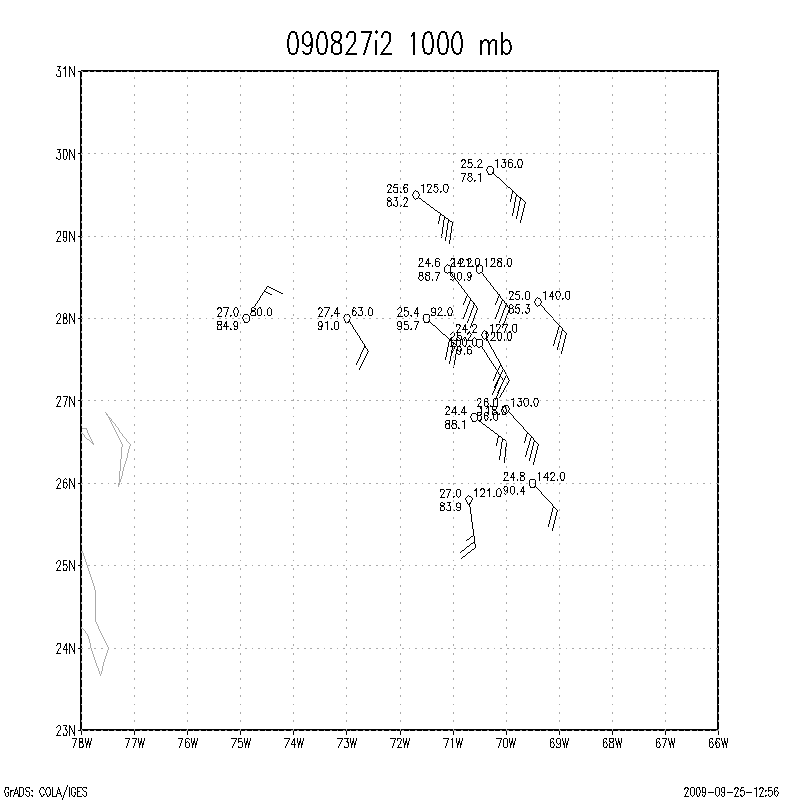
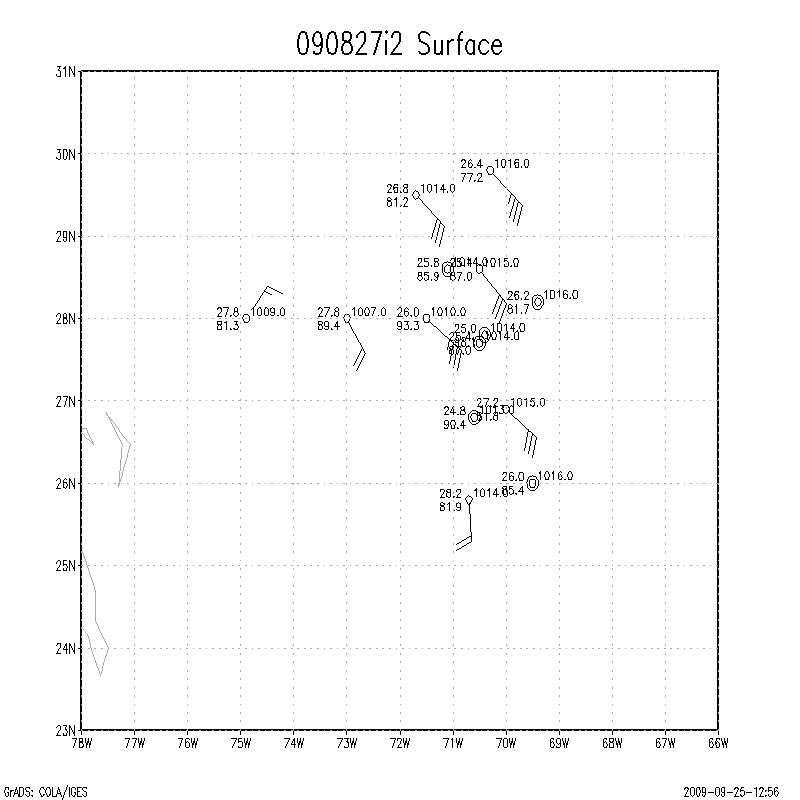
Pressure height maps of dropsonde data
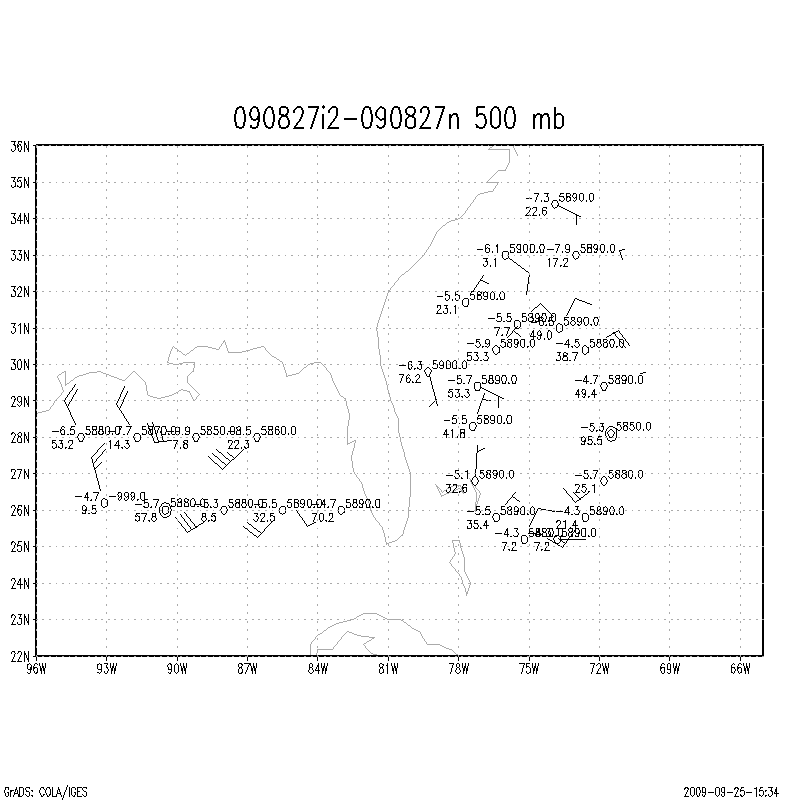
500mb map
700mb map
850mb map
925mb map
1000mb map
surface map
Pressure height maps of dropsonde data
(Both I2 and N1 flights)
500mb map
700mb map
850mb map
925mb map
1000mb map
surface map
Page last updated September 28, 2009
Return to Mission page.