Mission Summary
20090826I2 Aircraft 43RF
Genesis flight into Tropical Storm Danny 2009
Aircraft Crew (43RF)
| Aircraft Commander | Mark Nelson |
| Co-pilot | Amelia Ebhardt |
| Navigator | Joe Bishop |
| Flight Engineer | Joe Klippel |
| Flight Directors | Jack Parrish
Richard Henning |
| Data Tech | Terry Lynch |
| Dropsonde Operator | Dana Naeher |
| Electrical Engineer | Jim Roles |
Scientific Crew (43RF)
| Lead Project Scientist | Rob Rogers |
| Radar Scientist | Sylvie Lorsolo |
| Dropsonde Scientist | Shirley Murillo |
Mission Plan :
Perform TDR/early lifecycle mission into T.S. Danny, which was just declared a
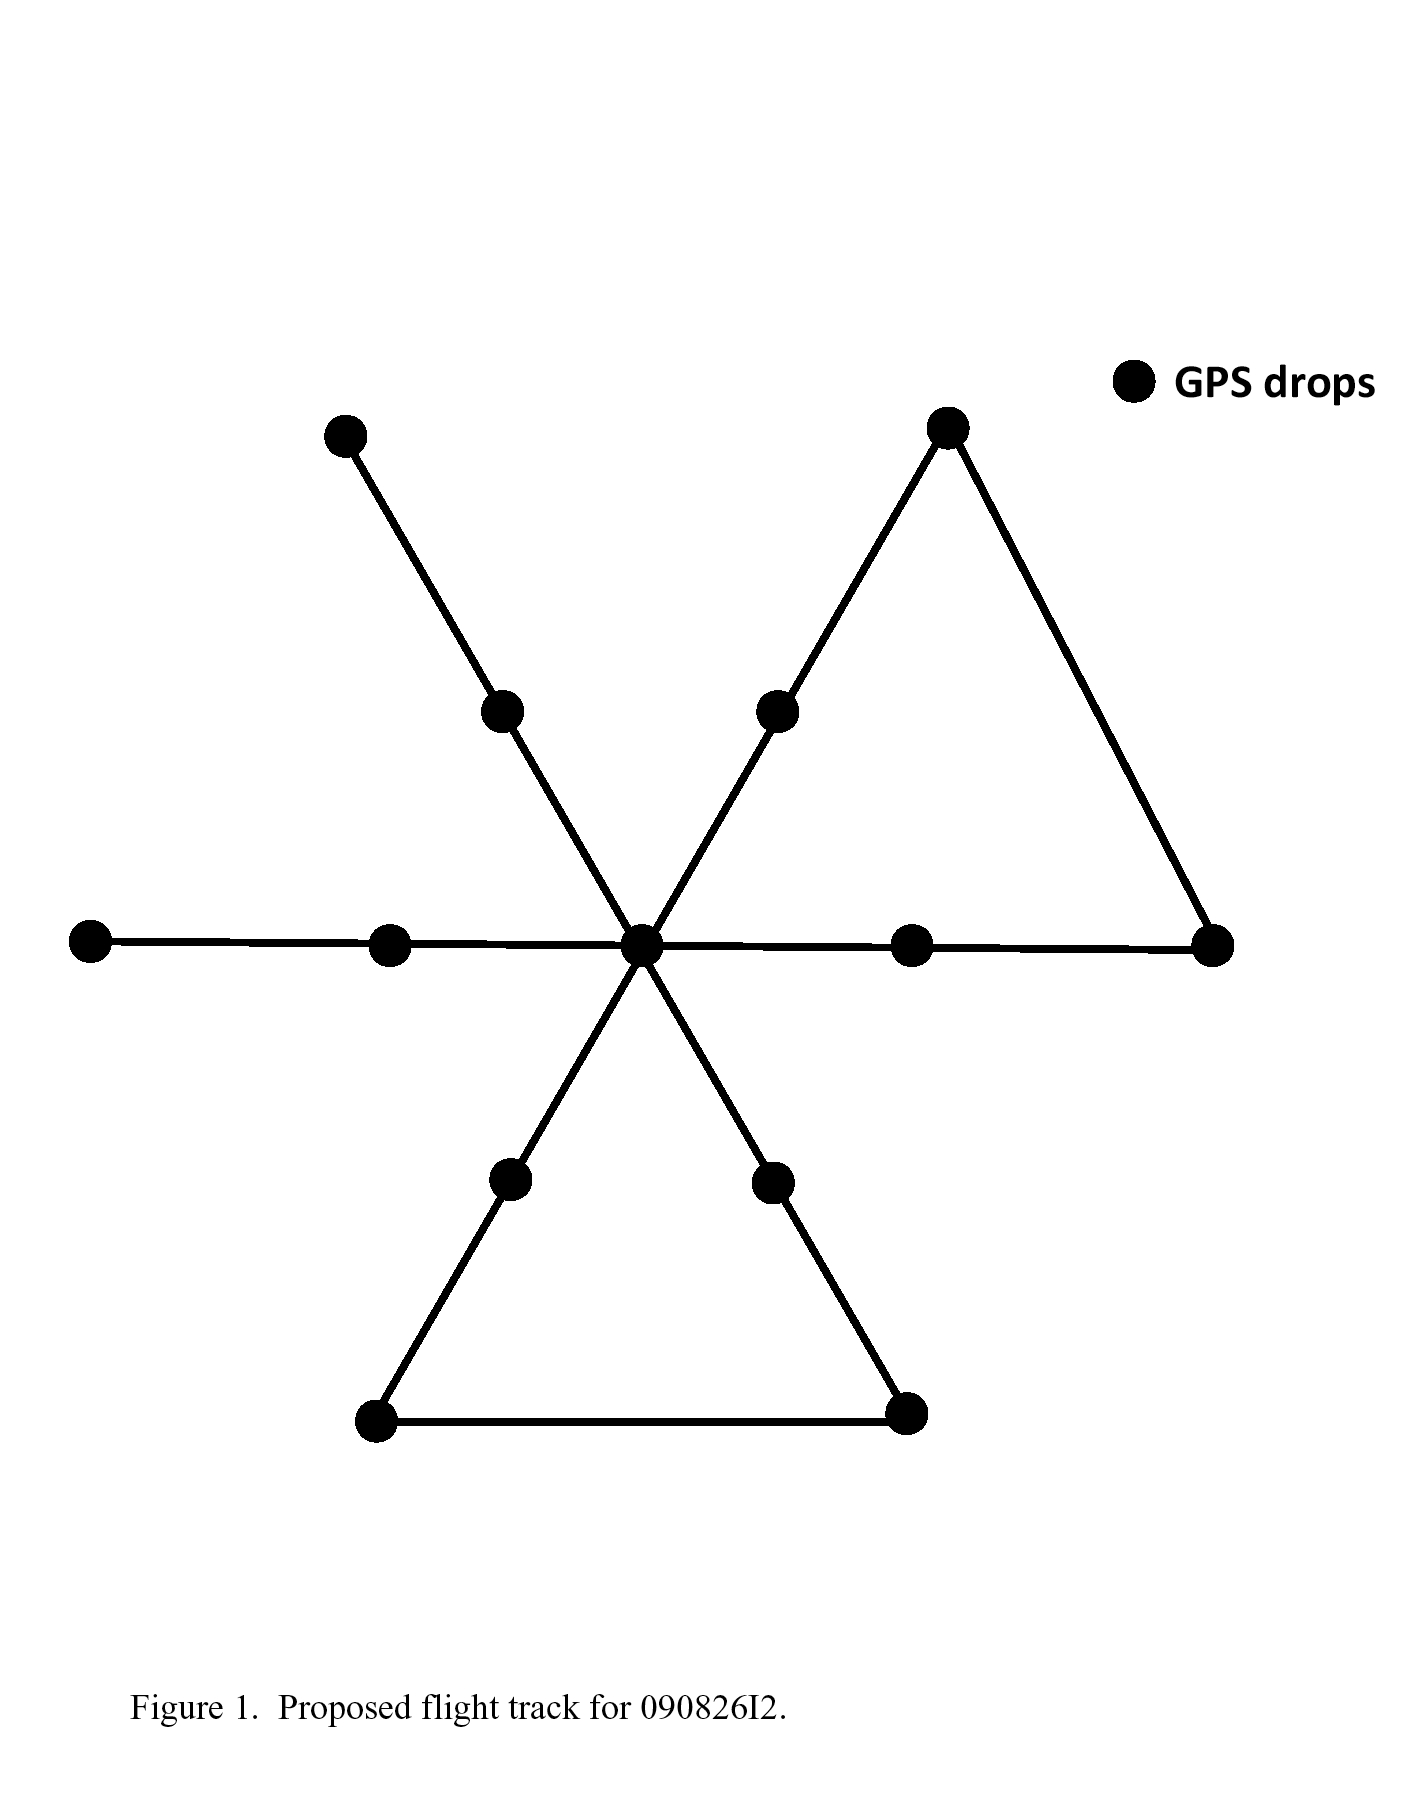
tropical cyclone at 11 AM EDT today. Fly butterfly pattern at 10,000 ft.
(Fig. 1), set IP 120 nm W of low-level circulation center (LLCC). Extend legs
to 150 nm on east and northeast side of storm to better sample convection on
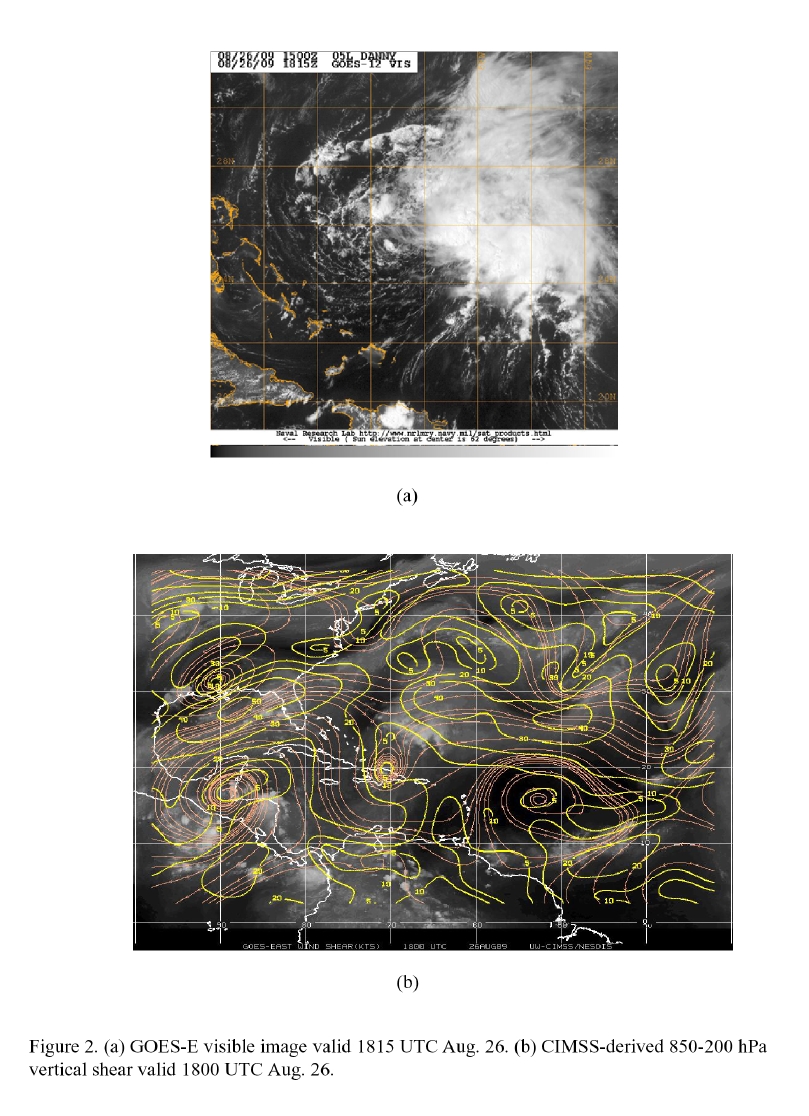
that side. Storm is highly asymmetric, with upper-low and SW shear still
impacting system (Fig. 2). NHC forecasts storm to slowly intensify to a
hurricane. Shorten legs on the south side if necessary. Drop sondes at end
points and midpoints of legs, and one drop at expected center of storm. Drop
AXBTs at integer longitudes prior to reaching IP and after leaving storm.
Mission Summary :
| Take off
| Landing
| MacDill AFB, FL | 20:14 UTC
| MacDill AFB, FL | 04:11 UTC
| |
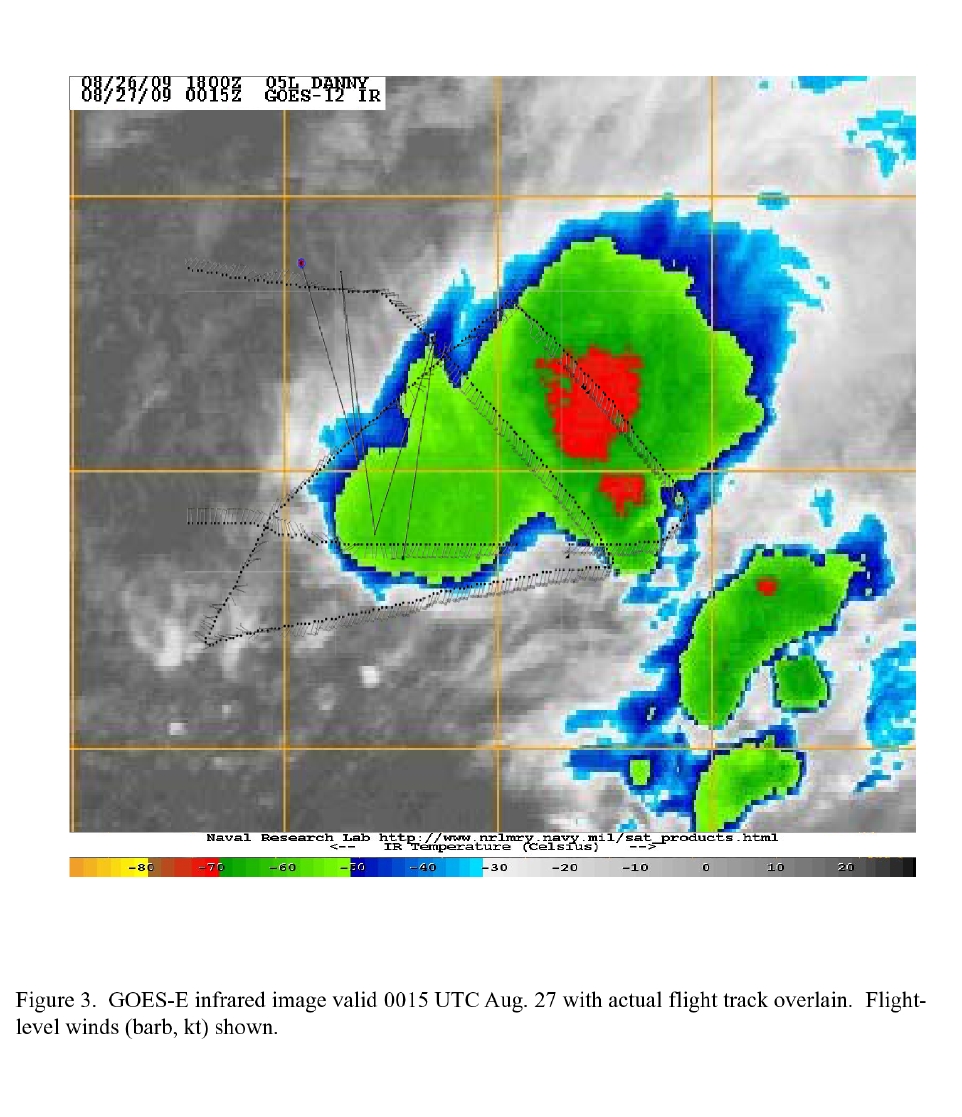
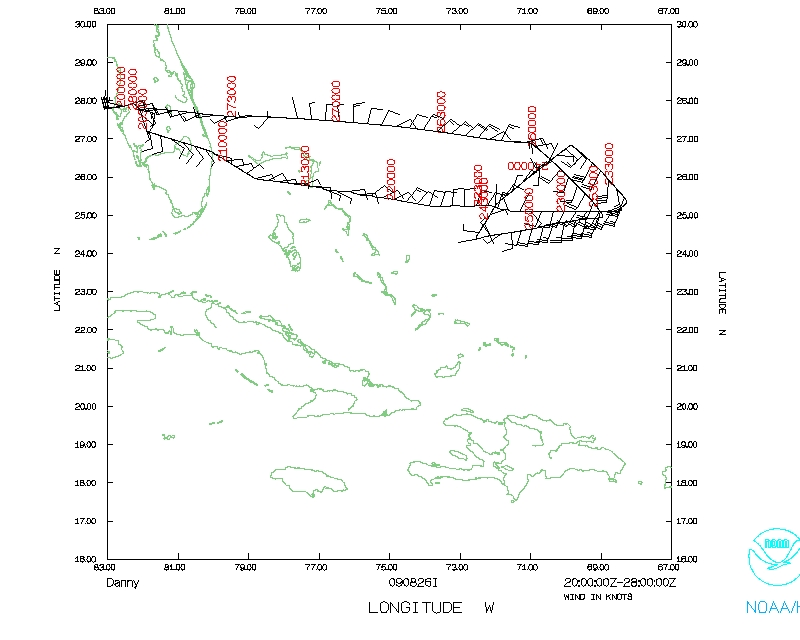
Takeoff was at 2014 UTC. A modified version of the butterfly pattern was
flown to try to account for the very asymmetric precipitation and
rapidly-changing structure of Danny (Fig. 3). Satellite imagery showed the
LLCC well-displaced to the SW of the convection. We targeted the LLCC with
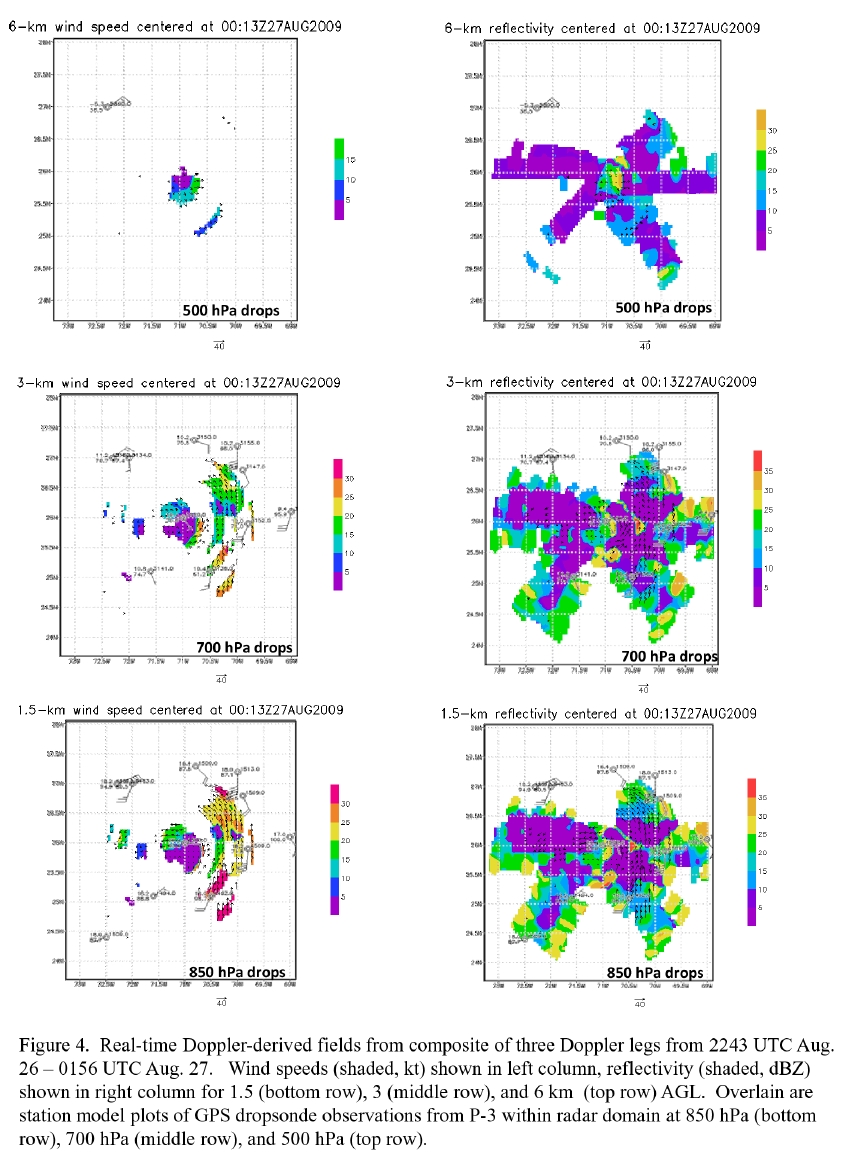
long legs on the east and northeast side of the pattern. There were limited
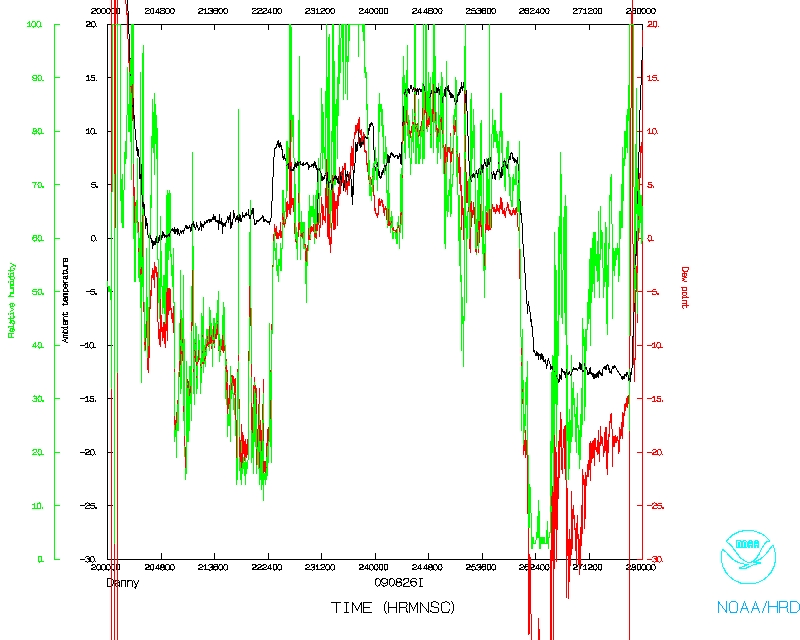
scatterers in the pattern on the west-east leg (Fig. 4). We extended the
west-east leg 10 nm on the east side to avoid convection. On the inbound
NE/SW leg we had trouble finding a NW wind (Fig. 3), indicating the center at
flight-level was reforming to the east. We therefore cut the outbound SW leg
short and extended the downwind leg to the SE point to get closer to convection
and set up for a final inbound leg in the possibly newly-forming center. We
dropped sondes at the endpoints and midpoints, and found peak SFMR winds of 45
kt in the northeast convection. Some lightning was in this convection too.
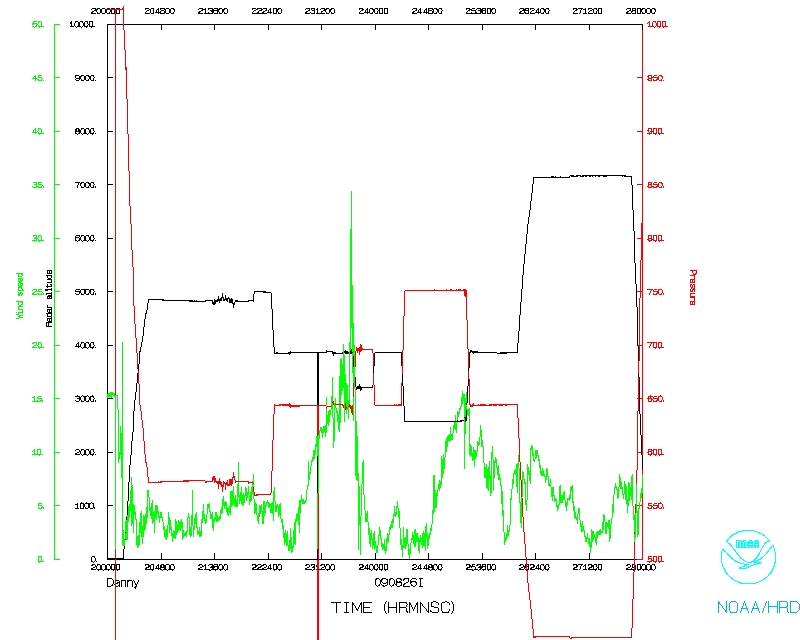
We descended to 8000 ft. and went in sector mode for the LF radar on the south
side of the pattern for the UMass scientists onboard. We dropped 10 AXBTs at
1-degree longitude spacings on the ferries to and from the storm. Sea-surface
temperatures were about 28 C ahead of the system. The aircraft returned to
Tampa at 0411 UTC. There were 13 GPS sondes and 10 AXBTs dropped.
Mission Evaluation:
This was a very complicated pattern in a complicated system. The storm was
very asymmetric, with limited scatterers and a rapidly-evolving structure.
Nonetheless the flight seems to have captured a system that was undergoing
center reformation associated with convective bursts to the northeast of a
LLCC. Preliminary radar analyses show a flight-level center to the NE of the
previous position and near deep convection in the radar and satellite imagery.
This could show a nice example of a weak system trying to organize in the
presence of upper-level shear and dry air.
Problems :
There were limited problems with the flight. All of the dropsondes worked
fine except the last one, which was a late launch detect. All of the AXBTs
worked except for the first one.
Mission Data :
LPS log
|
axbt log
|
radar log
|
Drop log
Error log
|
FAST data
|
NetCDF file
|
1 second
Pressure height maps of dropsonde data
500mb map
700mb map
850mb map
925mb map
1000mb map
surface map
Pressure height maps of dropsonde data
(Both I2 and N1 flights)
500mb map
700mb map
850mb map
925mb map
1000mb map
surface map
Page last updated September 28, 2009
Return to Mission page.


