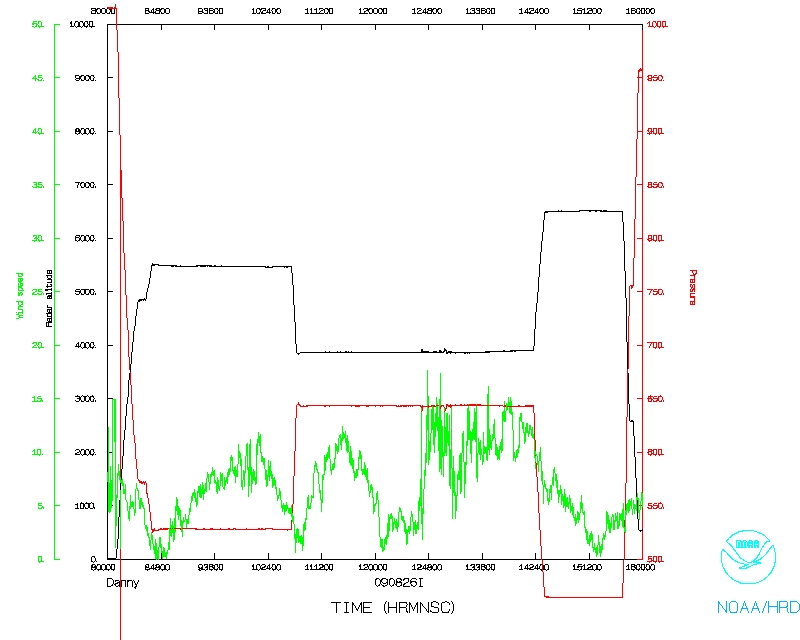
Mission Summary
20090826I1 Aircraft 43RF
Genesis flight into Trop. Dist. 92L 2009
Aircraft Crew (43RF)
| Aircraft Commander | |
| Co-pilot | |
| Flight Engineer | |
| Flight Director | |
| Flight Director | |
| Dropsonde Operator | |
| Dropsonde Operator | |
| Dropsonde Operator | |
| Dropsonde Operator | |
Scientific Crew (43RF)
| Lead Project Scientist | Sim Aberson |
| Workstation Scientist | Paul Leighton |
| Dropsonde Scientist | Jun Zhang |
|
|
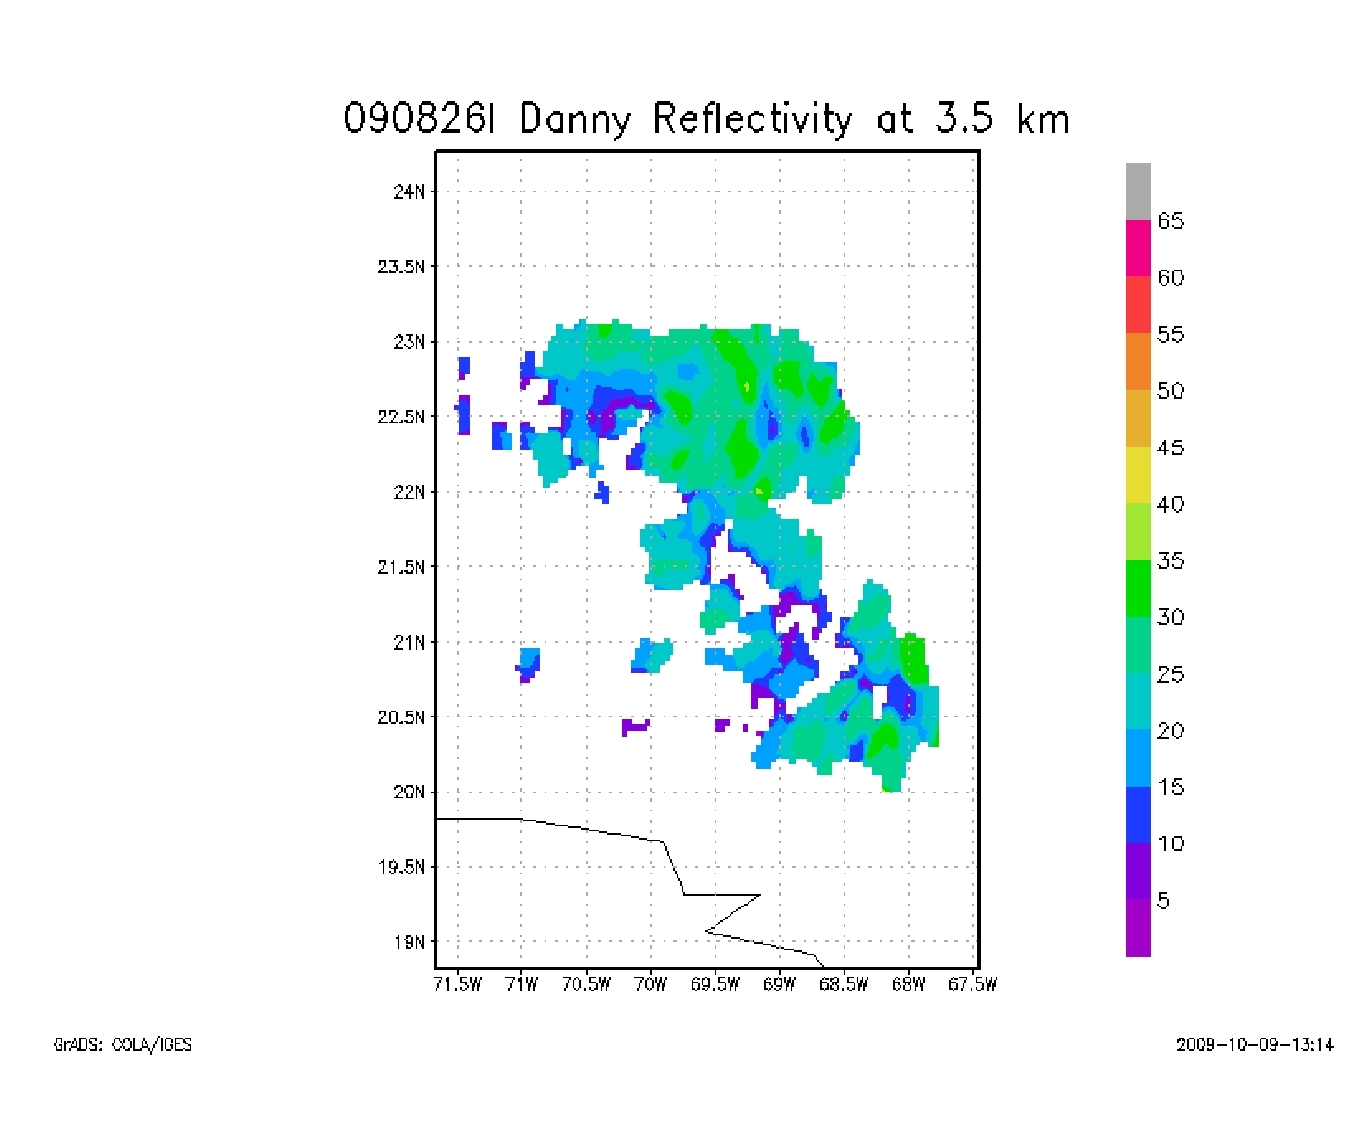
Figure 1. Merged reflectivity at 3.5 km from three real time radar
analyses. The center of the system was located at the northwestern point.
|
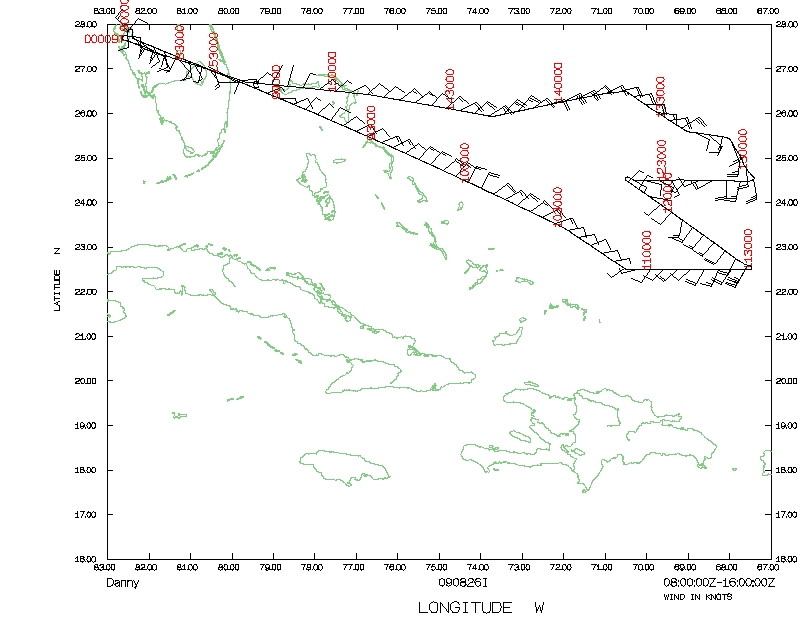
Mission Plan :
A genesis mission around what was to become Tropical Storm Danny east of the
Bahamas. A zigzag pattern was to be executed to sample the storm and
environment with dropwindsondes in all quadrants.
Mission Summary :
| Take off
| Landing
| MacDill AFB, FL | 08:07 UTC
| MacDill AFB, FL | 16:02 UTC
| |
The mission was fully successful. The zigzag pattern was modified after takeoff
to accommodate the changing structure of the system. Despite the lack of a
center, three radar analyses were completed and sent from the plane. Twelve
dropwindsondes were successfully sent as well. There were minor issues with
the radar going down periodically. A reboot of the HAPS caused one sonde to be
incomplete. The sonde was sent off the aircraft, but was corrected and resent.
A merged radar analysis (Fig. 1) shows that convection was mainly seen to the
east of the center, located at the northwestern point in the figure. The system
was highly sheared at the time and was able to produce vigorous convection east
of the center that showed reflectivity up to 16 km (not shown).

|
|
|
|
|
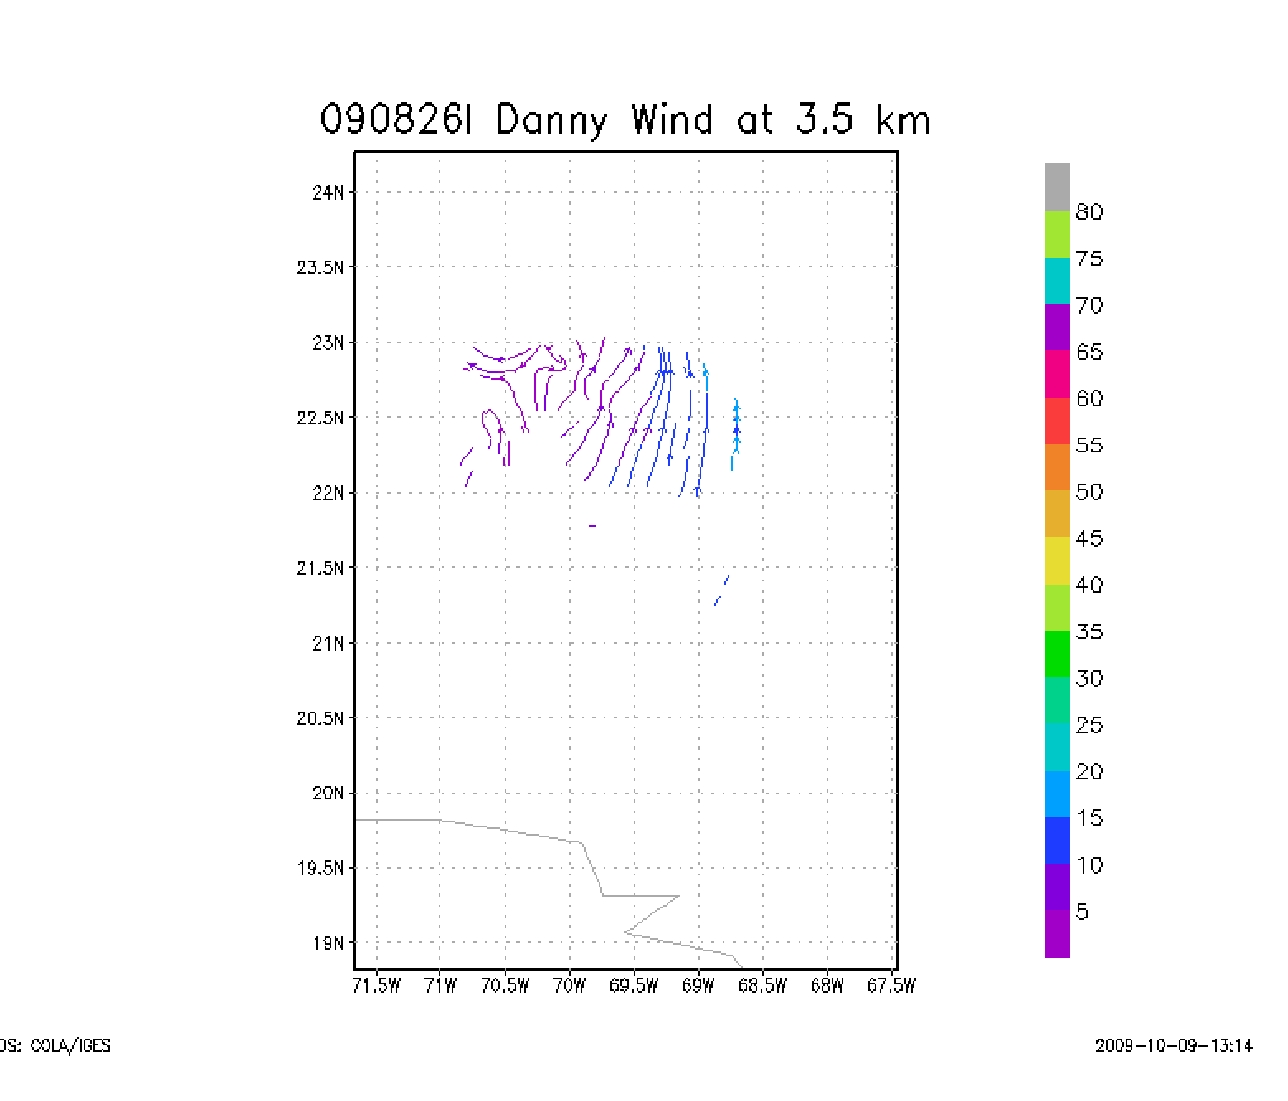
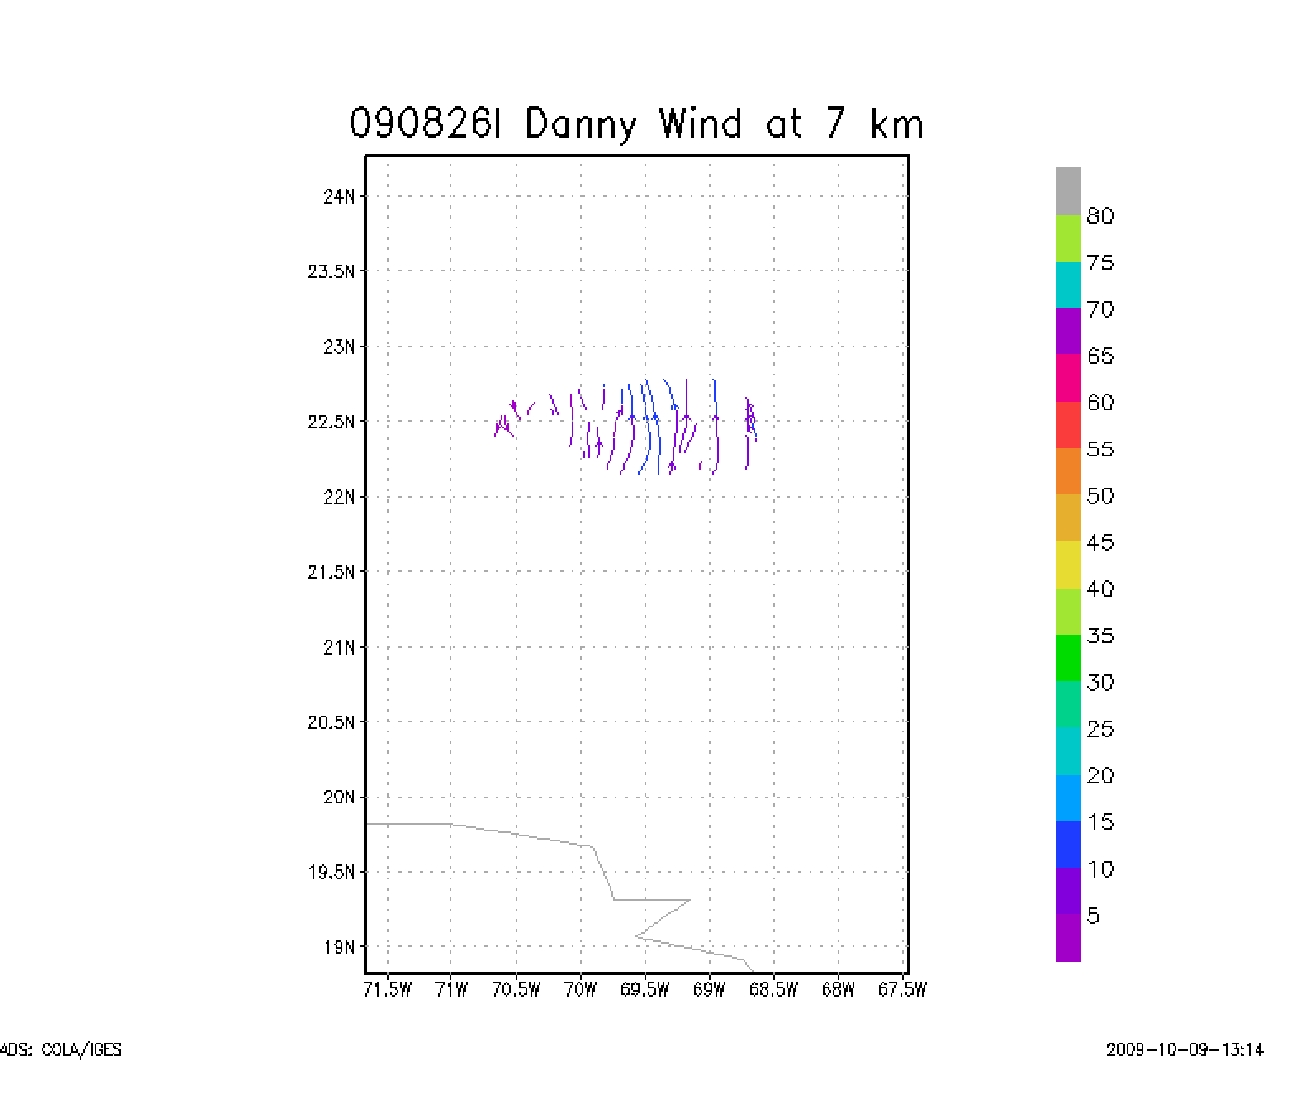
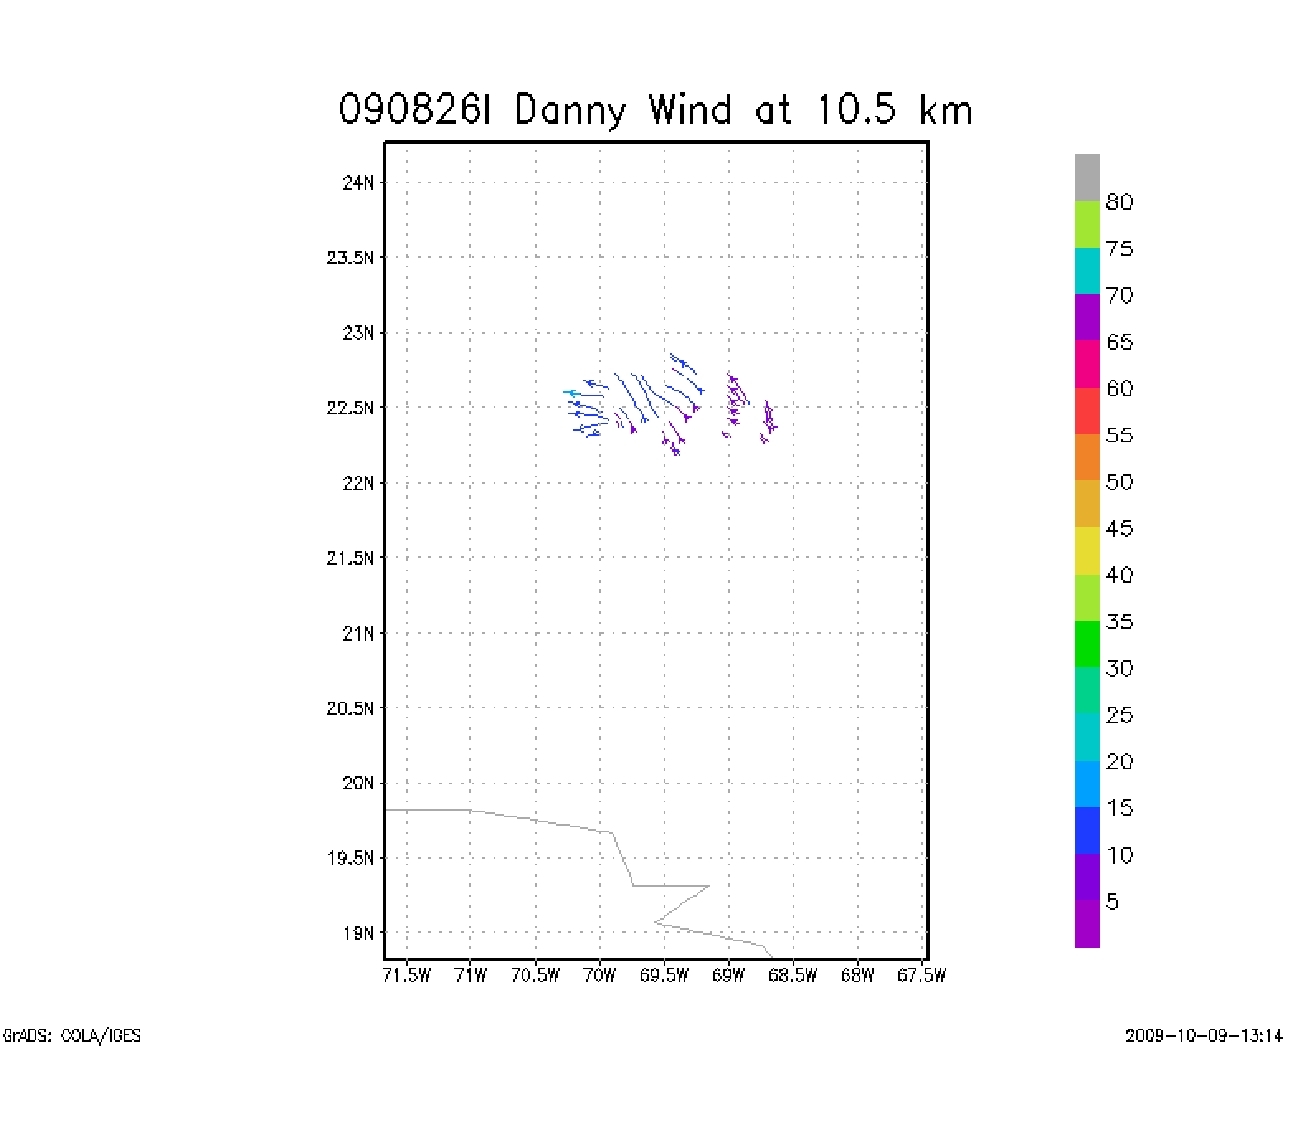
Figure 2. Merged radar wind analyses at 2.5, 3.5, 7.0, and 10.5 km
altitude.
|
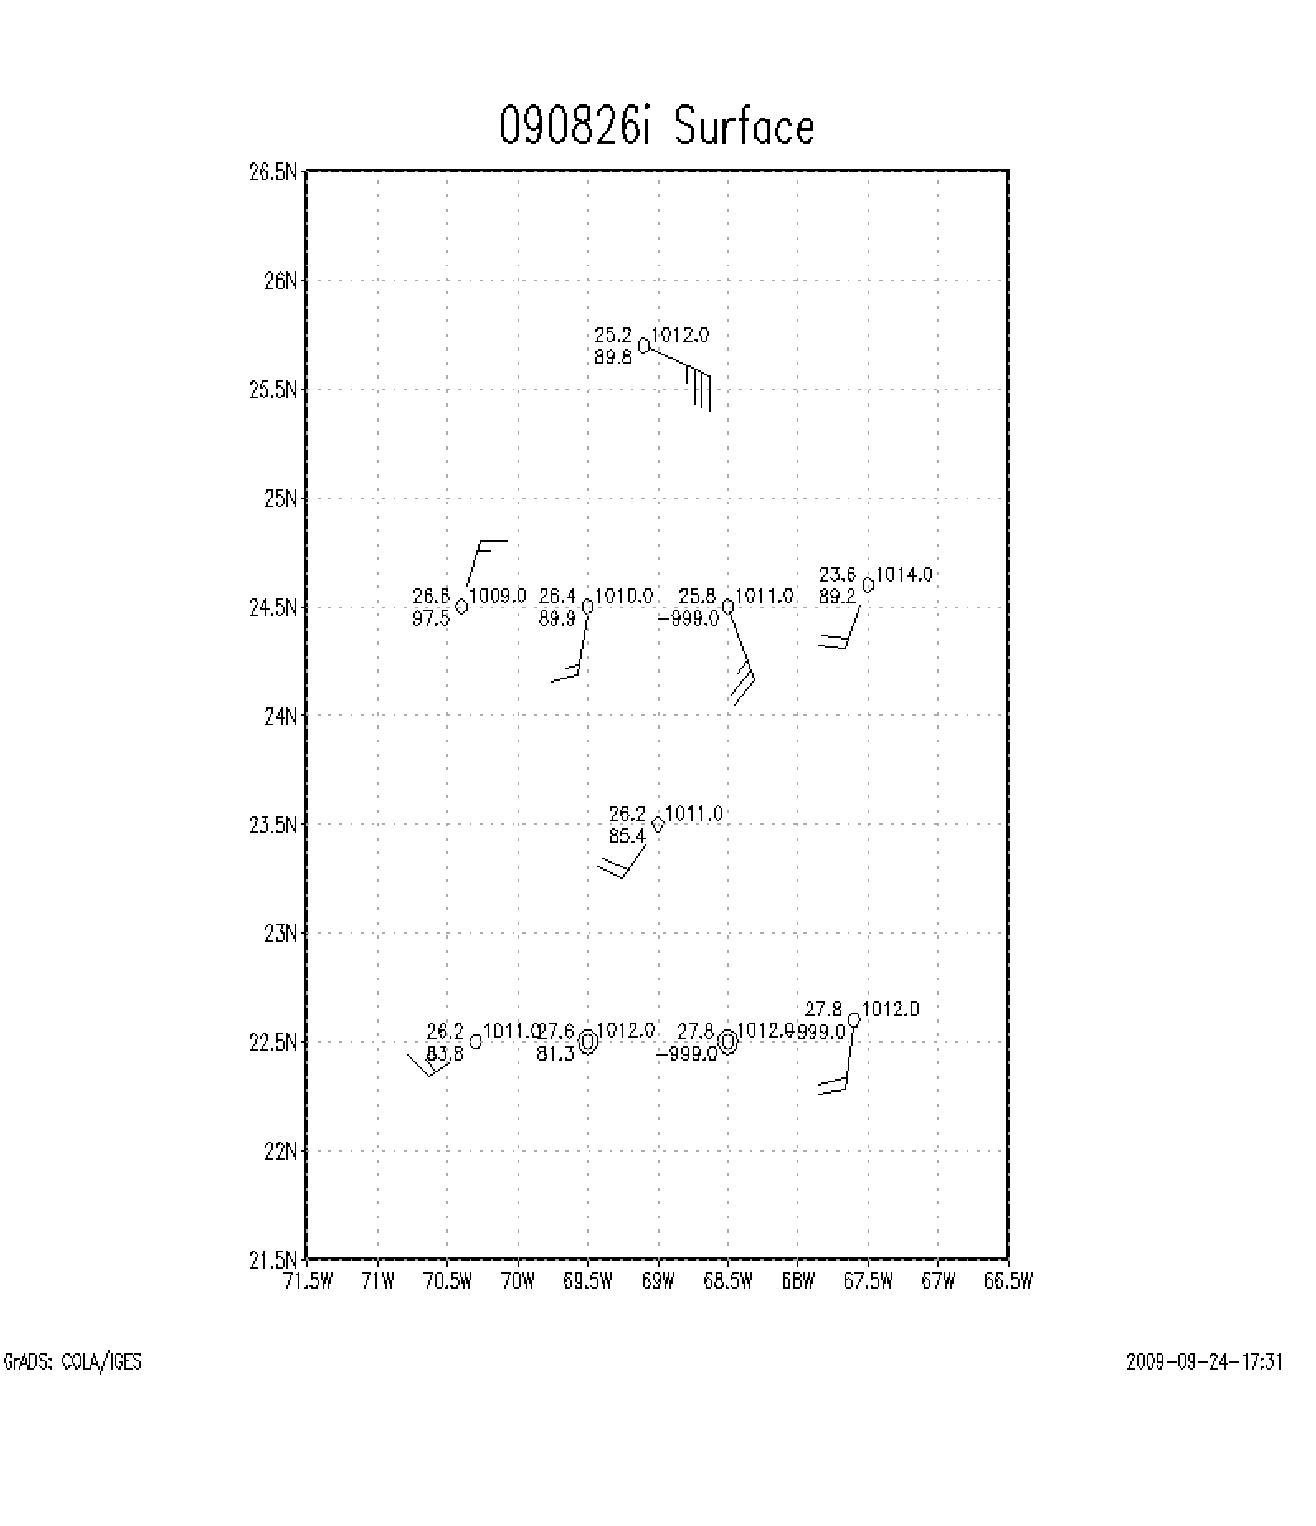
Merged wind analyses (Fig. 2) show southerly flow throughout at low levels with
strongest winds well east of the center. Multiple weak cyclonic centers are
visible at midlevels (3.5 - 7.0 km). The flow at upper levels becomes strong
and easterly, exemplifying the shear over the system. However, dropwindsondes
showed a rather coherent larger circulation in this region up to 3.0 km.
(Fig. 3). Because of the lack of reflectors at the dropwindsonde location, this
feature did not appear in the radar analyses.
|
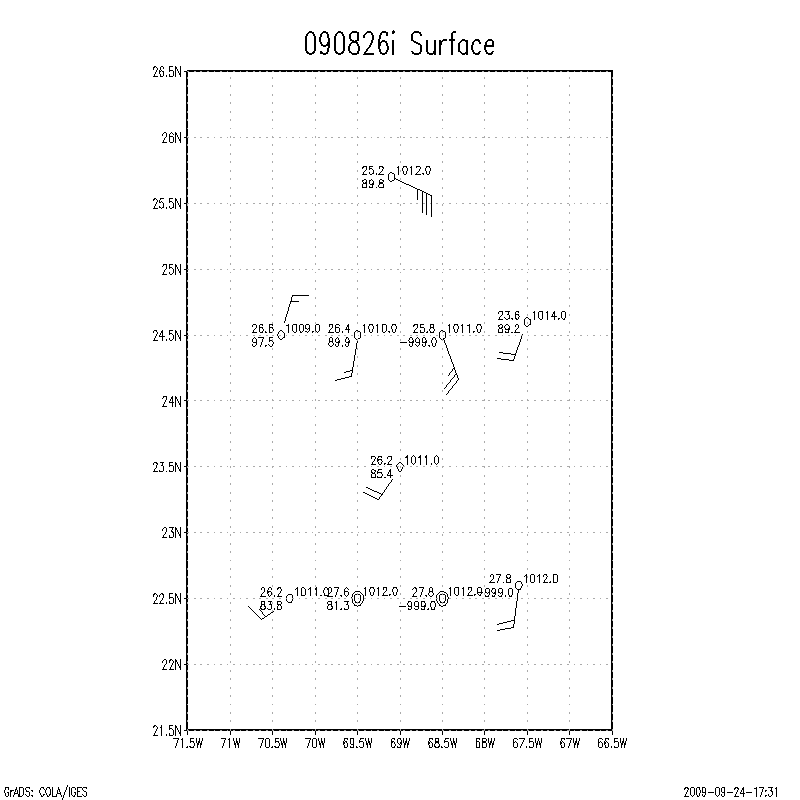
|
|
Figure 3. Dropwinsonde data at the surface and 950 hPa.
|
Problems :
Mission Data :
Error log |
LPS log |
Radar log |
Drop log
|
g'zipped Fast file
|
NetCDF file
|
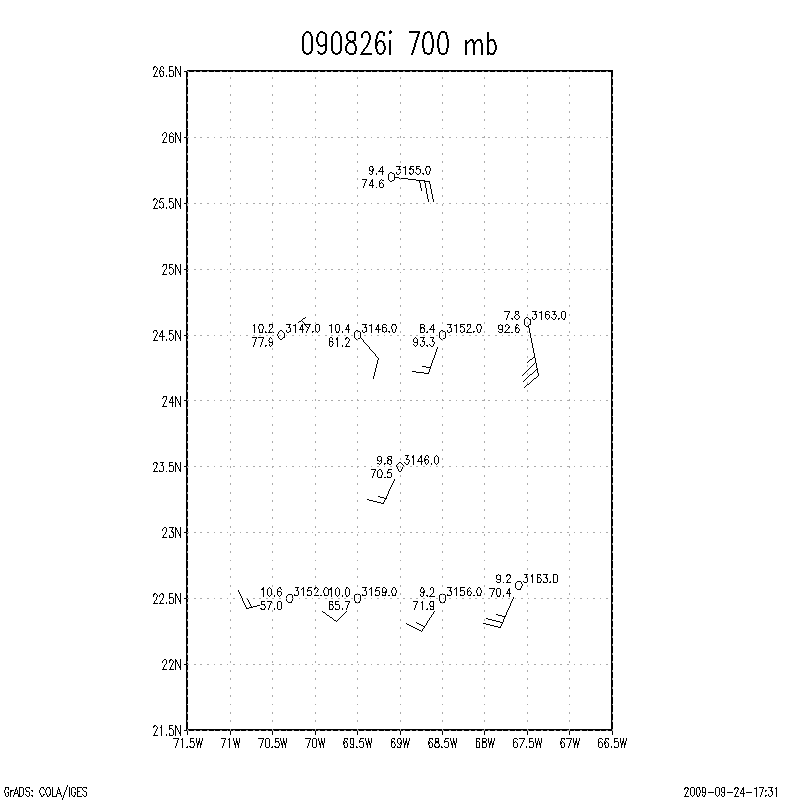
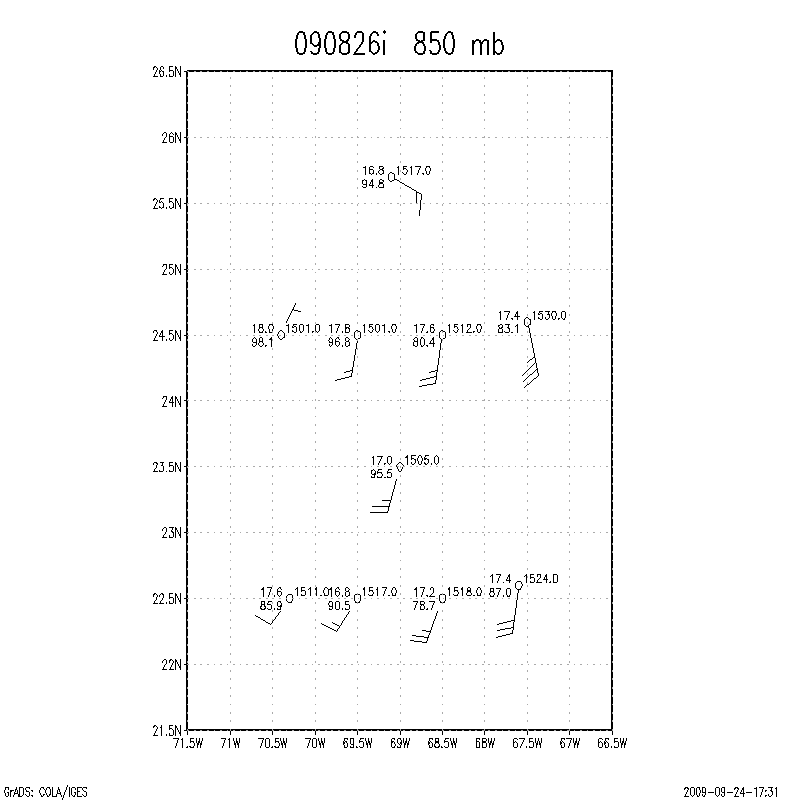
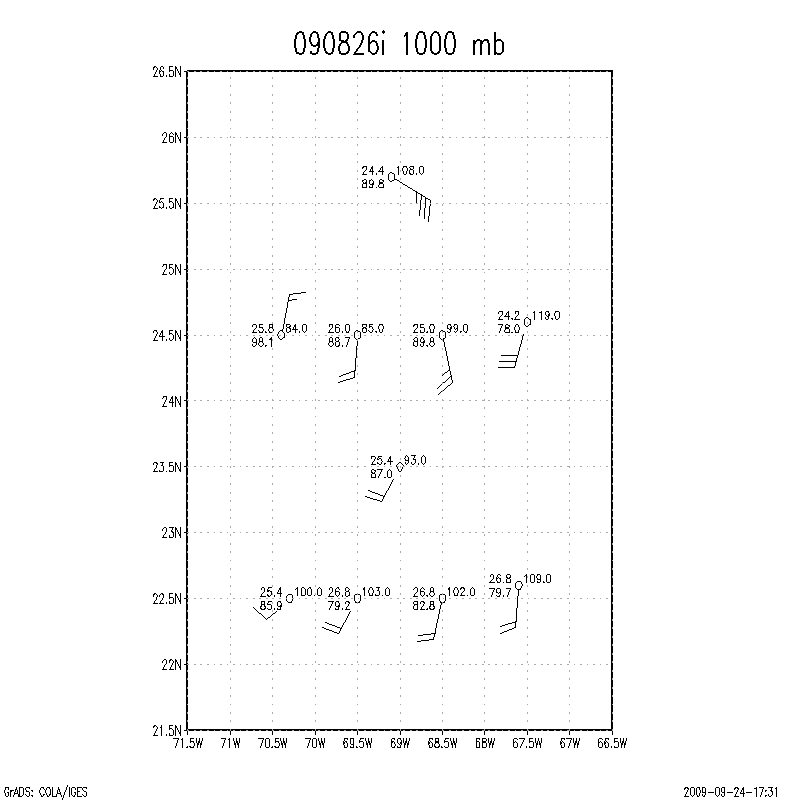
1 second
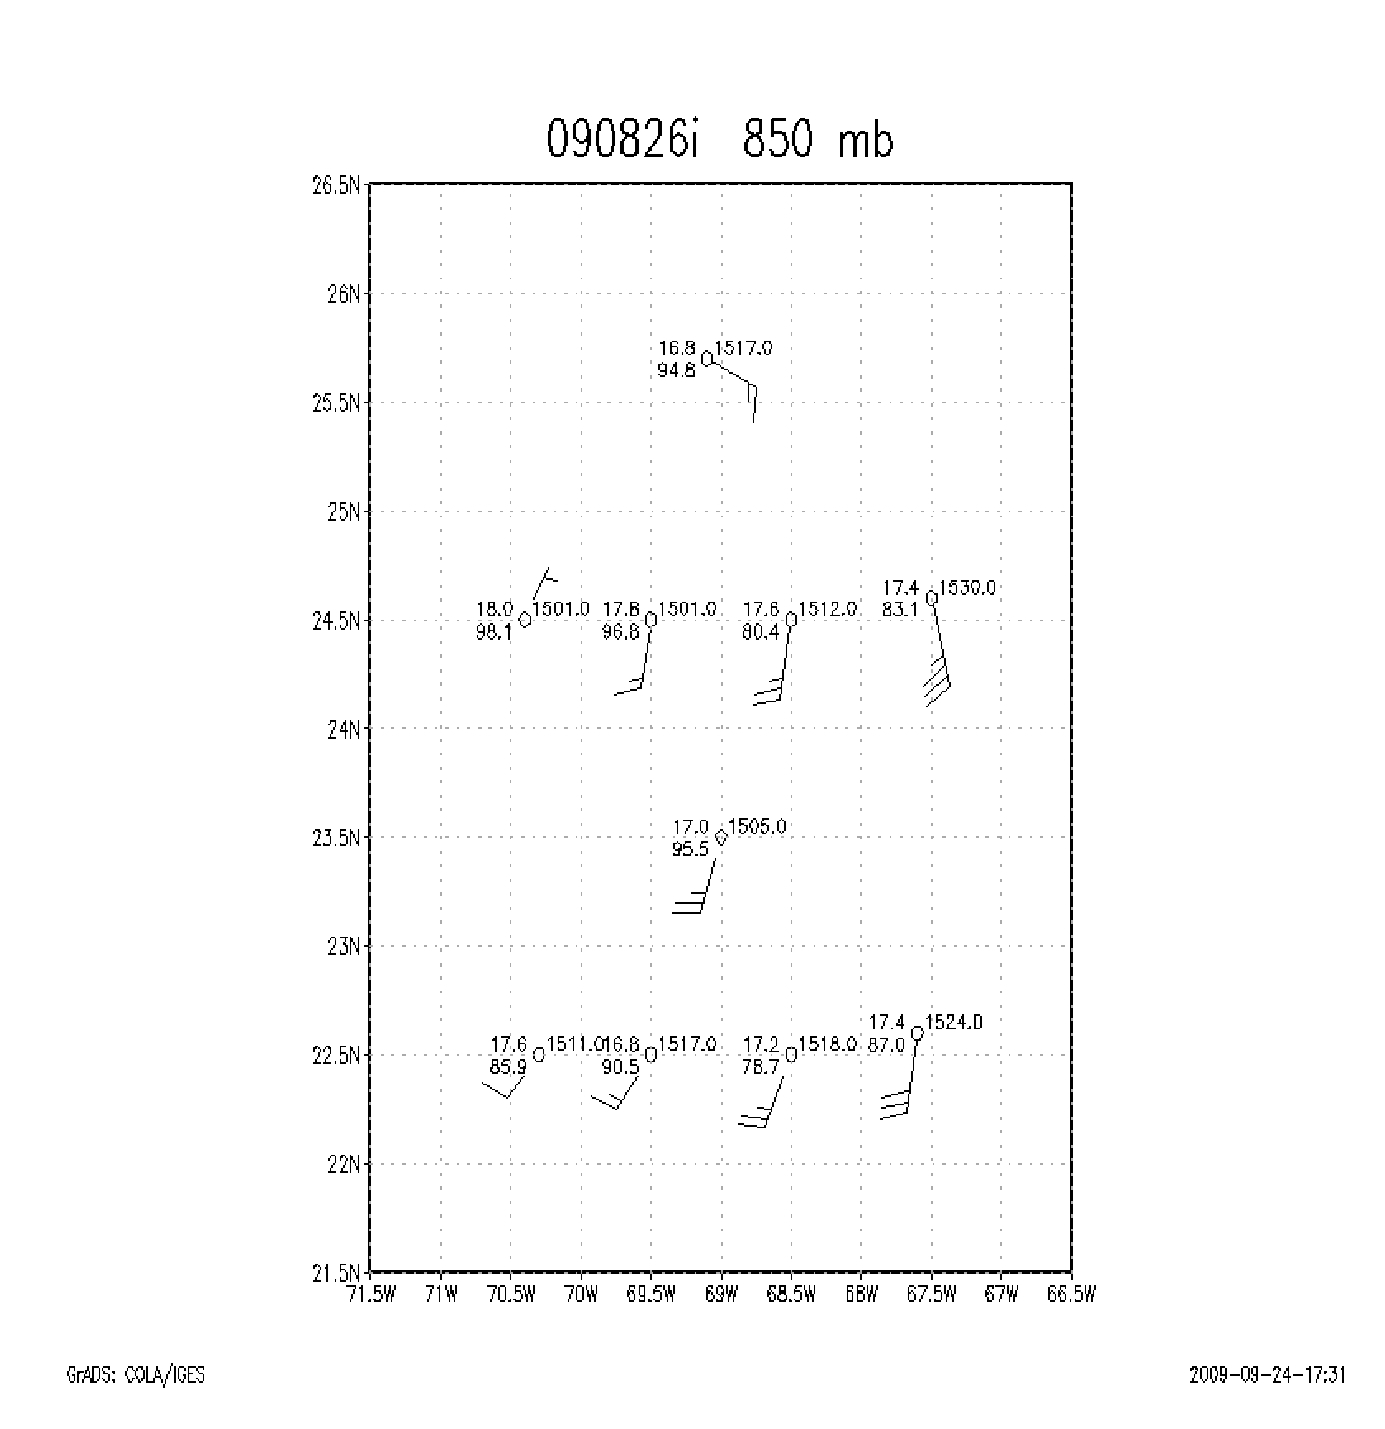
Pressure height maps of dropsonde data
700mb map
850mb map
925mb map
1000mb map
surface map
Page last updated August 26, 2009
Return to Mission page.