|
|
| Aircraft Commander | Harris Halverson |
| Co-pilot | Pat Didier |
| Co-pilot | Chris Kerns |
| Navigator | Tim Gallagher |
| Flight Engineer | Ken Heystek |
| Flight Engineer | Paul Darby |
| Flight Director | Rich Henning |
| System Engineer | Jim Roles |
| Data Technician | Terry Lynch |
| AVAPS | Todd Richards |
| LPS | Rob Rogers (HRD) |
| Radar | Jun Zhang(HRD) |
| Dropsonde | Frank Marks (HRD) |
| CCN spectra | Luke Ziemba (NASA) |
Mission Plan :
|
|
|
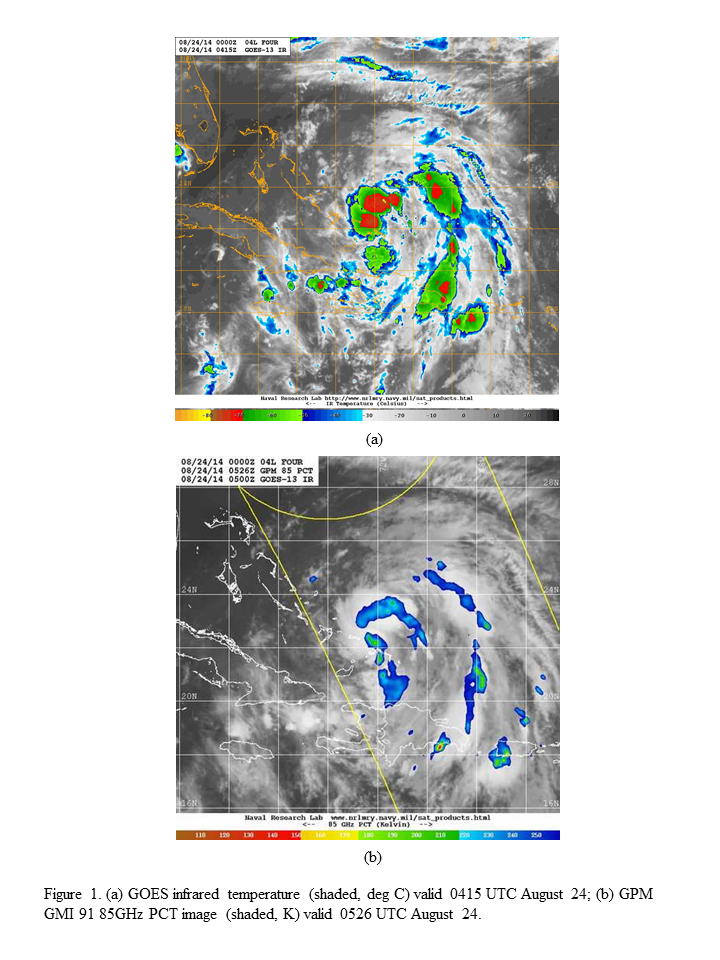
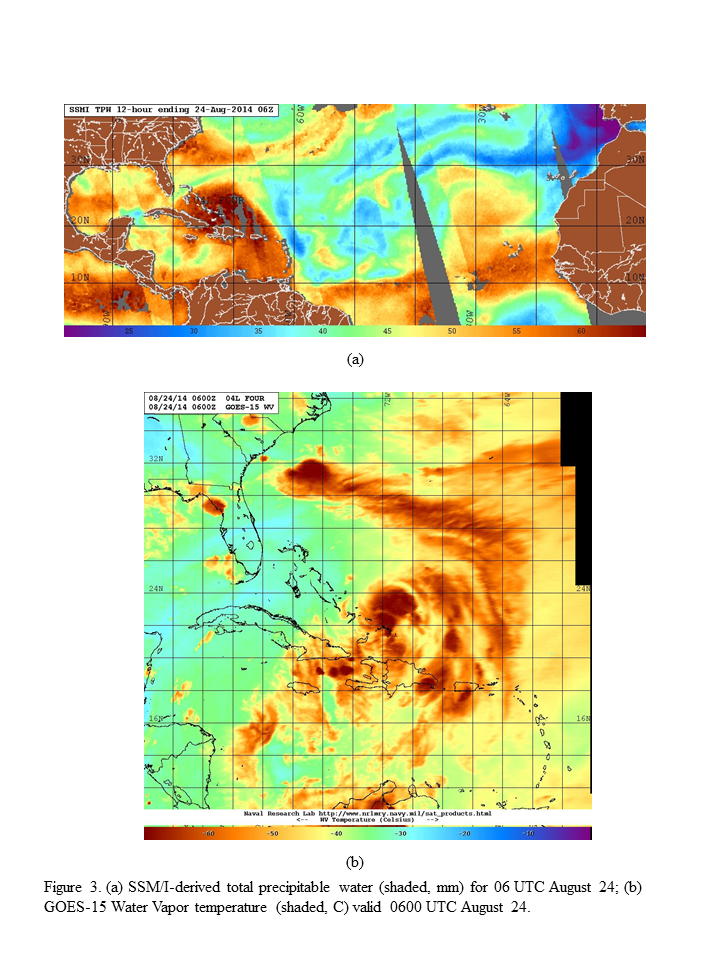
NOAA42 will conduct an EMC-tasked TDR pattern in Tropical Depression #4, which is still trying to organize in the southeast Bahamas. The system was declared a tropical depression less than 12 h earlier, and it still has a diffuse circulation based on recent reconnaissance reports. Some convection has developed near the center in the hours prior to takeoff, with infrared cloud top temperatures < -70 C and 85 GHz PCT values of 180-190 K (Fig. 1). The environment appears generally favorable, with westerly shear on the order of 10 kt around the northeast side of a broad region of anticyclonic shear. A trough axis off the northeast U.S. coast is also evident in the shear field, but this trough is still at least 1000 km from the developing system (Fig. 2).
|
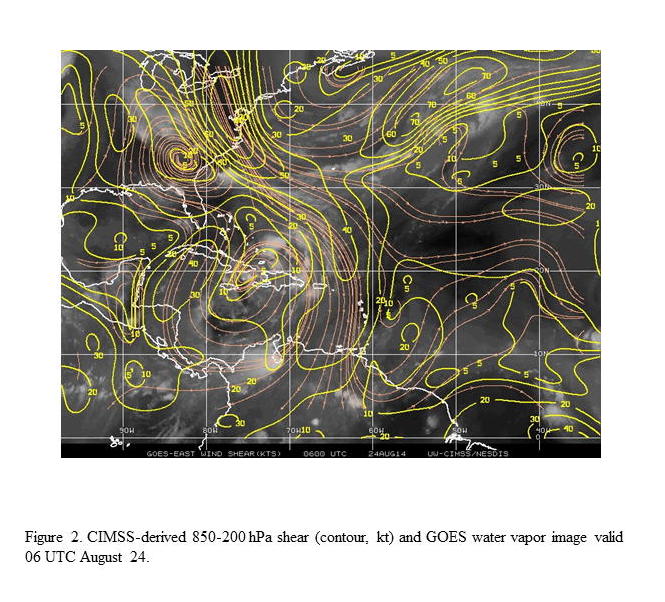
High sea-surface temperatures and an improving upper-level outflow structure are also environmental features that support continued development of TD#4. However, the moisture environment shows a significant horizontal variation from the northwest to the southeast sides of the storm. The total precipitable water plot shows moist low-level conditions around TD#4 and to the east and southeast, but a ribbon of dry air to the northwest that extends through the northweast Bahamas and into south Florida (Fig. 3).
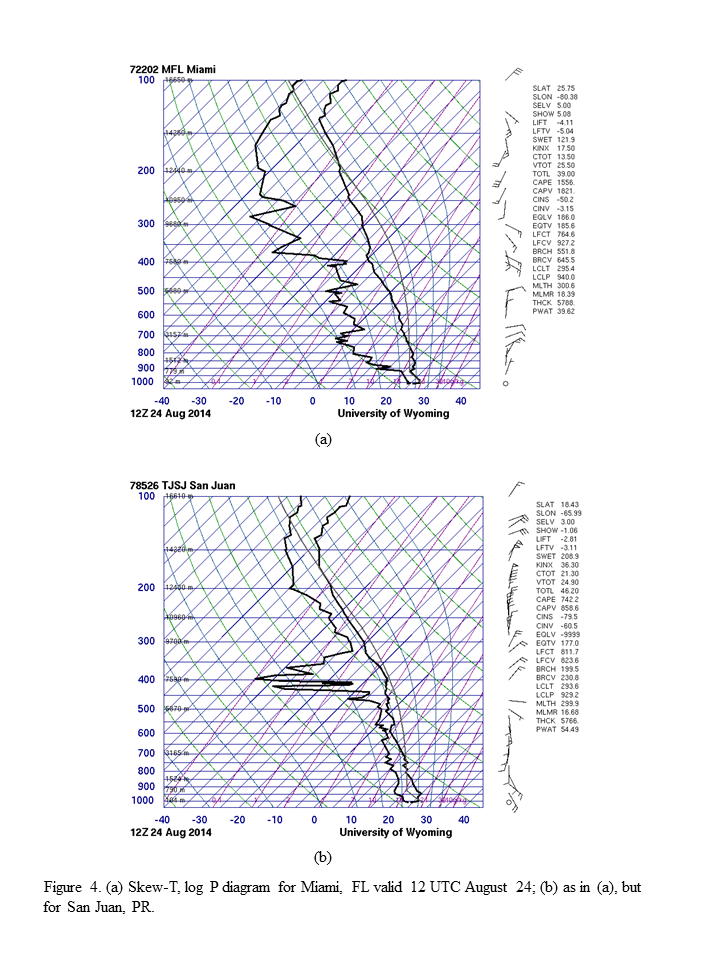
The water vapor temperature similarly shows a moist middle to upper troposphere around the system and to the east-southeast, while on the northwest side the upper-level environment is much drier. Soundings from 12 UTC that morning from Miami, FL and San Juan, PR (Fig. 4) confirm this northwest/southeast variation in both lower and upper-level humidity.
|
|
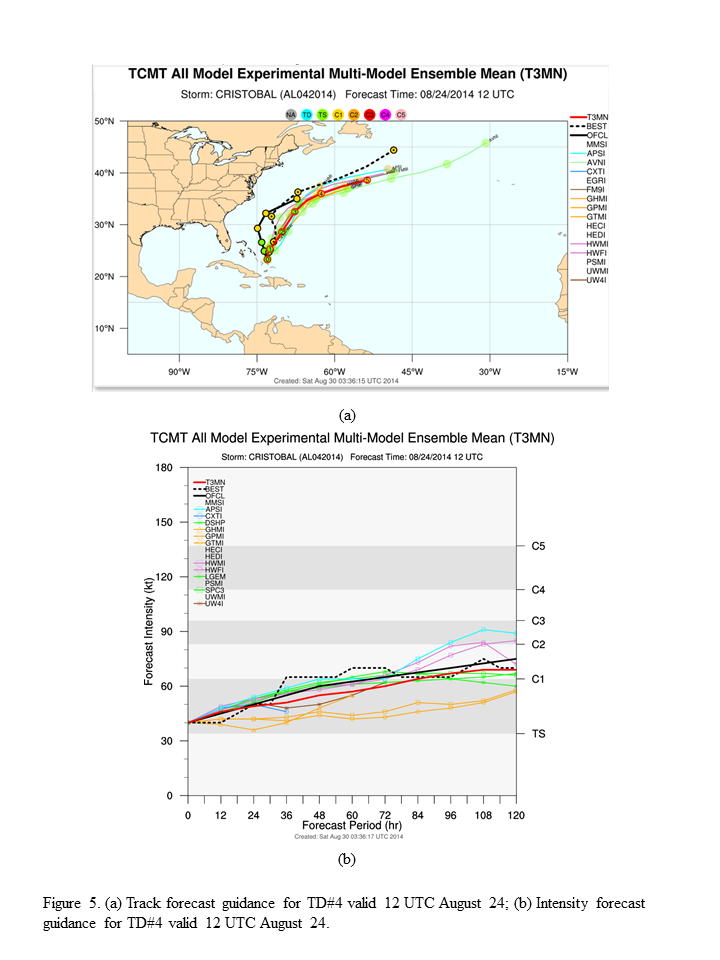
The track forecast guidance (Fig. 5) generally calls for a slow motion toward the north or north-northeast for ~72-96 h, after which time the storm should accelerate to the northeast as it interacts with the trough currently off the northeast U.S. (cf. Fig. 2). The intensity forecast guidance is in generally good agreement that TD#4 will slowly and steadily intensify, reaching hurricane strength within 72-96 h.
|
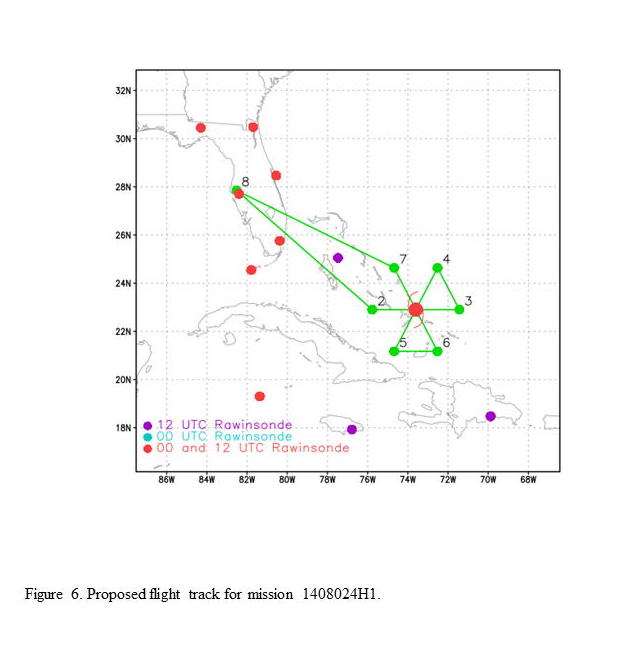
The plan calls for a butterfly TDR pattern, with an initial point on the west side (Fig. 6). The legs will be 120 nm in length. Drop sondes at the turn, mid, and center points. No AXBT’s will be deployed. The pattern will be flown at 10,000 ft.
Mission Summary :
| Take off | Landing
| MacDill AFB, FL
| 06:25 UTC
| MacDill AFB, FL
| 13:43 UTC
| | ||
 |
|
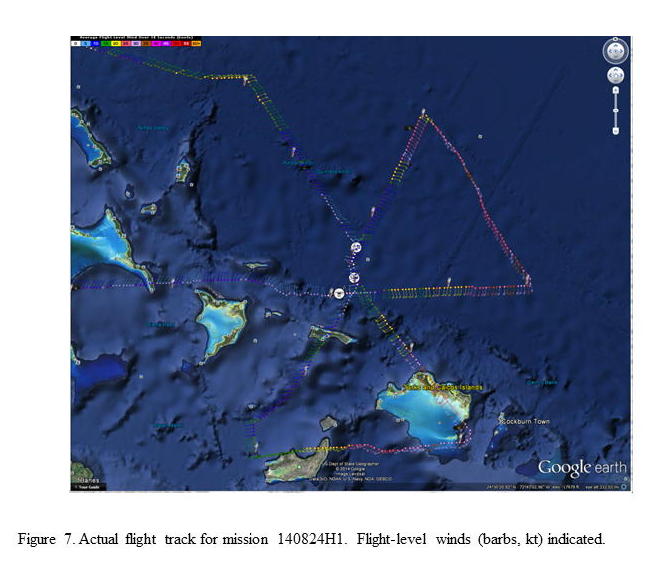
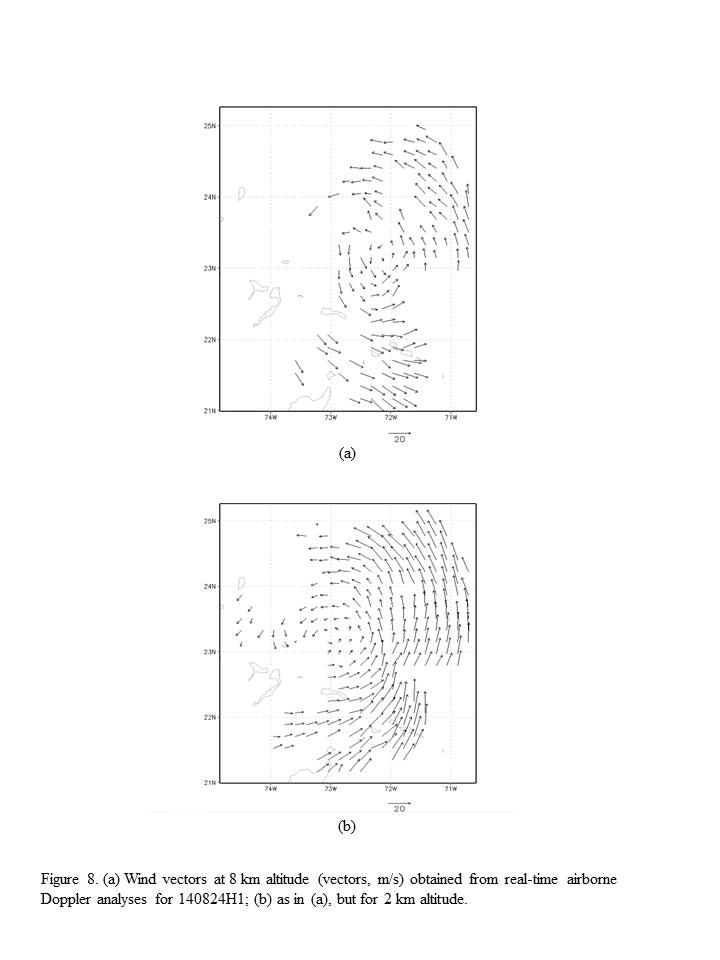
The actual flight track in shown in Fig. 7. Takeoff was at 0625 UTC from Tampa. The winds at flight level showed a broad circulation, with peak winds of ~40 kt on the east side of the storm about 150 km from the center. Real-time Doppler radar analyses (Fig. 8) showed that the circulation was displaced about 80-100 km between 2 and 8 km altitude. Precipitation was limited to nonexistent on the west side of the storm, but on the east side the precipitation began as primarily stratiform near the center before becoming deeper at larger distances from the center.
|
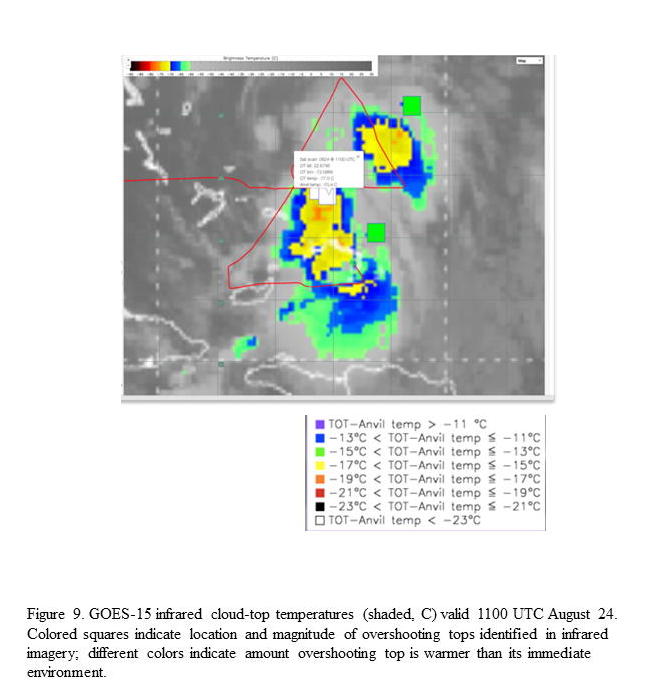
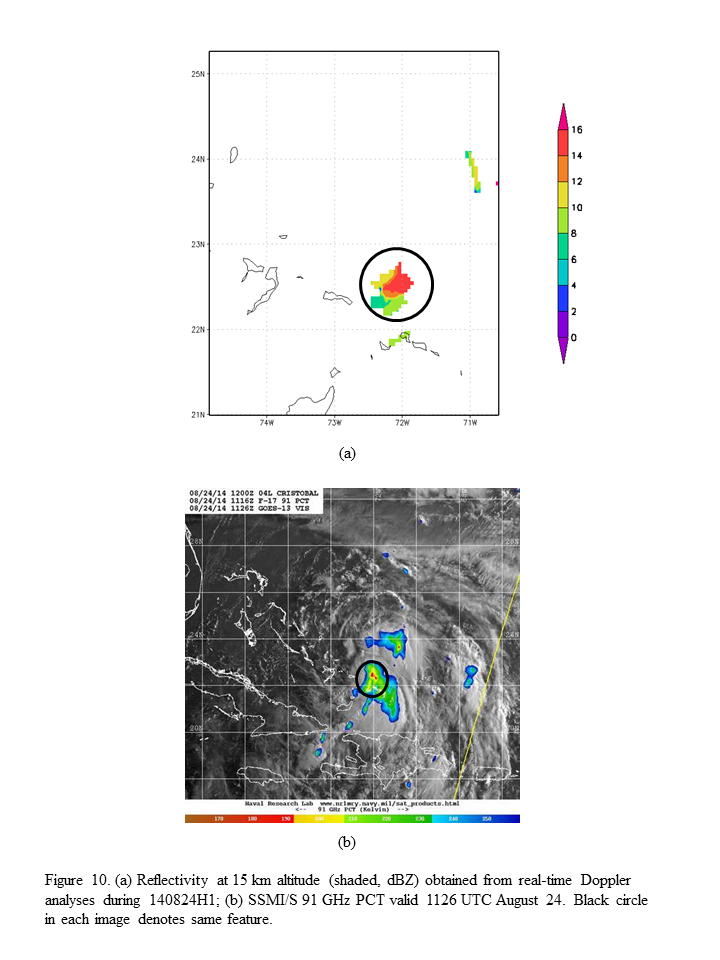
On the downwind leg on the east side the highest echo tops seen were ~14 km. Similar convective structures were seen on the south side of the storm, with overshooting tops as high as 50,000 ft evident on satellite imagery along the southeast leg (Fig. 9). These overshooting tops were also reflected in the radar reflectivity and microwave imagery (Fig. 10), which showed echoes above 16 dBZ at 15 km altitude and 91 GHz PCT < 190 K near the center on the southeast (i.e., downshear) side of the storm.
|
|
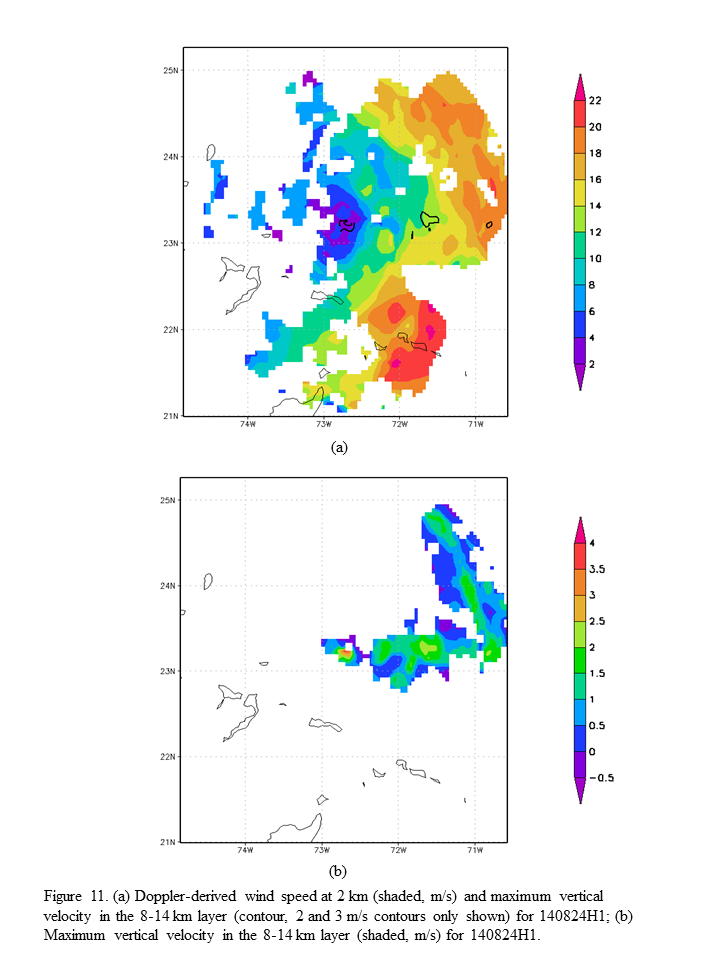
A comparison of the strongest upper-level (8-14 km) updrafts and wind speed at 2 km altitude (Fig. 11) shows that the strongest updrafts were located inside the broad circulation. The area of high echo tops on the southeast side of the storm (cf. Fig. 10) is reflected in a region of strong winds in Fig. 11, but there is no indication of strong updrafts here. However, this is because there is no vertical velocity data along the southeast leg. The storm slowly intensified during the mission; by the time of landing the system had been upgraded to Tropical Storm Cristobal.
The aircraft landed at Tampa at 1343 UTC.
Mission Evaluation:
A total of three radar analyses were created and transmitted in real time, as well as 15 dropsondes. There were problems with the AOC ground server, which prevented transmissions of radar analyses and dropsondes in real-time. A patch was ultimately implemented during the flight where an alternate server was used. After this patch it is believed that the radar data did reach EMC/NCO.
Problems:
The primary problem with this flight was the failure of the primary ground server at AOC. However, a temporary fix was implemented with a secondary server.
Rob Rogers
Sept. 4, 2014
Mission Data :