Mission Summary
20180709H2 Aircraft 42RF
Tropical Storm Chris (AL03)
Tail Doppler Radar
Aircraft Crew (42RF)
| Aircraft Commander | Scott Price
|
| Co-pilot | Pat Didier
|
| Co-pilot | Adam Abitol
|
| Flight Engineer | Ken Heystek
|
| Flight Engineer | Paul Darby
|
| Navigator | Pete Freeman
|
| Flight Director | Rich Henning
|
| System Engineer | Todd Richards
|
| Data Technician | Bobby Peek
|
| Dropsonde Operator | Terry Lynch
|
| Dropsonde Operator | Cameron
|
Scientific Crew (42RF)
| LPS | Gus Alaka | HRD
|
| Dropsonde | Hui Christopherson | HRD
|
| Radar | Frank Marks | HRD
|
| Observer | Tyler Young | HRD (Hollings)
|
| Observer | Jon Zawislak | HRD
|
Scientific Crew (Ground)
| Radar | Paul Reasor | HRD
|
Mission Plan :
NOAA 42 was tasked by the NOAA Environmental Modeling Center (EMC) for a Tail
Doppler Radar (TDR) mission scheduled for takeoff Monday, 1630 EDT (2030 UTC)
09 July 2018. The target of this mission was the assimilation of radar and
dropsonde data into the 00Z forecast cycle for the Hurricane Weather Research
and Forecasting (HWRF) Model.
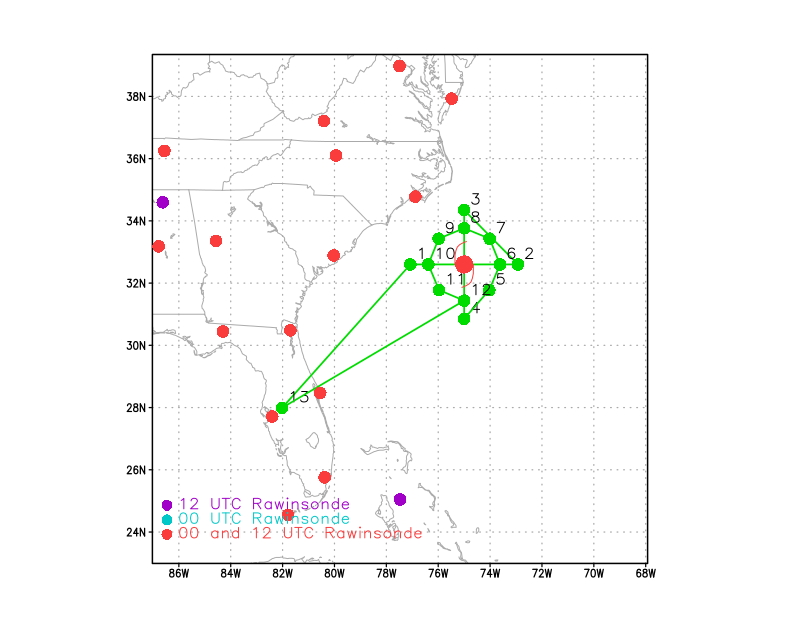
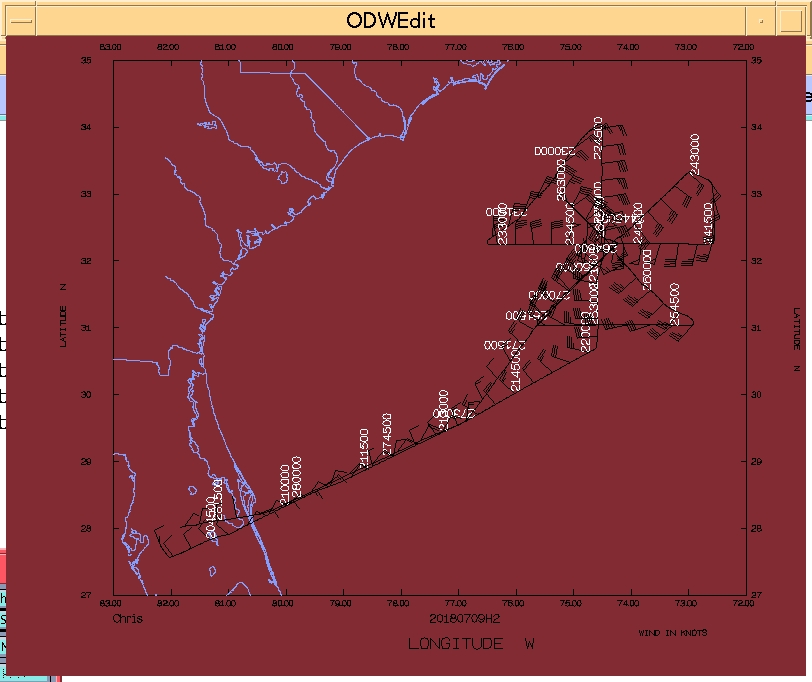
The original proposed flight track (Fig. 1, left) featured an initial position
(IP) 105 n mi to the west of the center. Initially, one Figure-4 pattern would
be flown with endpoint and center dropsondes. Next, starting south of the
center, the aircraft would begin counter-clockwise circumnavigation at a radius
of 90 n mi from the center, with dropsondes every 45-deg. Head back to Lakeland
upon completion of the circumnavigation.
Prior to takeoff, the proposed flight track was updated to provide better
coverage of Tropical Storm Chris (Fig. 1, right). This pattern featured
rotated Figure-4 patterns with legs of 90 n mi starting at the IP to the south
of Chris' center. The first two center passes would be flown at 8,000 ft radar
altitude. After reaching position 4, the plan was to climb to 10-15 kft, where
the aircraft could still safely operate below the melting level (~15 kft). Two
more Figure-4 patterns could be carried out, culminating at position 8. A total
of 20 dropsondes was proposed with (8) endpoint sondes, (8) midpoint sondes,
and (4) center sondes. If there was time to spare, consideration would be given
to a module (convective burst or SFMR circles). No AXBTs were planned for this
mission.
Figure 2. GOES-16 channel 13 brightness temperature at 0136-0506 UTC
10 July 2018.
|
The NHC advisory at 0000 UTC 10 July 2018 positioned Tropical Storm Chris at
32.3°N, 74.3°W with an estimated minimum central pressure 996 mb and
the max sustained winds 55 kt. The storm was nearly stationary.
Tropical Storm Chris continued a trend of increased organization, albeit at a
slower rate than anticipated by NHC forecasts. The satellite presentation
showed improved banding features, especially to the south of the center. Cold
cloud tops wrapped 50-75% of the way around the obvious low-level center.
However, dry air on the northern side of the circulation had prevented deep
convection in that sector for the several hours leading up to the mission
(Fig. 2). Further, the satellite appearance resembled an eye, despite the fact
that Chris had maximum sustained wind speeds of only 55 kt.
An earlier Air Force reconnaissance plane reported flight-level winds of 71kt
in the southwestern quadrant. NHC's initial intensity was set at 55 kt when the
mission commenced. Chris was forecast to move little in the following 24 hours,
remaining near or over the Gulf Stream. However, a nearby buoy measurement had
suggested cold water upwelling near the center. Within a day of this mission,
Chris was expected to begin moving slowly to the northeast, with acceleration
into the midlatitude westerly flow ahead of a mid-level trough. Although NHC
previously forecast Chris to attain hurricane status while stationary, it was
uncertain if Chris would intensify during this mission. Chris remained in very
weak currents between two mid-level highs and a mid- to upper-level trough to
its northeast.
The NHC 0300 UTC 10 July 2018 forecast advisory is provided below:
INIT    10/0300Z    32.3N    74.3W    60 KT    70 MPH
12H     10/1200Z    32.6N    73.9W    60 KT    70 MPH
24H     11/0000Z    33.5N    72.7W    70 KT    80 MPH
36H     11/1200Z    35.1N    70.4W    80 KT    90 MPH
48H     12/0000Z    37.7N    66.6W    80 KT    90 MPH
72H     13/0000Z    44.0N    59.0W    60 KT    70 MPH...POST-TROP/EXTRATROP
96H     14/0000Z    49.0N    47.0W    45 KT    50 MPH...POST-TROP/EXTRATROP
120H    15/0000Z    52.0N    31.0W    35 KT    40 MPH...POST-TROP/EXTRATROP
TDR MISSION PLAN: Chris
Prepared by the Hurricane Research Division
July 07, 2018
Aircraft: N42RF
Proposed takeoff: 09/2030Z
|
DROP LOCATION TABLE
|
| #
| LAT
| LON
| RAD/AZM
| Time
|
|
| deg min
| deg min
| n mi/deg
| hr:min
| | 1S | 32 36 | 77 04 | 105/270 | 1:11
| | 2S | 32 36 | 72 56 | 105/090 | 2:06
| | 3S | 34 21 | 75 00 | 105/000 | 2:45
| | 4S | 30 51 | 75 00 | 105/180 | 3:40
| | 5S | 31 47 | 74 02 | 70/135 | 3:56
| | 6S | 32 36 | 73 37 | 70/090 | 4:08
| | 7S | 33 26 | 74 01 | 70/045 | 4:20
| | 8S | 33 46 | 75 00 | 70/000 | 4:32
| | 9S | 33 26 | 75 59 | 70/315 | 4:43
| | 10S | 32 36 | 76 23 | 70/270 | 4:55
| | 11S | 31 47 | 75 58 | 70/225 | 5:07
| | 12S | 31 26 | 75 00 | 70/180 | 5:18
| |
Mission Summary :
| Take off
| Landing
| Linder-Lakeland Airport, FL
| 20:25 UTC
| Linder-Lakeland Airport, FL
| 04:29 UTC
| | Penetrations
| 5
| | Expendables
| 21 Dropsondes (20 EMC + 1 NHC)
| |
Mission Summary:
Departure from Lakeland was smooth at 2025 UTC, with a ~90 minute ferry to the
initial position. The actual flight track, including flight level winds and 21
dropsonde locations, included five center penetrations and provided maximal
coverage of the storm, especially in the southern and western quadrants (Figs.
3-4).
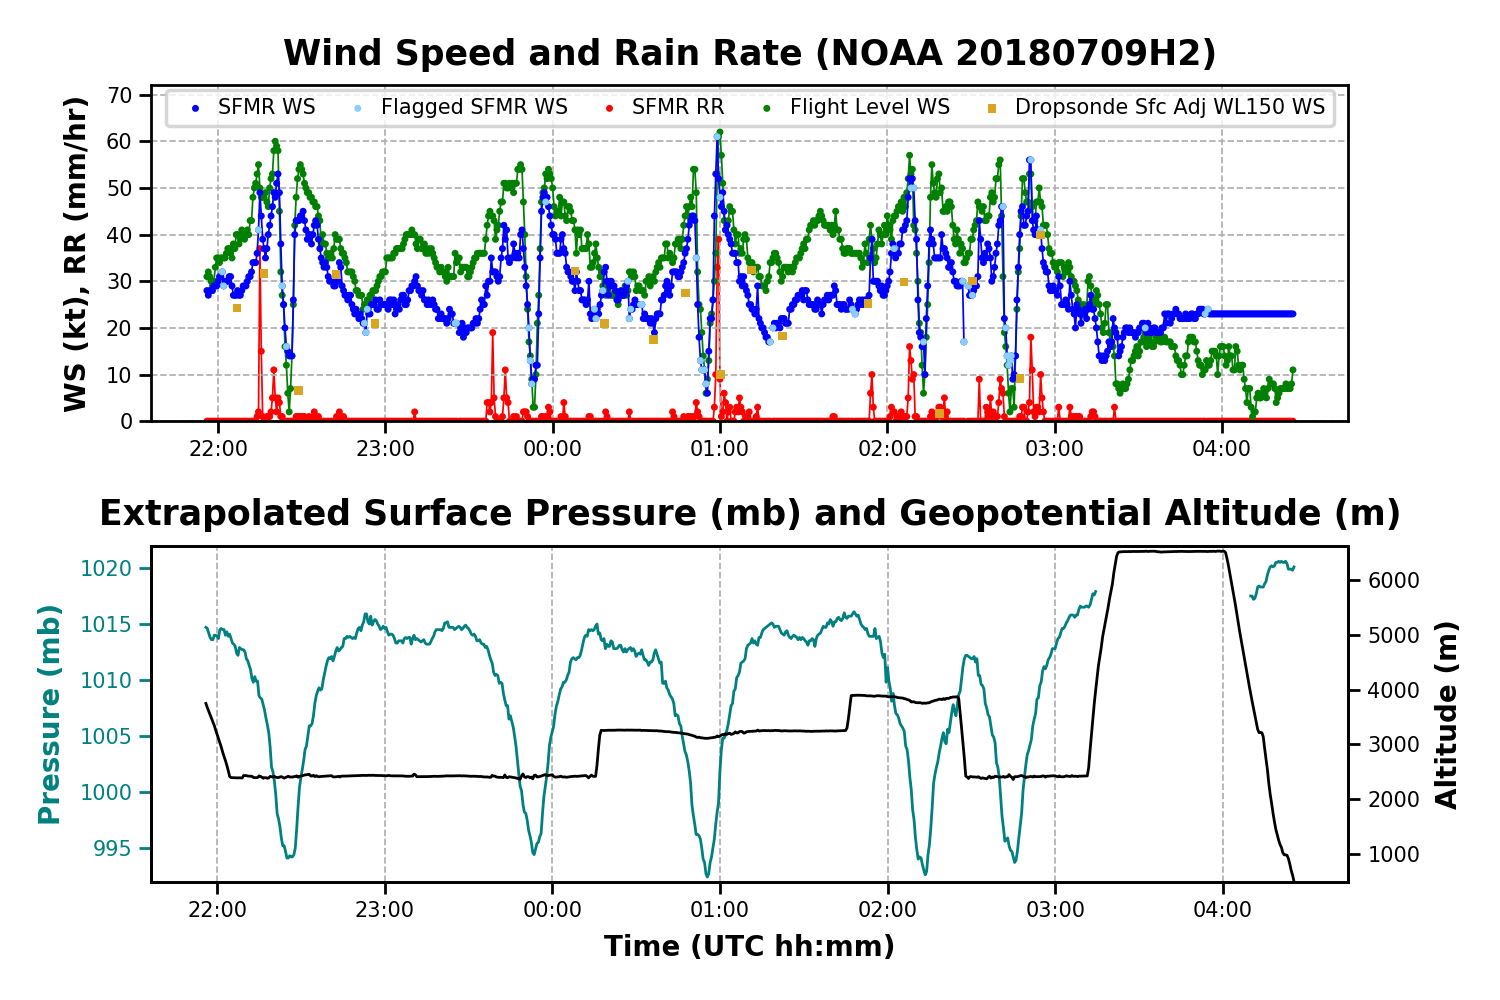
When we arrived at the IP, the strongest convection was located in the southern
semicircle of the storm. Overall, Chris exhibited banding near the center in
the southern and western quadrants. The newly functional Multi-mode Radar (MMR)
picked up one of these rainbands in the southern quadrant of the storm (Fig. 5)
. The SFMR read 49 kt and cloud top echos were observed near 15 kft for this
particular rainband. The center was still mostly devoid of convection, leading
to a straightforward fix. A center dropsonde reported a central pressure near
994 mb, perhaps a signal of intensification, and the peak wind speed for this
first center pass was ~53 kt, reported by SFMR on the southern side of the
circulation. As we emerged to the north of the center, spiraling rainbands in
the western semicircle of the storm were observed on MMR. The outbound leg was
adjusted from 90 n mi to 105 n mi fly outside of the outermost of these bands.
Accordingly, the inbound leg from 3-Center was extended to 105 n mi as well.
We were able to fly downwind just outside of this outermost rainband, with good
TDR coverage on the port side of the aircraft (Figs. 6-7). It was reported that
the WSRA was not functional on the flight center pass. However, the issue was
fixed by the time we reached position 3, and the instrument ultimately worked
for the remainder of the mission. On the inbound leg, TDR velocities were
"folding" at 35 m/s (the Nyquist frequency for the system), indicative of
hurricane force winds near and just below flight level. However, SFMR was not
reporting winds above 50-55 kt at the surface.
After a second center pass, we climbed to 10 kft near position 4 (see Fig. 3).
We were informed that we would not immediately ascend higher than 10 kft to
assess the graupel situation, especially in the southwest quadrant, where we
were headed after the third center pass. The northeast quadrant was mostly
rainband-free, with isolated supercells representing the remnants of rainbands
that failed to rotate from the southern semicircle. During the third pass, we
observed the organization of what appeared to be a southern eyewall on MMR,
with TDR echo tops to 16 kft and SFMR readings of 60 kt (Figs. 5-7). The
eyewall itself was not terribly wide, and we encountered only a few minutes of
moderate turbulence. This eyewall development was corroborated by infrared
satellite imagery, with very cold cloud tops in the southern semicircle of the
storm in association with the intense banding and developing eyewall (see Fig.
2).
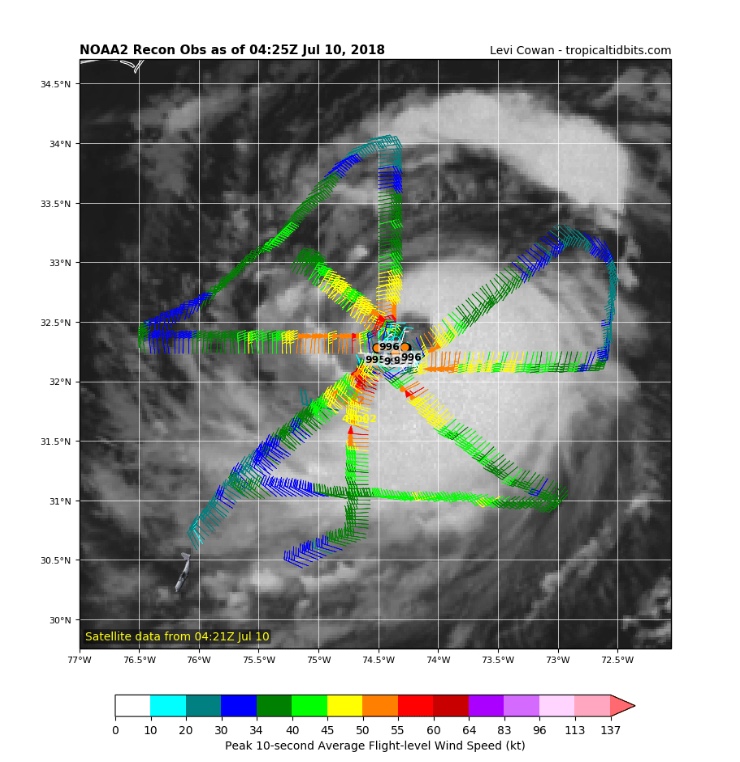
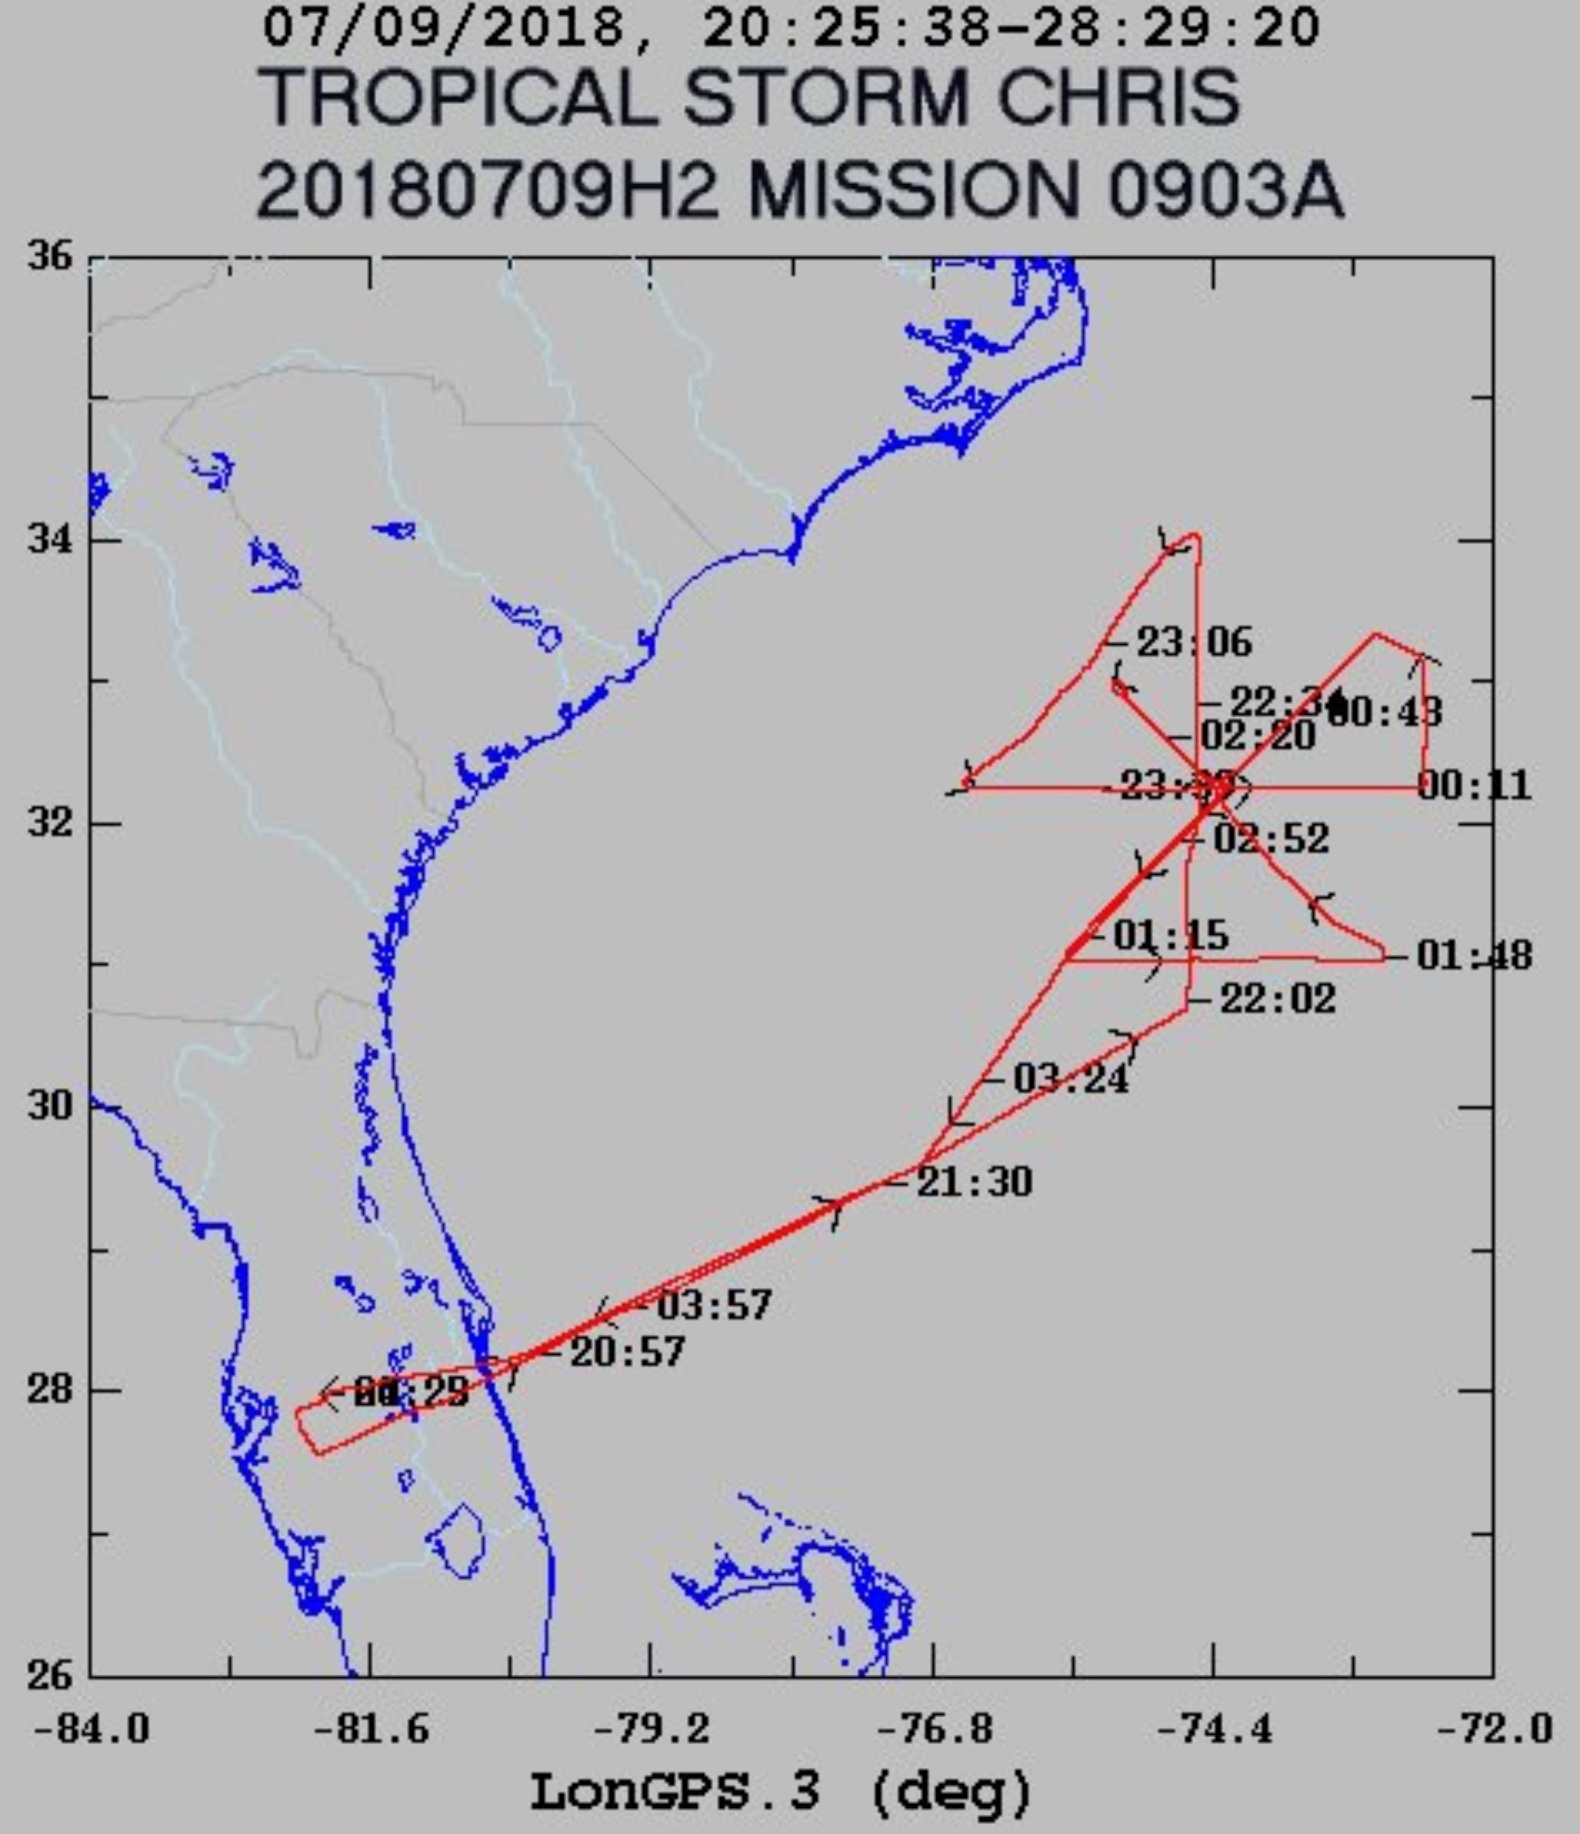
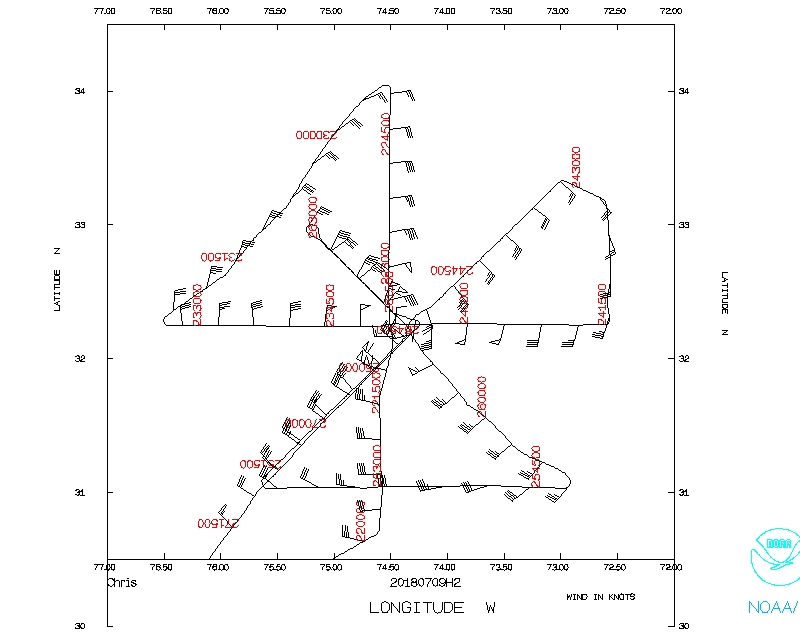
Figure 3.Actual flight track, flight-level winds (barbs), and
flight-level wind speeds (shaded, kt) for mission
20180709H2 (courtesy of
www.tropicaltidbits.com). Approximate minimum sea-level pressure (mb) is
printed near the storm center and a concurrent infrared satellite image
is underlaid.
|
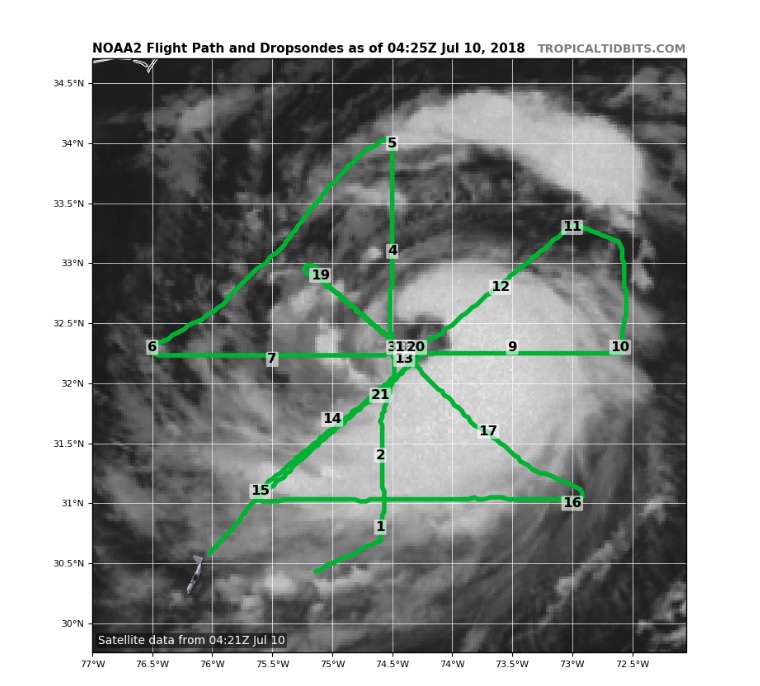
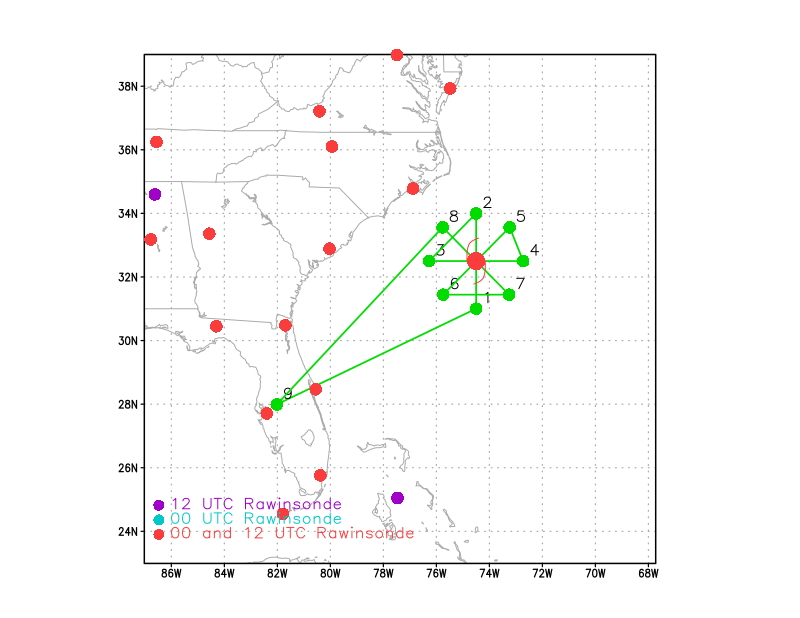
Figure 4.Actual flight track (green line), and 21 dropsonde locations for mission 20180709H2 (courtesy of www.tropicaltidbits.com). A concurrent infrared satellite image is underlaid.
|
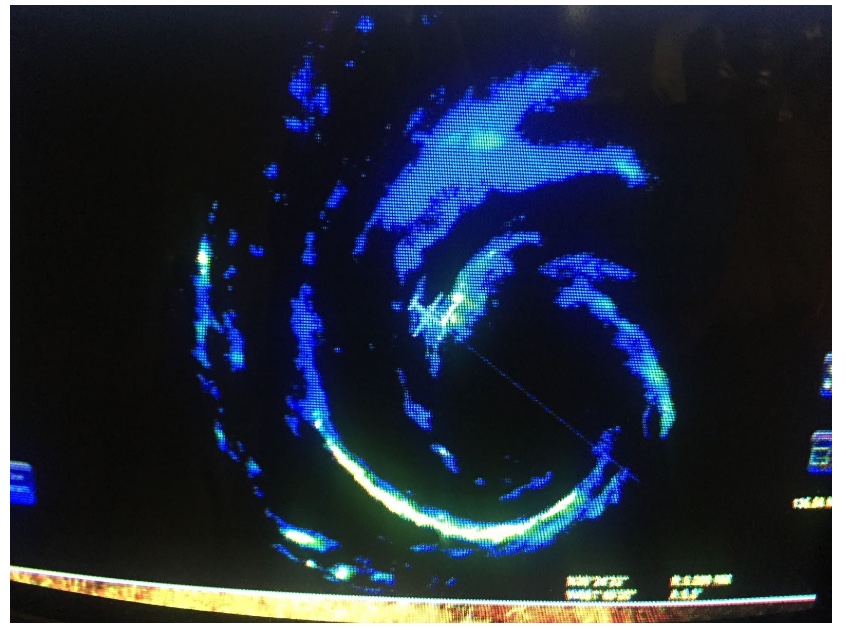
Figure 5.Image of reflectivity data reported by the new Multi-Mode Radar (MMR) onboard the NOAA P-3. Image courtesy of Frank Marks.
|
After the third center pass, we were informed that the graupel situation was
mild and we ascended to 12 kft between positions 6 and 7. In addition, NHC
requested a flight track adjustment to target maximum winds in the southwestern
quadrant of the storm. Accordingly, we truncated the Center-8 leg after the
fourth center pass to 50 n mi, retraced our track back to the center, then
tracked outbound toward the southwest. In Fig. 5, the aircraft was about to
make its fifth and final center penetration. During the subsequent final
outbound leg, a dropsonde was released near the innermost intensifying rainband
in an attempt to confirm the ~60 kt SFMR readings observed in the previous pass
through that region. Although winds were >60 kt above 1000 ft, the dropsonde
reported winds of only ~50 kt at the surface. In addition, the minimum central
pressure had remained constant near 994 mb. Although Chris was not upgraded to
a hurricane during our mission, the tropical storm was clearly becoming better
organized even if that wasn't yet reflected in wind speed measurements. Banding
on the southeastern side of the storm can clearly be observed in TDR data
(Figs. 6-8).
The strongest winds at 0.5 km were in the southern semicircle, with a large
expanse >50 kt (Fig. 6, left). Near flight level, the strongest winds were
actual located to the west of the center in association with the development of
banding in that region (Fig. 6, right). In addition, the vortex tilt had
reduced significantly, with the 2- and 7-km centers only differing in position
by < 5 n mi (Fig. 7, right). Given this representation, it was still expected
that Chris would intensify to hurricane status within 24 h of this mission.
This mission captured a tropical storm that was slowly becoming better
organized despite conducive environmental conditions.
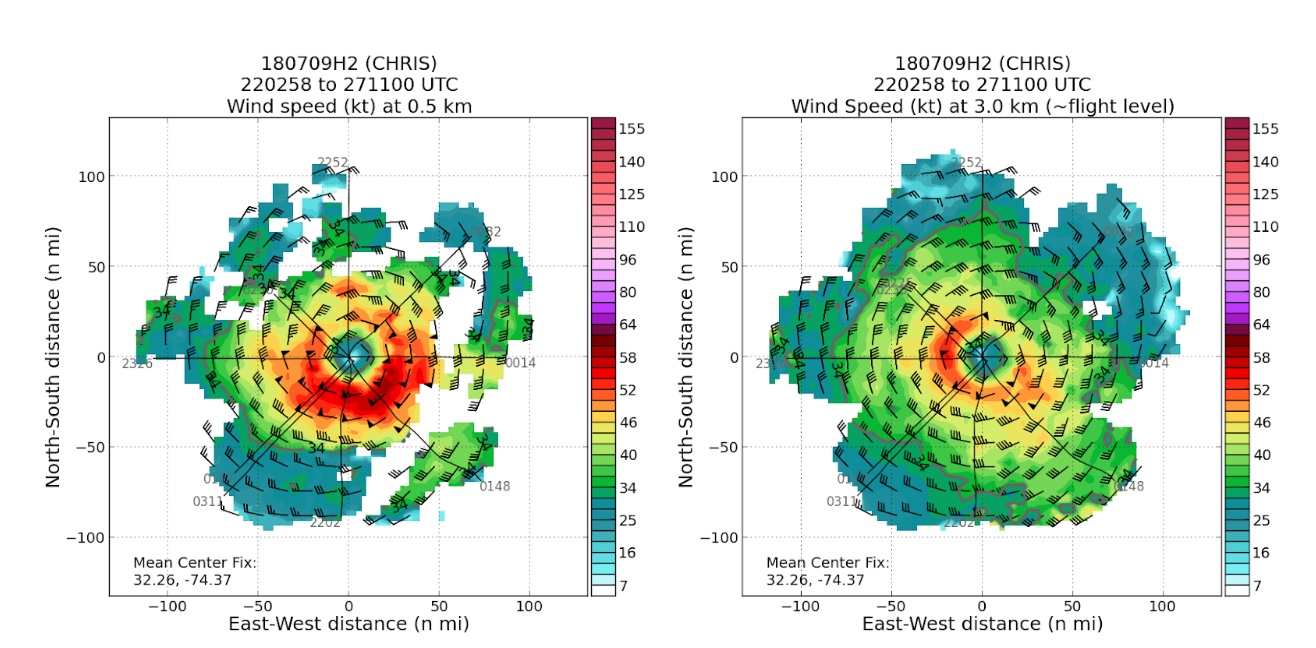
Figure 6.Wind speed (kt; barbs and shading) at 0.5 km (left panel) and 3.0 km (right panel). The flight track is shown by a black line.
|
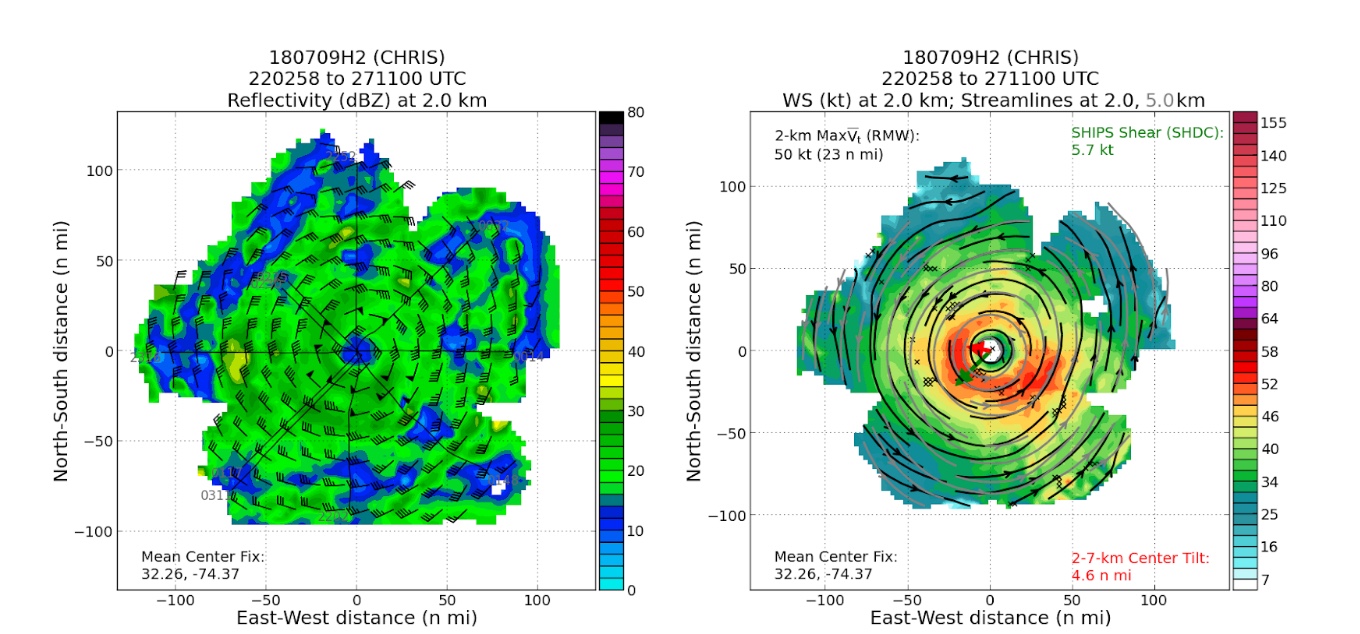
Figure 7.Reflectivity at 2 km (left panel) and wind speed at 2 km, wind streamlines at 2 km/5 km (right panel). The SHIPS deep-layer vertical wind shear is shown by a green arrow. The 2-7-km vortex tilt is shown by a red arrow. The flight track is shown by a black line.
|
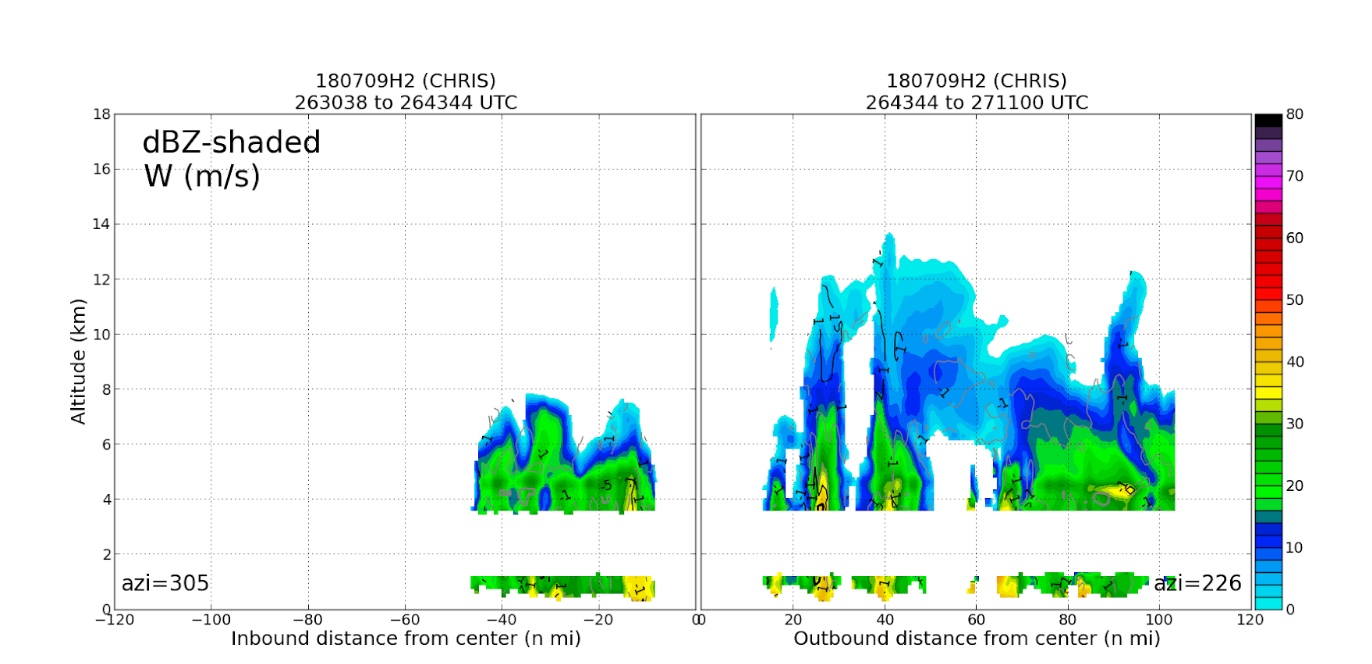
Figure 8.Reflectivity cross-sections from the final inbound (left panel) and outbound (right panel) legs.
|
Problems :
Mission Evaluation/Problems:
At approximately 0430 UTC 09 July 2018, HRD scientists deployed on an
EMC-tasked mission (20180709H2) into Tropical Storm Chris to obtain data for
the initialization of the HWRF Model. The mission was a success, with five
center penetrations, 21 dropsondes, and excellent TDR coverage throughout. In
addition, this was the first flight for which the MMR was usefully operational.
AOC crew were extremely supportive and helped us sort through many issues
related to the dropsonde software (ASPEN) and the visualization of the MMR
data. Our situational awareness was good, with adjustments to two legs (one
outbound, one inbound) from 90 n mi to 105 n mi. Further, the aircraft began
at a radar altitude of 8 kft, but successfully ascended to 10 fkt and, later,
12 kft at the discretion of HRD and AOC crew. The 3rd center pass was at an
altitude of 10 kft and the 4th center pass was at 12 kft. This additional
altitude may prove useful in diagnosing a deeper profile of the atmosphere
during this critical intensification stage for Tropical Storm Chris. Toward
the end of the mission, NHC requested a deviation to the flight track that
would allow us to re-sample the southwest quadrant of Chris, where SFMR had
reported winds >60 kt. This deviation resulted in a 5th center pass and a
failure to replicate the 60 kt SFMR reading from an earlier leg.
Soon after the mission began, HRD scientists were notified about a problem
reading dropsonde data into HWRF. We conducted a real-time test on WMO messages
created from the dropsonde data; a semicolon was added to the end of WMO
messages from (5) endpoint dropsondes. Ultimately, the test proved useful
because we confirmed that the additional semicolon was necessary to properly
assimilate these data into HWRF. Also, we discovered that radar processing
parameters in the plane were not set correctly. Paul Reasor (ground-based)
assisted the radar scientist to reset the parameters. The radar scientist had
to continuously monitor the TDR transmission software. This software
intermittently failed and needed to be restarted to continue data transmission
to the ground. The WSRA was non-functional for the first center pass. However,
the problem was quickly identified and fixed, leading to the successful
operation of the WSRA for the remainder of the mission.
Overall, we observed an intensifying tropical storm that increased its
organization throughout the mission. This mission highlighted the key
collaboration between HRD scientists (onboard and ground-based) and AOC crew to
collect impressive data in what amounted to a "shake-down" mission. The
success of this mission bodes well for future missions and the situational
awareness practiced here will be useful to efficiently adapt future flight
plans.
Ghassan Alaka
(Ghassan.Alaka@noaa.gov)
18 July 2018
Mission Data :
LPS log (Alaka) |
LPS log (Marks) |
Radar log |
Drop log
Flight Director's log |
Flight Director's manifest
serial data |
NetCDF data |
1 second data
Page last updated Aug. 15, 2018
Return to Mission page.