Mission Summary
Tropical Storm Chantal
20010820H Aircraft: N42RF
Version with illustrations
|
Scientific Crew
|
| Lead Project Scientist | Mike Black
|
| Radar Scientist | John Gamache
|
| Workstation Scientist | Peter Dodge
|
| Dropsonde Scientist | Gary Barnes (U Hawaii)
|
| AXBT Scientist | Frank Marks
|
| CCN Counter | Jim Hudson (DRI)
|
| SFMR Scientist | Tony Castells (UMASS)
|
|
Aircraft Crew
|
| Pilots
| CAPT Brian Taggert
LT Randall TeBeest
|
| Flight Engineer | Greg Bast
|
| Navigator | LT Carl Newman
|
| Flight Director | Tom Shepherd
|
| Engineers
| Sean McMillan
Jorge Delgado
Jim Barr
|
Mission Brief:
Tropical Storm Chantal was forecast to make landfall near the
Belize-Mexico border on the Yucatan Peninsula in the late hours
of August 20. The intensity was not forecast to change much from
a 55-60 kt T.S. before making landfall. Visible and infrared
(Fig. 1) satellite imagery showed an exposed low-level center
with vigorous convection displaced on the east and north
portions of the storm. HRD and NASA planned a quantitative
precipitation experiment (QPE) with NOAA's N42RF and NASA's DC-8
and ER2 aircraft. The aircraft would fly coordinated legs in an
asymmetric figure-4 pattern (Fig. 2)
to sample the vortex and
high precipitation regions. The leg lengths of the NOAA WP-3D
would be shorter (max. 100 nmi) than those of the DC-8 and ER-2
(max. 165 nmi) to account for the differences in ground speed.
The tail radar on the WP-3D would be operated in the FAST mode,
except on the SW to NE and E to W passes, where continuous mode
would be employed to collect vertical incidence Doppler data.
The WP3D would deploy up to 18 AXBTs and 24 GPS dropsondes in
the storm enviromnent, primarily in the inner core.
Sometime during the execution of the figure-4, a rainband
would be identified by HRD scientists with the LF radar on the
WP-3D that would be studied by both the NOAA and NASA aircraft
after completion of the survey pattern. Information on the
location and orientation of the rainband would be conveyed from
the WP-3D crew to the crew on the DC-8 and ER2 for coordination.
The WP-3D planned on flying a series of box patterns around
convectively-active portions of the band while the DC-8 and ER2
would fly across the band. N42RF would take off at 1630 UTC from
MacDill AFB and the NASA aircraft at 1700 UTC from Jacksonville
to rendezvous at the initial point north of Chantal's center.
Mission Synopsis:
 N42RF departed MacDill AFB at 1722 UTC, almost an hour later
than planned due to a takeoff delay of the NASA aircraft. The
aircrew of N42RF tried to contact the NASA aircraft on the ferry
down to Chantal but were unable to communicate with them until
nearing the IP. Once we realized that the NASA planes were about
a half hour behind N42RF, it was decided to fly closer to the
center of Chantal to get a better look on the LF radar
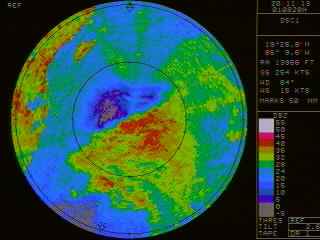
(Fig. 3). The radar showed an asymmetric
precipitation pattern with all of the convection on the north
and east sides of the storm. The coastlines of Cozumel, the
Yucatan Peninsula, and Belize are also evident in
Fig. 3. A well-defined radar center was not
obvious on the radar screen. The WP-3D turned back to the north
to arrive at our IP and coordinate with the NASA aircraft. The
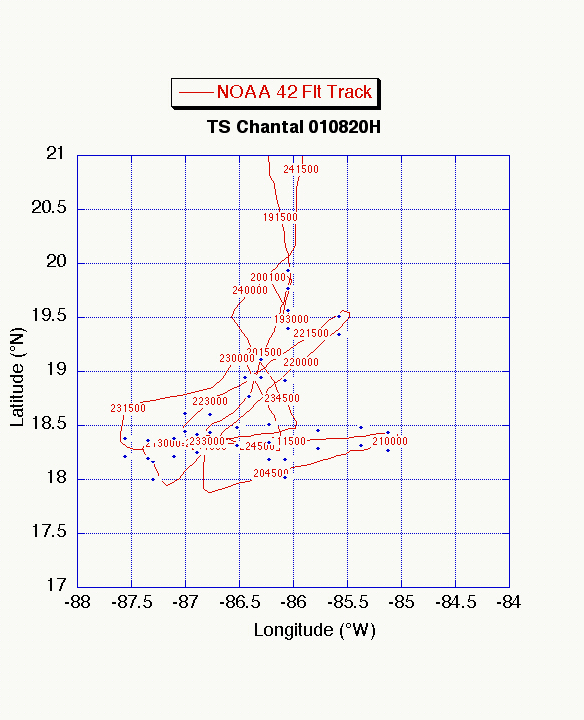
actual flight of N42RF is in Figure 4.
N42RF departed MacDill AFB at 1722 UTC, almost an hour later
than planned due to a takeoff delay of the NASA aircraft. The
aircrew of N42RF tried to contact the NASA aircraft on the ferry
down to Chantal but were unable to communicate with them until
nearing the IP. Once we realized that the NASA planes were about
a half hour behind N42RF, it was decided to fly closer to the
center of Chantal to get a better look on the LF radar
(Fig. 3). The radar showed an asymmetric
precipitation pattern with all of the convection on the north
and east sides of the storm. The coastlines of Cozumel, the
Yucatan Peninsula, and Belize are also evident in
Fig. 3. A well-defined radar center was not
obvious on the radar screen. The WP-3D turned back to the north
to arrive at our IP and coordinate with the NASA aircraft. The
actual flight of N42RF is in Figure 4.
 The storm was somewhat further west than anticipated, so we
adjusted our north-to-south pass through Chantal to end up about
50 miles south of the center. N42RF fixed the center of Chantal
at about 18.4° N, 86.8° W. We dropped 4 GPS sondes along
with AXBTs on the north side of the storm (Table 1
). N42RF tracked NE, dropping a sonde and AXBT at the midpoint
of the downwind leg, We arrived at a point 100 nmi east of the
center, releasing a sonde and AXBT before heading inbound at 2100
UTC. During this pass, the WP-3D encountered a series of convective
rainbands and adjacent stratiform precipitation regions.
The storm was somewhat further west than anticipated, so we
adjusted our north-to-south pass through Chantal to end up about
50 miles south of the center. N42RF fixed the center of Chantal
at about 18.4° N, 86.8° W. We dropped 4 GPS sondes along
with AXBTs on the north side of the storm (Table 1
). N42RF tracked NE, dropping a sonde and AXBT at the midpoint
of the downwind leg, We arrived at a point 100 nmi east of the
center, releasing a sonde and AXBT before heading inbound at 2100
UTC. During this pass, the WP-3D encountered a series of convective
rainbands and adjacent stratiform precipitation regions.
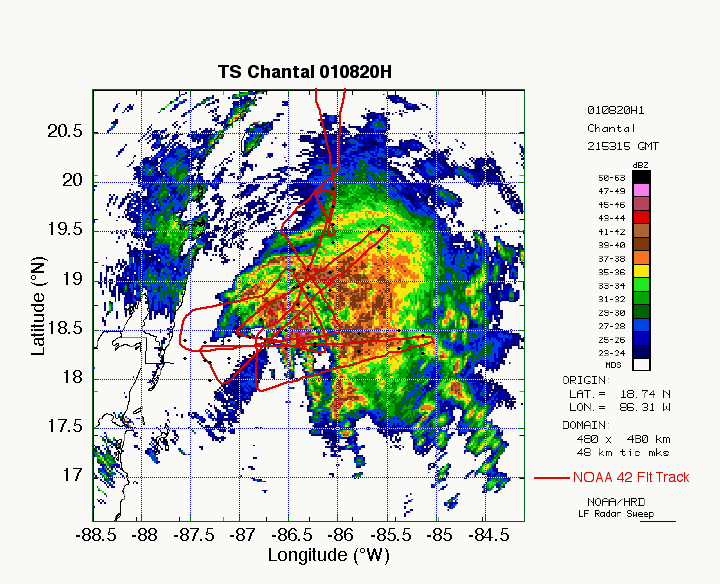
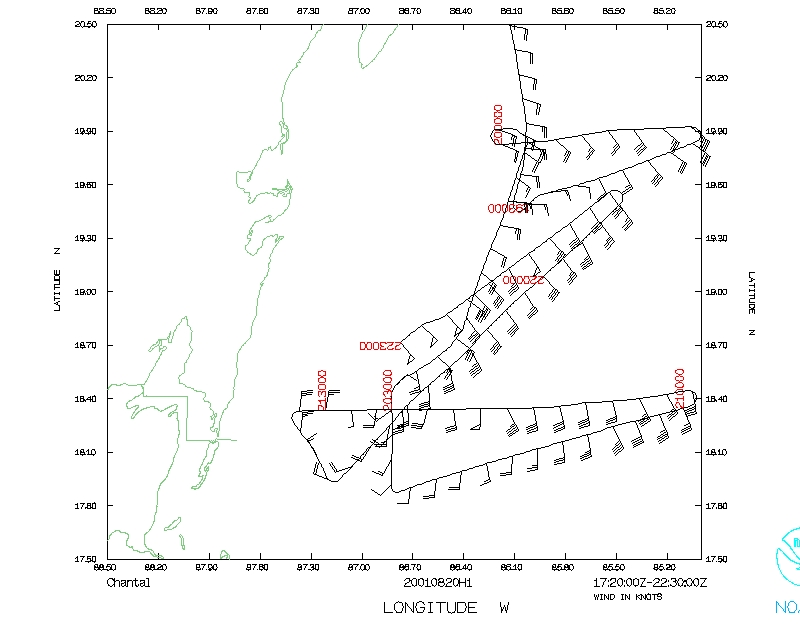
An overall view of the precipitation pattern of Chantal, along
with N42RF's track, sonde, and AXBT locations is in
Figure 5. A dropsonde was released just south
of the center of Chantal at 3126 UTC with a location of
18.1° N, 87.2° W. The leg lengths on the west and
southwest sides of Chantal were truncated to maintain
coordination with the NASA aircraft. N42RF then made
a SW to NE pass through the storm ending up at a point 100 mni
NE of Chantal at 2210 UTC. GPS sondes and AXBTs were dropped at
the midpoints and end of the legs. Plots from the dropsondes at
700, 850, Surface, and layer-mean (700-SFC) are shown in Figures
7-10. The sondes highlighted by boxes in Fig. 10 are 4
representative observations, depicted in the Skew-T plots in
Figures 13-16.
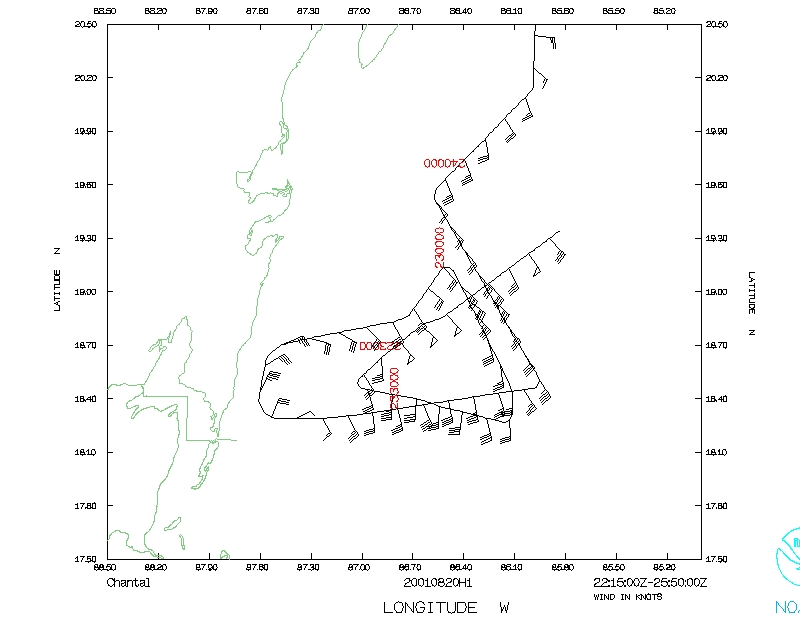
The NOAA WP-3D aircraft was then finished with the survey
portion of the flight and we found out that the NASA DC-8
aircraft was having instrumentation problems associated with
severe icing and would probably have to return to base. The
WP-3D crew decided to continue on and fly an abbreviated box
pattern around a convective rainband about 60 mni east of
Chantal's
center (Fig. 17). The tail radar collected Doppler wind and
reflectivity data as we passed close to the band. A particularly
intense cell, embedded in strong shear is evident in Fig. 18. At
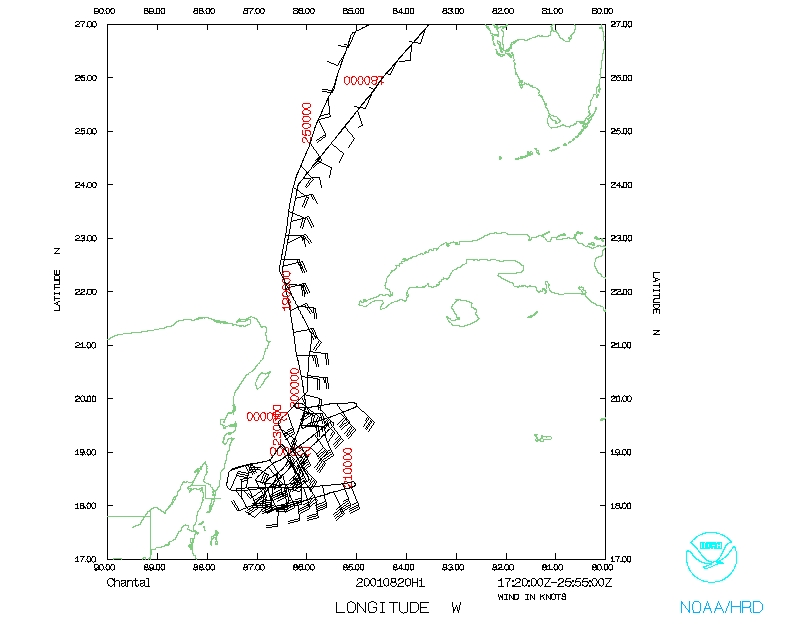
2350 UTC, N42RF headed back to MacDill after tracking NW along
the inner portion of the rainband. The remaining 8 AXBTs loaded
into the tubes on the belly of the WP-3D were deployed in the
eastem Gulf of Mexico during 0051 and 0123 UTC at evenly-spaced
locations between 24° and 26.7° N, 84° and 85° W.
N42RF landed at 0056 UTC, having completed an 8.5-hour mission.
Overall this was a successful mission, both from a scientific
viewpoint and for testing the instrumentation and coordination
with NASA. Valuable flight-level, radar reflectivity, Doppler
velocity, GPS sonde, and AXBT data were collected in a sheared,
asymmetric tropical storm that had large areas of deep
convection (Fig. 20). A total of 21 GPS dropsondes and 18 AXBTs
were releases in the inner core and nearby enviromnent of
Chantal. Data collected from the aircraft were uses in the HRD
real-time wind analyses (Fig. 19) and by the NHC forecaster on
duty.
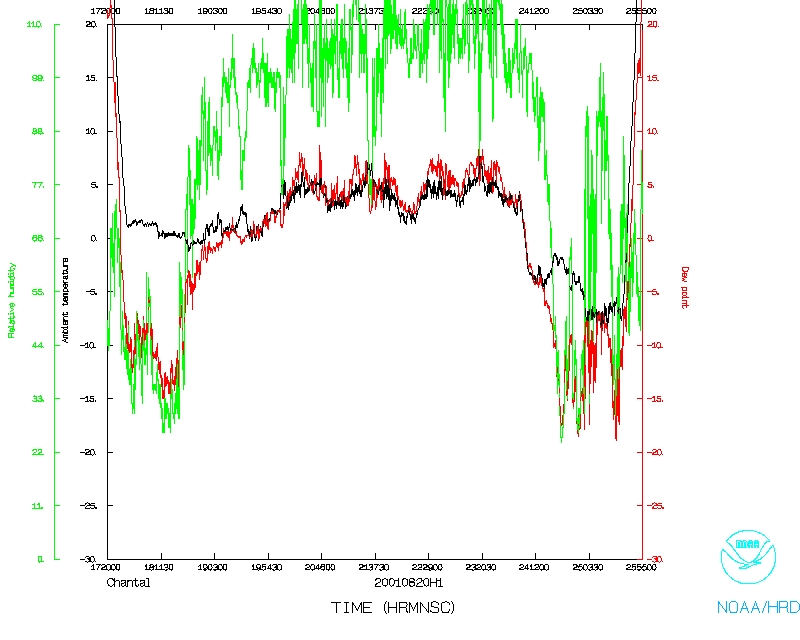
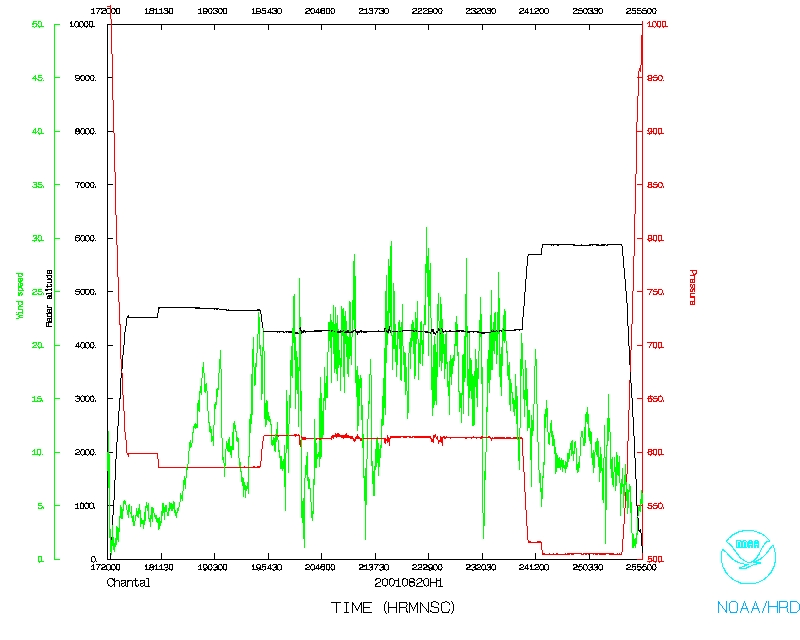
One minute flight data
Problems :
Although this mission was designed to collect data for a
quantitative precipitation study, the SFMR and cloud physics
systems were not operating. The reflectivity data seemed about 8
dBZ too high while the tail reflectivity data appeared about the
same amount too low. Hopefully, these can be corrected in
post-flight calibrations. One GPS sonde had a launch failure and
another contained no wind data. Otherwise, the GPS sondes worked
extremely well, including the fix by AOC to the temperature and
humidity sensor arms; there were no failures of these sensors.
The AXBTS all recorded data, with only a few that contained
questionable data. The NOAA and NASA aircraft had communication
problems that hindered the effectiveness of the coordination.
These problems will, hopefully, be resolved before the next
flight with the NOAA and NASA aircraft.
Mike Black
9/4/01
Mission Data:
1 second data
TS Chantal
20 Aug 2001 N42RF
Table 1
GPS-sondes
|
| Number
| Sonde-ID
| Time
(UTC)
| Lat
(deg)
| Lon
(deg)
| WL150
| DLM
wind
| MBL
wind
| Comments
|
|
1 | 003115095 | 1938 | 19.71 | 85.51 | 10039 | 11538 | 09542 | RAINBAND
|
|
2 | 003475034 | 2005 | 19.82 | 86.09 | 10035 | 11539 | 09535 | SST 29.0°
|
|
3 | 003475031 | 2020 | 18.85 | 86.48 | 08045 | 10050 | 07547 | LSTWND 0 11
SST 29.4°
|
|
4 | 003248007 | 2027 | 18.50 | 86.82 | 07552 | 11522 | 08062
|
|
5 | 003475026 | 2047 | 18.16 | 86.03 | 13545 | 14546 | 13546
|
|
6 | 003475088 | 2100 | 18.37 | 85.02 | -99 | -99 | -99 | No winds
not transmitted
|
|
7 | 003475048 | 2106 | 18.43 | 85.45 | 08034 | 12535 | 08036
|
|
8 | 003515122 | 2111 | 18.41 | 85.84 | 10541 | 13042 | 10543 | SST 29.8°
RAINBAND
|
|
9 | 003475089 | 2136 | 18.07 | 87.26 | 09510 | 25001 | 10508 | LSTWIND 032
SST 29.9°
EYE
|
|
10 | 003475097 | 2158 | 19.03 | 86.10 | 11543 | -99 | -99 | LSTWND 470
|
|
11 | 003475038 | 2207 | 19.49 | 85.57 | 08032 | 11034 | 08036
|
|
12 | 003115089 | 2234 | 18.53 | 87.07 | 09553 | 11543 | 09557 | LSTWIND 012
|
|
13 | 003115094 | 2247 | 18.30 | 86.22 | 08542 | 12537 | 08545
|
|
14 | 011245417 | 2258 | 19.11 | 86.52 | 07544 | 10545 | 08046
|
|
15 | 003515086 | 2320 | 18.30 | 87.49 | 09018 | 11517 | 09517
|
|
16 | 003515073 | 2323 | 18.33 | 87.31 | 12032 | 13534 | 12034
|
|
17 | 003475036 | 2326 | 18.36 | 87.10 | 12043 | 13043 | 11045
|
|
18 | 003248008 | 2329 | 18.39 | 86.88 | 09057 | 11550 | 09062
|
|
19 | 003475039 | 2334 | 18.43 | 86.51 | 08551 | 11546 | 09053 | LSTWIND 013
|
|
20 | 003475033 | 2338 | 18.48 | 86.19 | 08543 | 11542 | 09044
|
|
21 | 003825281 | 2349 | 19.10 | 86.37 | 08043 | 10543 | 08043
|
Last two GPS-sondes were not transmitted.