Mission Summary
20090820N1 Aircraft 49RF
TDR/RI/SALEX Mission about Hurricane Bill 2009
Aircraft Crew (49RF)
| Aircraft Commander | Will Odell |
| Co-pilot | Greg Glover |
| Flight Director | Jackie Almieda |
| Flight Director | Nancy Ash |
| Electronics Technician | Mark Rogers |
| AVAPS Operator | Steven Paul |
| AVAPS Operator | Dale Carpenter |
Scientific Crew (49RF)
| Dropsonde Scientist | Jason Dunion |
Mission Plan :
NOAA 49RF will fly a combination TDR mission, Rapid Intensity (RI) Experiment
and Saharan Air Layer Experiment (SALEX) around Hurricane Bill. The G-IV will
leave Barbados at 0749 UTC and will recover back at Barbados at 1407 UTC. The
flight track will take the G-IV on a counterclockwise circumnavigation of the
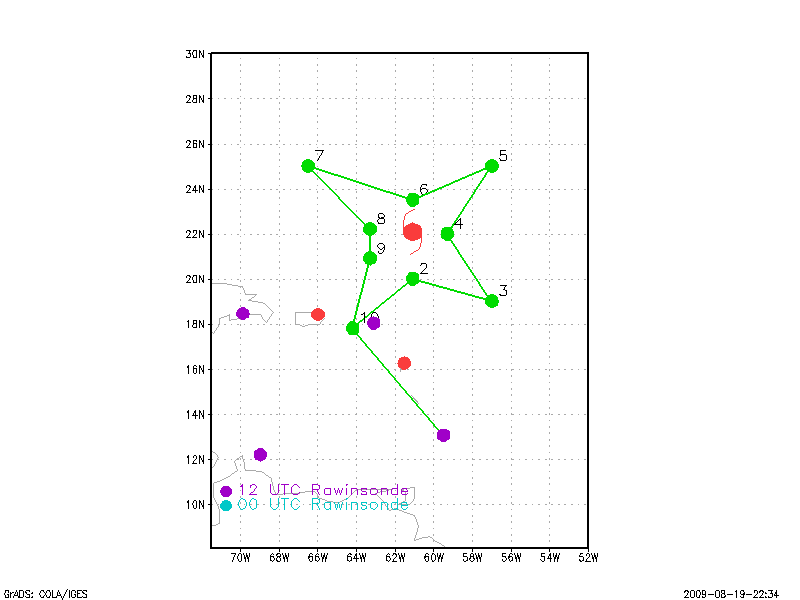
TC and is shown in Fig. 1, along with the 24 GPS dropsonde points.
|
|
Fig. 1: Flight track (black line) for TDR/RI/SALEX mission 20090820n1
overlaid on GOES visible imagery from 1045 UTC. The GPS dropsonde points
(24 total) are indicated by black circles and hash marks. Imagery courtesy of
NRL-Monterey
|
Mission Summary :
a) Synoptic Situation
On 20 August 1200 UTC, Hurricane Bill was a moderate category 3 hurricane
(110 kt) located at ~22.1°N 61.0°W (Fig. 2) and positioned between two
large Saharan Air Layer (SAL) air masses. Figure 2 (bottom) also shows that
the SAL air mass west of Hurricane Bill contained a significant amount of
dust from the near-surface up to ~4.5-5 km. The storm was tracking 305 degrees
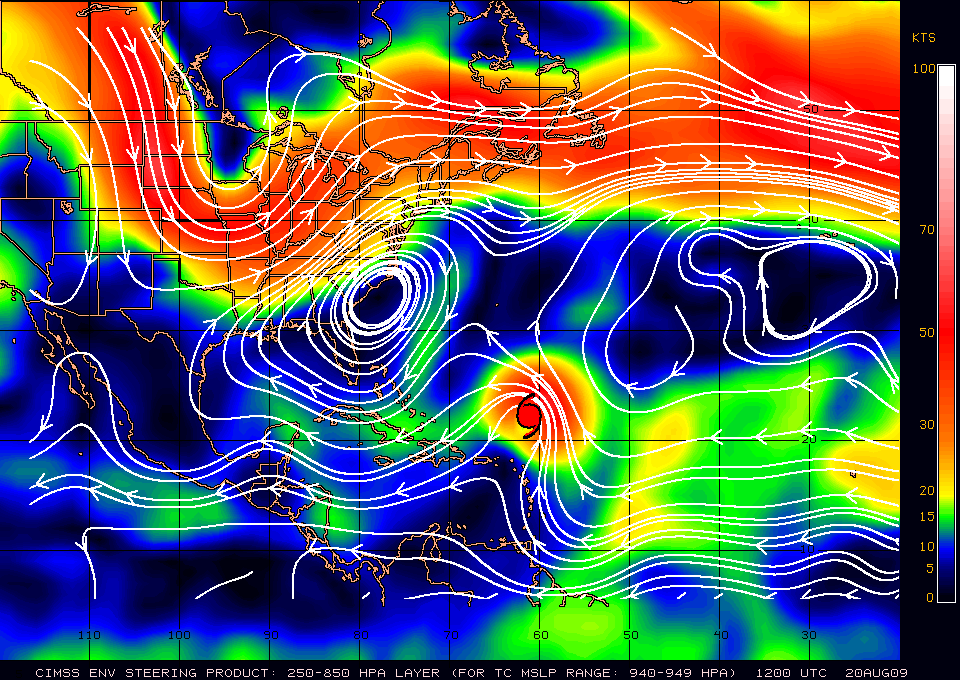
at 16 kt through a weakness in a deep layer ridge north of the storm [Fig. 3
(left)]. A trough was continuing to amplify over the central U.S. at this time.
Bill was located in a region of increasing westerly shear (15-20+ kt, Fig. 3,
right). Interestingly, the region of 20+ kt vertical shear being analyzed SE
of the storm appears to be a bonafide localized shear maximum and was also
indicated in the dropsonde data.
|
|
|
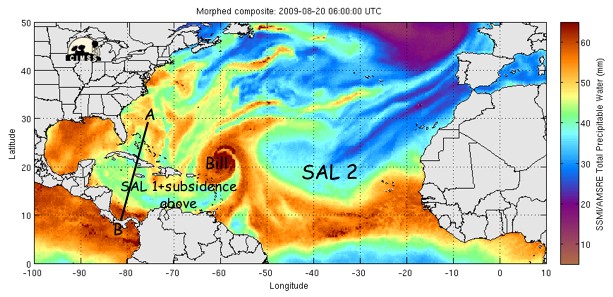
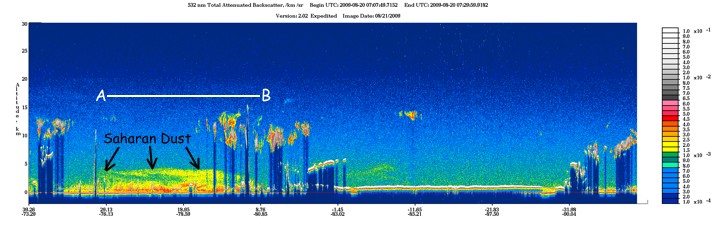
Fig. 2: (Top) TPW imagery (20 Aug 0600 UTC) showing Hurricane Bill and
two large SAL outbreaks (green to blue shading; ≤45 mm TPW) located east,
south and west of the storm. The black line labeled "A" and "B" shows a
coincident CALIPSO satellite overpass. (Bottom) Cross section of aerosols
detected by a 0707-0729 UTC CALIPSO overpass along the transect labeled
"A" and "B" in the TPW image.
|
Dropsonde #3 was launched in this area SE of the storm and showed the following
winds: 200 mb (6.4 kt @240 deg), 700 mb (42 kt @160 deg), and 850 mb (37 kt
@173 deg). The winds in this dropsonde profile equate to the following deep
layer wind shear values: 200-850 mb (35 kt @353 deg) and 200-700 mb (41 kt
@331 deg). Though there may be some vortex influence (particularly with the
200 mb winds) on these shear values calculated from dropsonde #3, the strong
low to mid-level flow was clearly driving the high shear values. These winds
were not related to the storm circulation, but were in fact associated with a
low to mid-level jet collocated with a dry SAL intrusion in this region of the
storm (see Mission Specifics section below).
|
|
|
Fig. 3: Plots of (left) 250-850 mb deep layer mean steering [magnitude
(direction) of the steering flow is indicated by colored shading (white
streamlines] and (right) vertical wind shear for 20 August 1200 UTC.
Images courtesy of UW-CIMSS.
|
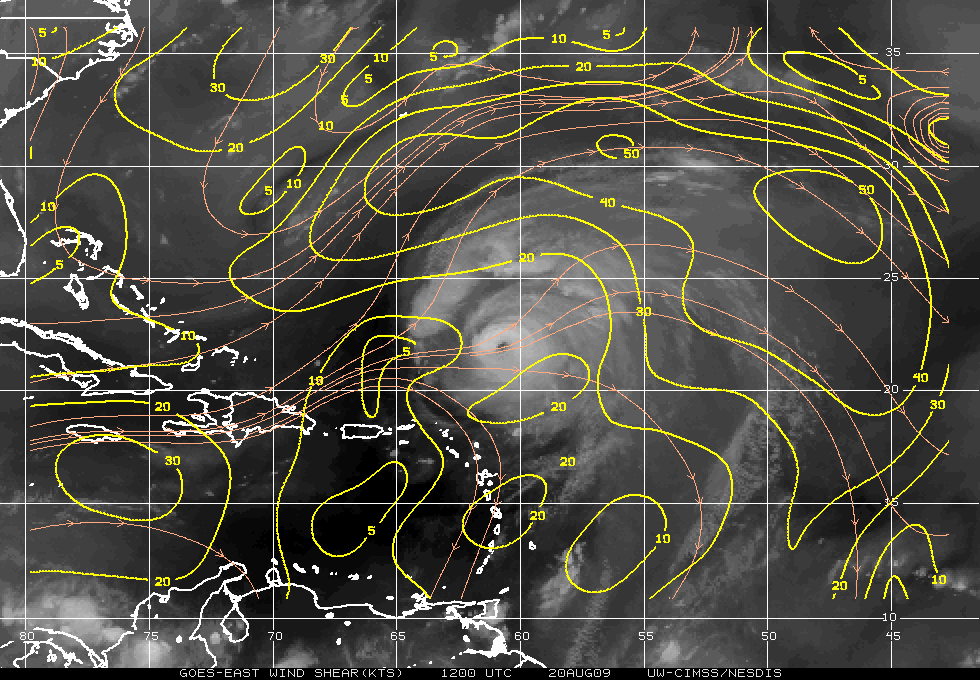
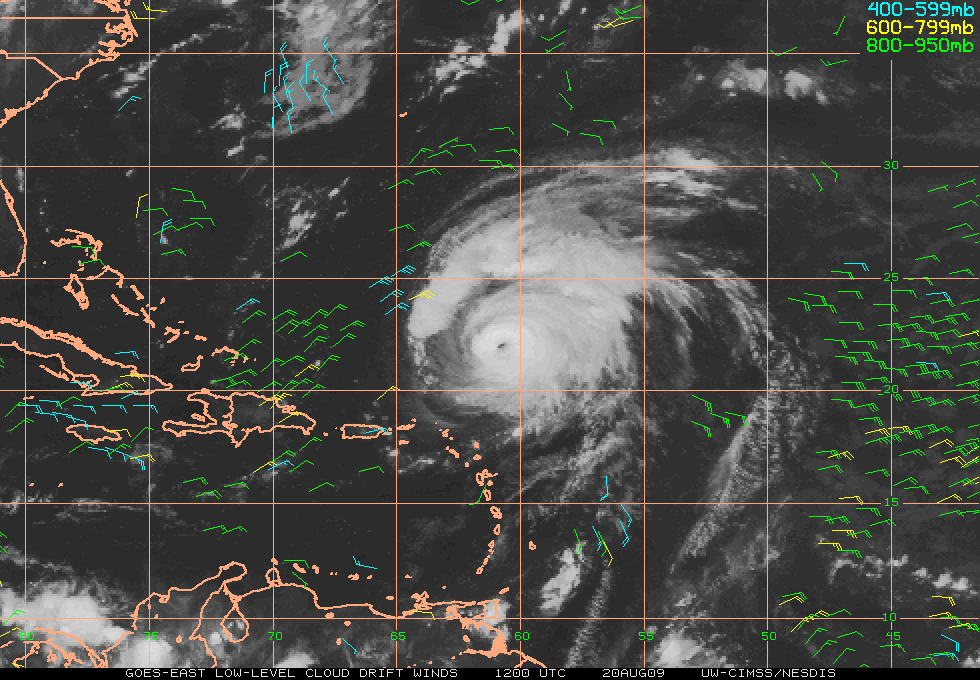
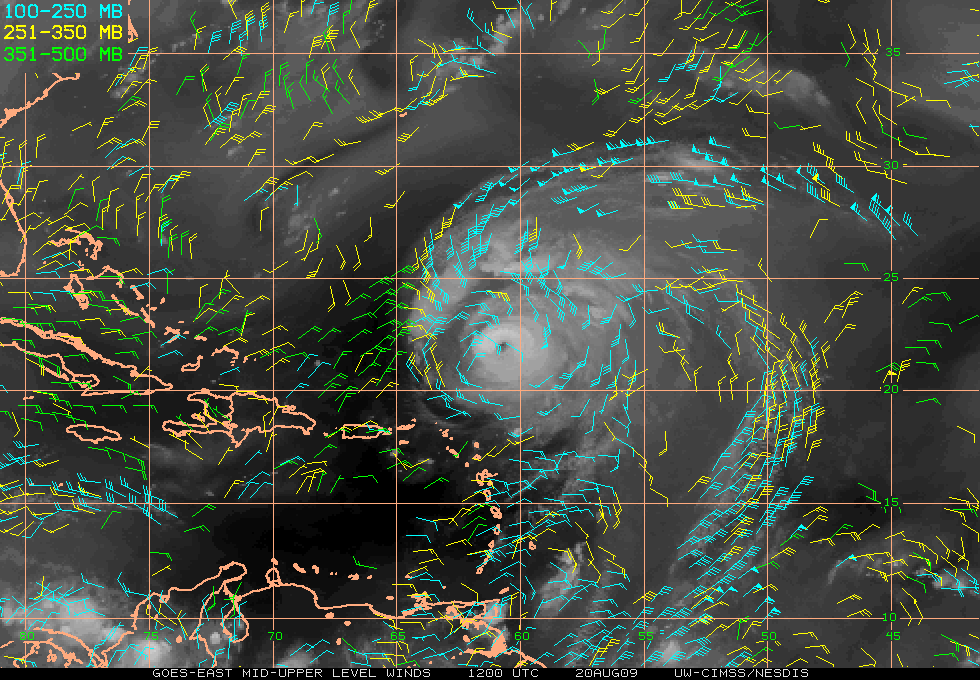
GOES low-level cloud drift winds indicated strong (25-35 kt) winds NW and west
of the storm (Fig. 4, left). GOES water vapor winds also indicated that the
upper-level outflow pattern was continuing to become less favorable.
Upper-level winds were now cyclonic around most of the storm except in the NW
quadrant. Upper-level outflow was concentrated on the north side of the storm
with winds of 40-65 kt (Fig. 4, right). TPW imagery indicated that a SAL
intrusion was continuing to wrap into the storm from the SW quadrant and had
penetrated around to the SE and NE quadrants (Fig. 2, top). GPS dropsonde data
indicated that the dry air had even reached the north side of the storm. This
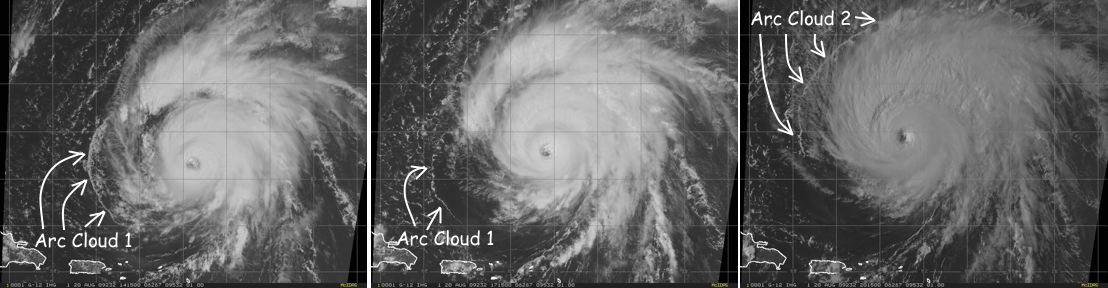
dry air intrusion also appears to have triggered a significant arc cloud event
on the SW and N/NW sides of the storm later in the day (Fig. 5).
|
|
|
Fig. 4: Plots of (left) GOES low to mid-level cloud drift winds and (right)
mid to upper-level water vapor winds for 20 August 1200 UTC. Images courtesy
of UW-CIMSS.
|
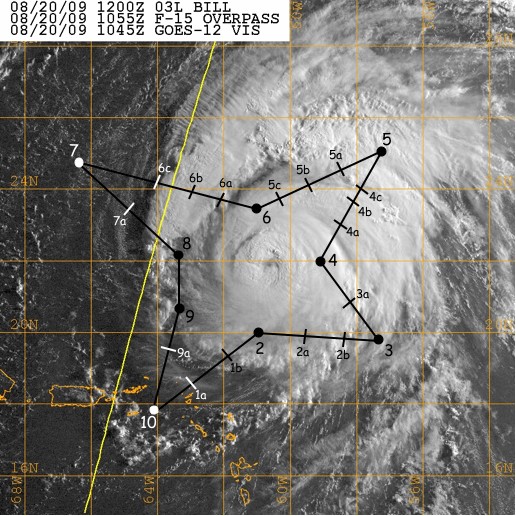
b) Mission Specifics
The flight plan was designed to investigate Hurricane Bill with targeted
sampling of SAL air masses positioned around the storm, a dry air intrusion
wrapping around the storm, and the moist tropical environment associated with
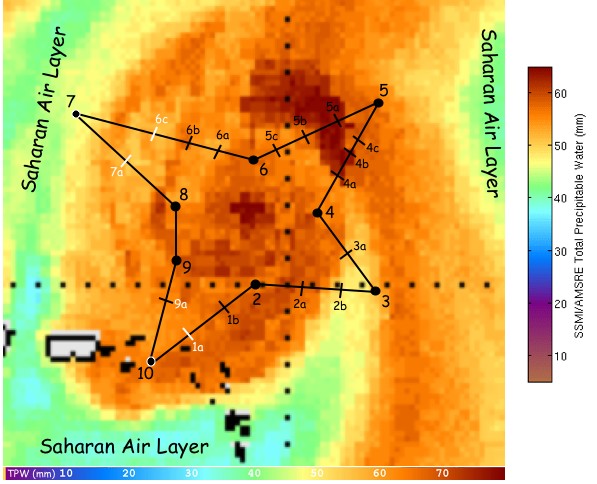
the storm (Figs. 2 & 6). TPW values of ≤45 mm (>45 mm) were used to
discern the SAL (moist tropical) environments around the storm. The G-IV star
pattern that was flown was a new flight pattern that was designed to sample the
environment surrounding the storm and the possible penetration of that
environment in toward the "inner core" region. Extra GPS dropsonde sampling
along the "radial" legs of the starfish pattern were designed to observe this
transitional environment and improve our understanding of how the surrounding
environment may or may not be impacting the "inner core" of the storm.
|
|
Fig. 5: Hurricane Bill GOES visible imagery on 20 August 2009 at (left) 1415
UTC, (middle) 1715 UTC, and (right) 2015 UTC). Arc cloud events in the SW and
NW quadrants of the storm are indicated in the images.
|
Takeoff was at 0749 UTC from Barbados. The flight plan called for a
counter-clockwise sampling of the storm at an optimal flight level of
41,000-45,000 ft. It was anticipated that the dry air intrusion that had
penetrated to the northern semicircle might trigger an arc cloud event on the
north and NW sides of the storm. Therefore, it was desirable to reach these
areas during daylight hours and a counter-clockwise flight pattern would ensure
that. GOES water vapor winds indicated that given the largely upper-level
cyclonic flow around the storm, the G-IV would actually encounter more tail
winds by flying an anti-cyclonic pattern.
|
|
Fig. 6: TPW imagery showing Hurricane Bill on 20 August 1200 UTC. The
SAL's dry air is indicated by values of ≤45 mm (green to blue shading) in
the TPW image. The G-IV flight track (black curve) and dropsonde points (black
circlesand hash marks) are overlaid for reference. Imagery courtesy of
UW-CIMSS.
|
Main targets included the SAL 1 air mass NW, SW and SE of the storm, the SAL 2
air mass NE of the storm, the SAL intrusions that was advecting into the SW and
SE quadrants, the moist tropical atmosphere close to the "inner core" region
and the transitional environment between the SAL and the "inner core"
environments (Figs. 2 and 6). Dropsondes launched from points 3 to 6b captured
unusual thermodynamic and wind patterns associated with the dry SAL intrusion.
Many of the profiles indicated dry air (10-40% RH) in the middle levels
(~500-800 mb) that was collocated with ~45-85 kt jets that appeared to follow
the inflow of the dry intrusion. Though it is not clear exactly what mechanism
was driving these jets, they appear to have been highly correlated to the
vertical placement of the dry air and represent an extremely efficient means of
advecting that dry air in toward the storm. Dropsondes just east and NE of the
center showed near-surface RH values of 40-78% and suggest that strong
convectively driven downdrafts may have been occurring as the dry SAL air
reached these precipitating areas of Hurricane Bill. It is also likely that
the dry air intrusion and evidence of strong downdrafts that were observed were
the precursors to the formation of the significant arc cloud events that
occurred near the end of the G-IV mission (Fig. 5).
Problems :
There were no major problems related to this flight. Twenty-six GPS dropsondes
were deployed during the mission, three of which were fastfalls.
Mission Data :
Drop log
Page last updated October 13, 2009
Return to Mission page.