Mission Summary
20090820I2 Aircraft 43RF
TDR flight into Hurricane Bill 2009
Aircraft Crew (43RF)
| Aircraft Commander | Barry Choy |
| Co-pilot | Mark Nelson |
| Co-pilot | Cathy Martin |
| Flight Engineer | Paul Darby |
| Flight Engineer | Joe Klippel |
| Navigator | Tim Gallagher |
| Navigator | Chris Sloan |
| Flight Director | Jack Parrish |
| Flight Director | Richard Henning |
| Lead El Tech | Dana Naeher |
| El Tech | Joe Bosko |
| Avionics Tech | Damon Sans Souci |
Scientific Crew (43RF)
| Lead Project Scientist | Mike Black |
| Dropsonde Scientist | Bachir Annane |
| Radar Scientist | John Gamache |
Mission Plan :
During the late morning of 20 August, NHC classified Hurricane Bill as a major
hurricane with maximum surface winds of 105 kt and a MSLP of 949 mb. Bill was
located near 23°N, 63° W, or about 550 miles to the north of our base
in Barbados and was forecast to strengthen during the next 24 h to a 120 kt
storm while moving to the NW. Hurricane Bill appeared on satellite as a classic
West Indies hurricane with a large, clear eye surrounded by a thick CDO (Fig.
1). The hurricane was, however, imbedded within a relatively dry air mass and
arc clouds were seen propagating away from Bill's core to the west and
northwest. There was an absence of rainbands on Bill's south and west sides.
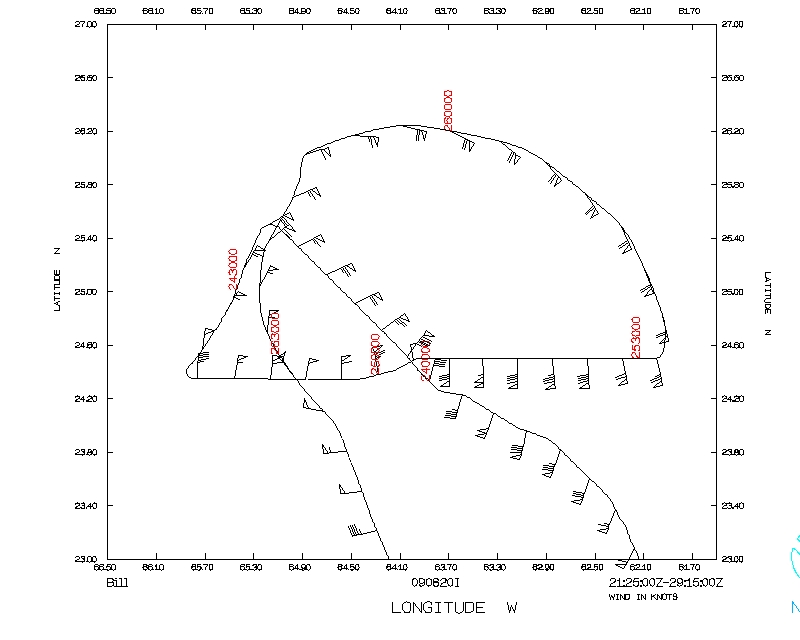
This was to be the last P3 mission in Bill and was designed to be a Tail
Doppler Radar (TDR) mission with a rotating figure 4 pattern with 105 nmi
radial legs. The P3 radar system (LF and Tail) was inoperable for much of the
previous flight and AOC engineers were working on the system before and during
the pre-flight pilots briefing. There was hope that the system could be
repaired before a planned takeoff at 2000 UTC but that it might go down again
during the flight. If the radar was broken, then we needed an alternative to
the TDR mission.
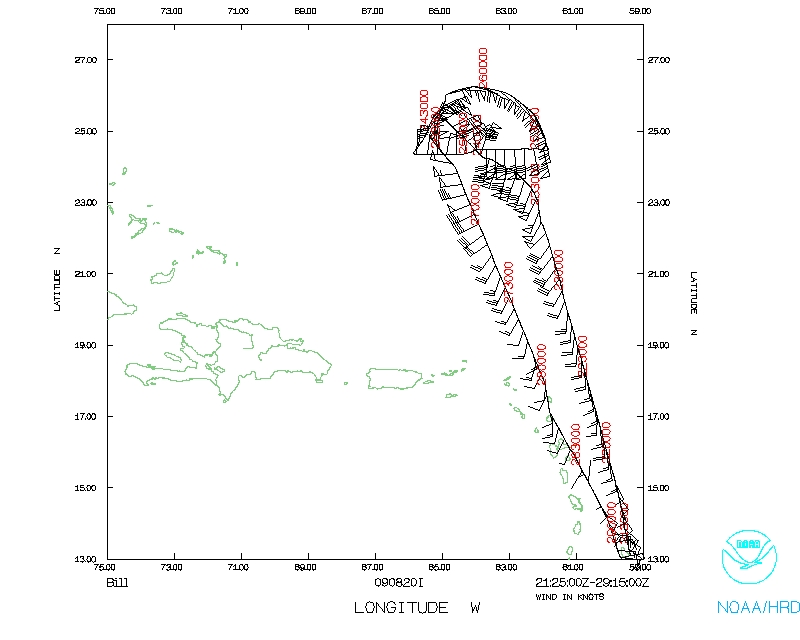
The NOAA G-IV and an Air Force C-130 had been tasked by NHC to conduct a
synoptic surveillance mission in the environment of Bill with a takeoff time
of 1730 Z. The flight tracks for these surveillance missions would provide
excellent coverage of the environmental air surrounding Bill, including a
circumnavigation just outside of Bill's core by the G-IV (Fig. 2).
During the Pilot's briefing we discussed an alternative flight plan in case
the radar system was inoperable. This plan included a figure 4 with 105 nmi
radial legs, starting from the SE and ending up on the east side of Bill. We
then would attempt a circumnavigation within the core of Bill and following
what appeared to be a pronounced dry slot as viewed with microwave imagery.
Dropsonde would be released at the end points, RMW and center of the figure 4
legs as well as at regular intervals during the circumnavigation of the dry
tongue.
It turned out that the radar system would be inoperable for the flight and we
could go with our alternative plan to study the affect of the dry air on Bill.
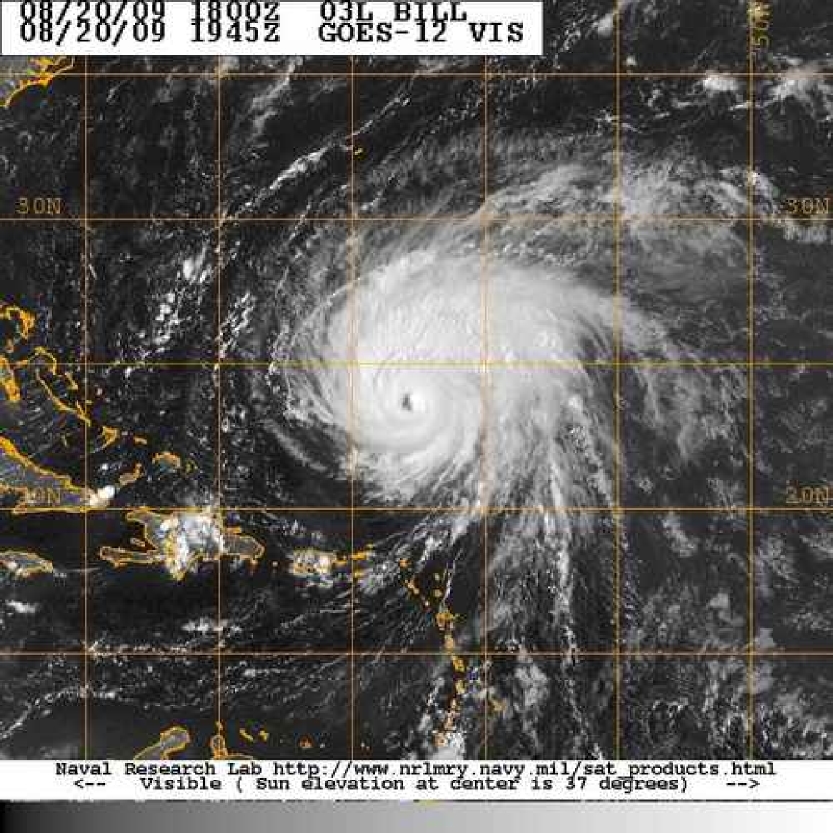
Figure 1: Visible satellite image of Hurricane Bill at 1945 UTC, right
before N43's planned takeoff.
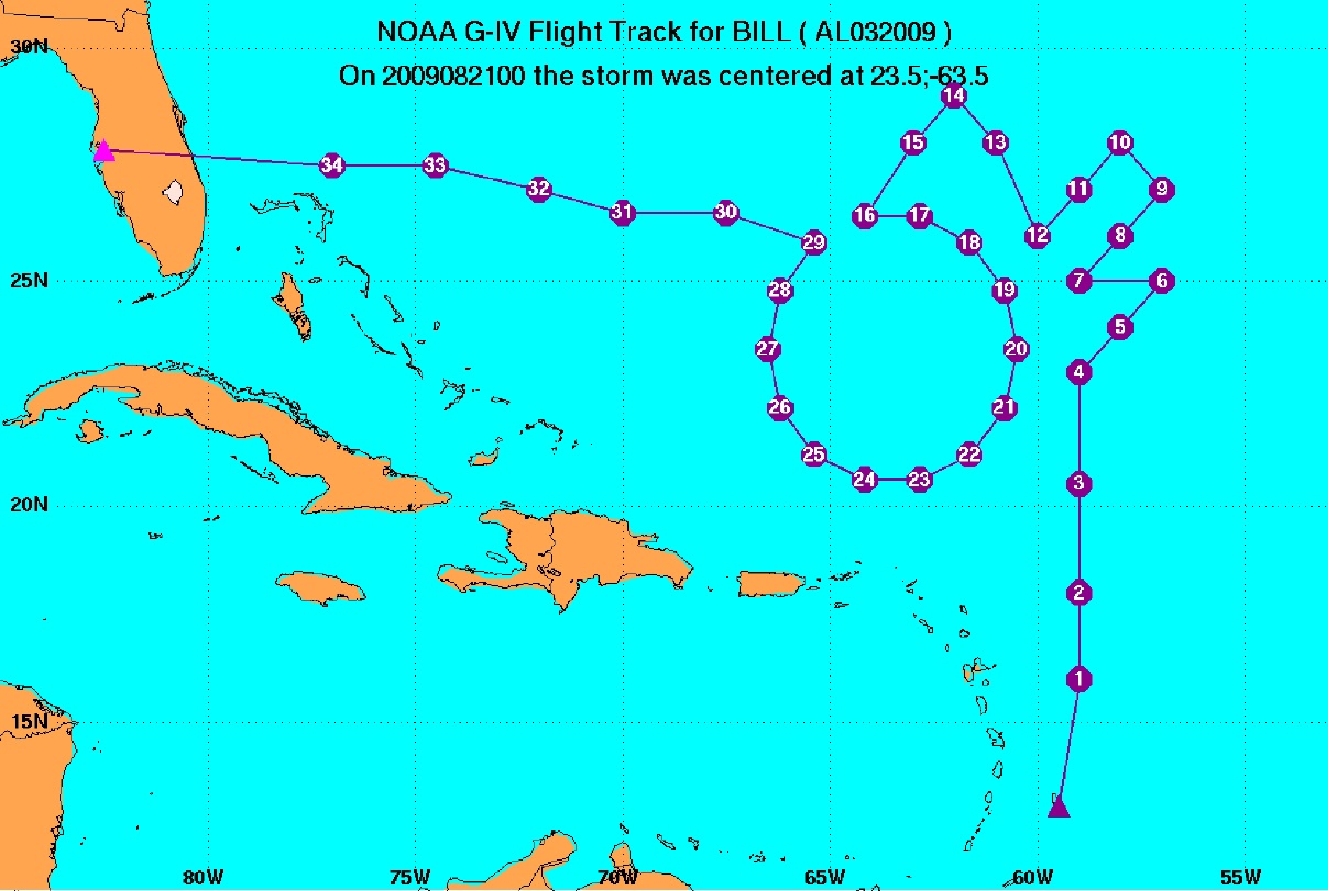
Figure 2: Planned track of the NOAA G-IV surveillance pattern around
Hurricane Bill.
Mission Summary :
| Take off
| Landing
| Barbados | 21:23 UTC
| Barbados | 04:12 UTC
| |
Our planned takeoff was delayed by a combination of work done on the radar and
data systems problems. We finally took off at 2123 UTC and headed north to our
IP, 105 nmi SE of Bill's eye. During the ferry to the storm, we noticed an
absence of convection and a pronounced layer of SAL air below our flight level
of about 600 mb (Fig. 3).

Figure 3. Photograph of SAL dust below our 600 mb level on ferry south of
Bill.
At 2337 UTC we descended to 10 kft and reached our IP at 2334 UTC to begin our
figure 4 pattern. We also released our first dropsonde here and the data from
that sonde showed temperature inversions just below 950 mb and 800 mb.
Saturated air was confined to the boundary layer and substantial drying was
present above the inversion at 800 mb (Fig. 4).
We proceeded west and released sondes at 75 nmi radius, the SE RMW, and the eye
which we reached at 2358 UTC. The eye sonde was typical of a strong hurricane
with low-level moisture, a strong inversion and drying above 850 mb. The sonde
reported a MSLP of 946 mb, slightly lower than estimated from satellite.
Maximum flight-level winds on our inbound pass were 105 kt and the SFMR and
sonde reported surface winds of about 85 kt. The flight-level winds were
stronger on our outbound pass to the NW, about 115 kt and the SFMR and a sonde
measured surface winds of about 95 kt, about 10 kt lower than expected based on
the central pressure and the NHC advisory.
We reached our NW point, 105 nmi NW of Bill's eye at 0023 UTC and headed south
for our second and last pass though Bill, from west to east. The west point was
reached at 0038 UTC and we were in the eye again at 0104 UTC. We did not
release a drop in the eye on this pass. The end of our figure 4 was at 0130
UTC, 105 nmi east and we climbed to 15,000 ft to begin our circumnavigation
around Bill, trying to stay in the dry slot outside of Bill's eyewall and
adjacent rainbands.
We uploaded microwave and water vapor imagery during the flight to help
navigate downwind in the dry tongue. The nose radar was also useful in the
navigation. Examples of these images that we used are in Fig. 5. We quickly
flew downwind at about 100 nmi radius from Bill's eye, starting from the east
side and ending up on the southwest side.
This maneuver took about 1 h and 15 minutes and we released 9 dropsondes along
the way at intervals of about 30° of arc. The dropsonde data agreed
with what was observed on the microwave imagery in that the driest and most
stable air was found on Bill's east side and got progressively more unstable
and moist as we worked our way to the north and west side.
Our last dropsonde was released at 0244 UTC at 23.5°N, 64.4°W,
about 100 nmi south of Bill's eye. We expected to find dry air here but the
sonde had a moist and somewhat unstable sounding. We most likely released that
drop in or adjacent to a stratiform rainband. I would suspect that the drops
from the G-IV at a greater radius will likely show much drier and more stable
air.
From this south point we ferried back to our base in Barbados and we landed at
0412 UTC. We released a total of 20 dropsondes during the mission.
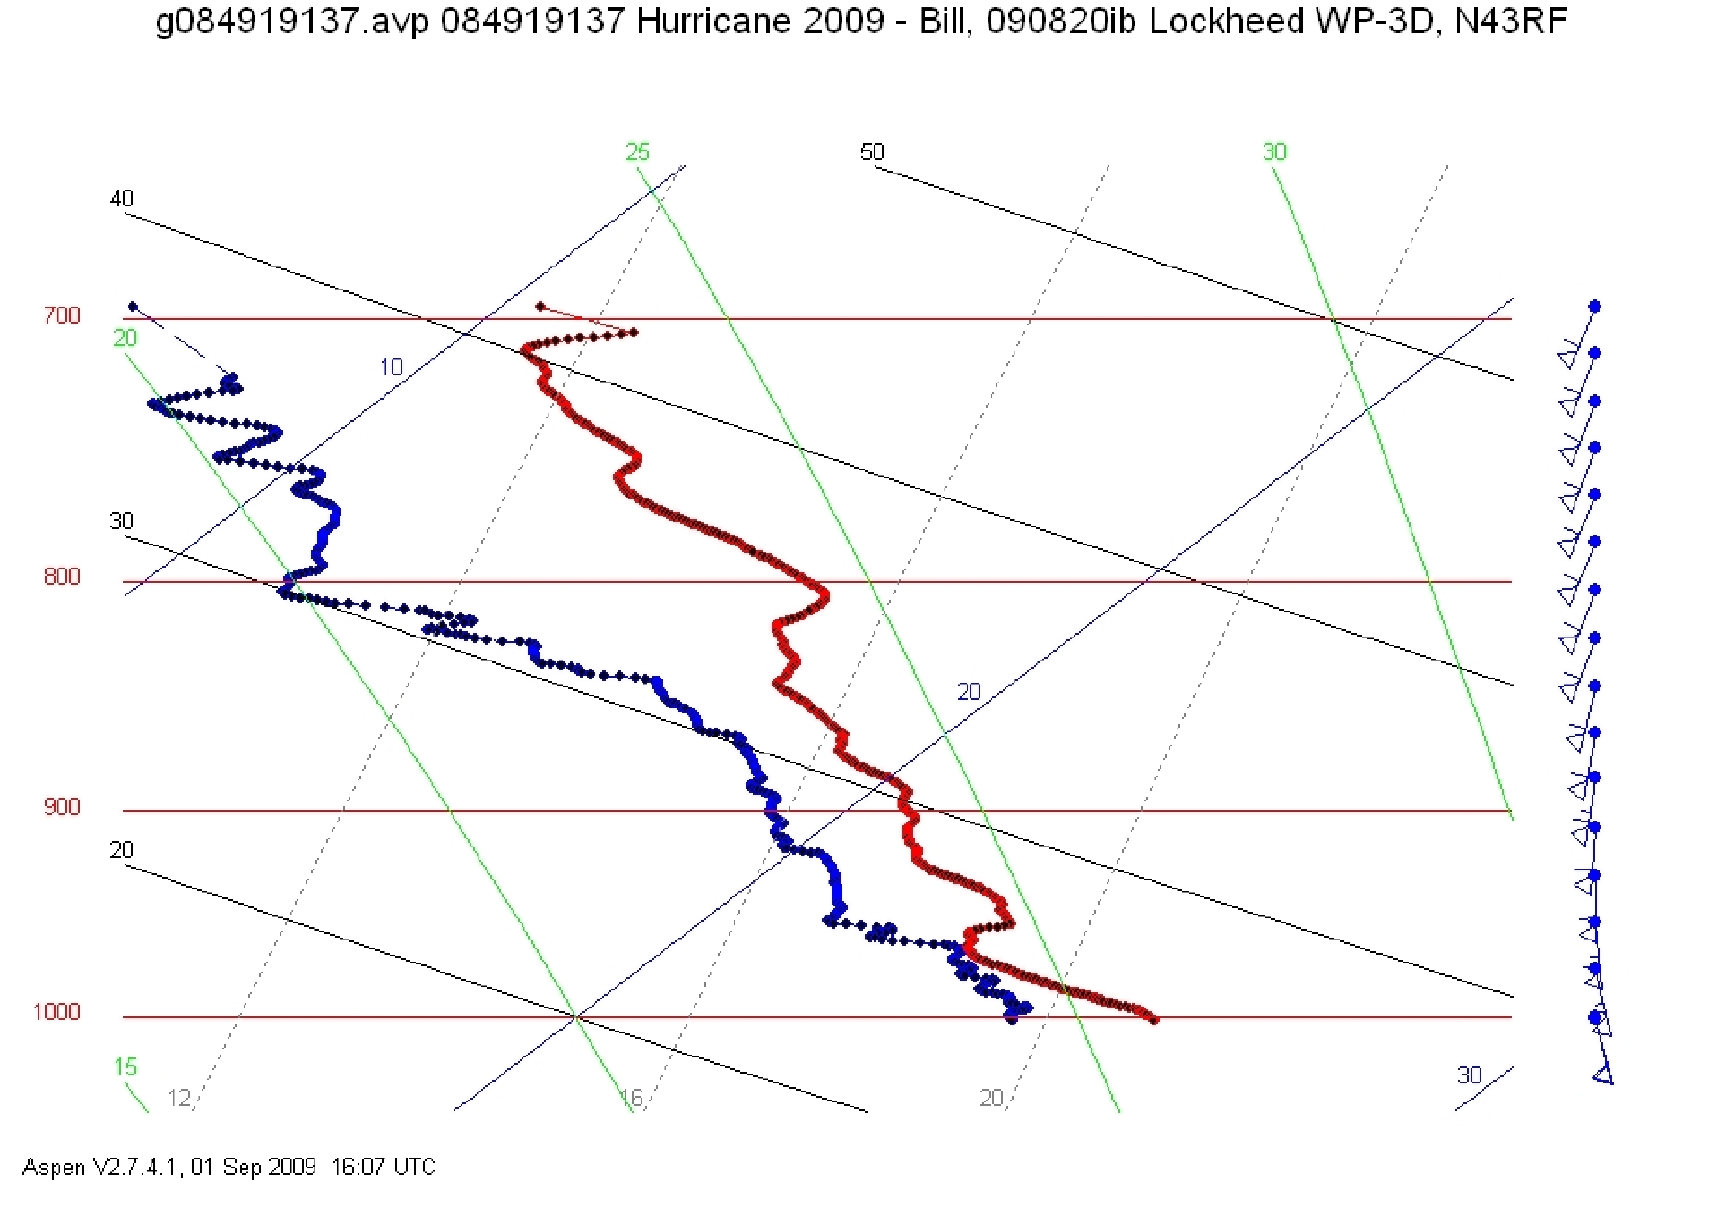
Figure 4: Skew-T diagram from first dropsonde, 105 nmi SE of Bill's center.
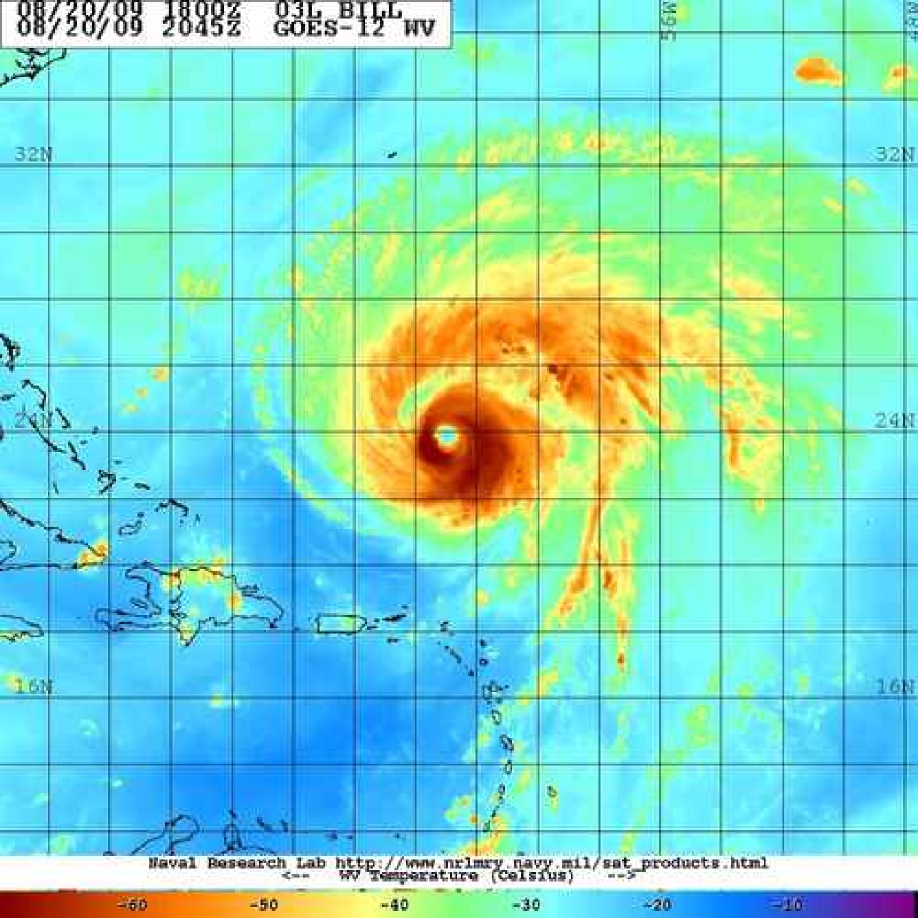
Figure 5: Microwave and water vapor imagery used during the flight to
navigate inside of the dry slot outside of Bill's eyewall and inside of the
spiral rainbands.
Problems :
The flight-level, SFMR, and dropsonde systems worked well for most of
the mission. AOC engineers had to fix and reboot the data system computer prior
to the flight, which delayed our takeoff, but it worked fine afterwards. The
radar system was inoperable during the whole flight. Two of the dropsondes were
fast falls and of these had no launch detect.
Michael Black
8/31/09
Mission Data :
Error Log |
Fast data |
NetCDF file |
1 second data
Page last updated September 2, 2009
Return to Mission page.