|
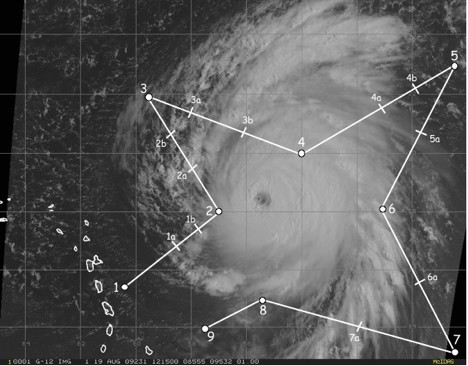
| Fig. 1: Flight track (white line) for TDR/RI/SALEX mission 20090819N1 overlaid on GOES visible imagery from 1215 UTC. The GPS dropsonde points (20 total) are indicated by white circles and hash marks. |
| Aircraft Commander | Will Odell |
| Co-pilot | Greg Glover |
| Flight Director | Jackie Almieda |
| Flight Director | Nancy Ash |
| Electronics Technician | Mark Rogers |
| AVAPS Operator | Steven Paul |
| AVAPS Operator | Dale Carpenter |
| Dropsonde Scientist | Jason Dunion |
|
|
| Fig. 1: Flight track (white line) for TDR/RI/SALEX mission 20090819N1 overlaid on GOES visible imagery from 1215 UTC. The GPS dropsonde points (20 total) are indicated by white circles and hash marks. |
Mission Plan :
NOAA 49RF will fly a combination TDR mission, Rapid Intensity (RI) Experiment and Saharan Air Layer Experiment (SALEX) around Hurricane Bill. The G-IV will leave Barbados at 0750 UTC and will recover back at Barbados at 1426 UTC. The flight track will take the G-IV on a clockwise circumnavigation of the TC and is shown in Fig. 1, along with the 20 GPS dropsonde points.
Mission Summary :
| |
| |
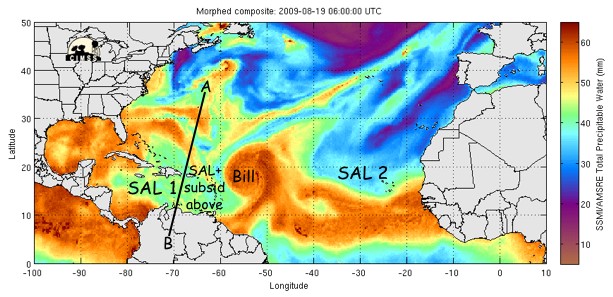
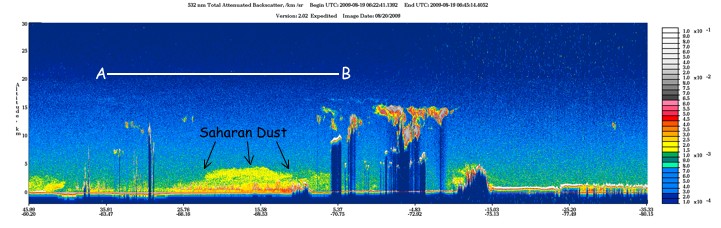
| Fig. 2: (Top) TPW imagery (19 Aug 0600 UTC) showing Hurricane Bill and two large SAL outbreaks (green to blue shading; ≤45 mm TPW) located east, north and west of the storm. The black line labeled "A" and "B" shows a coincident CALIPSO satellite overpass. (Bottom) Cross section of aerosols detected by a 0622-0645 UTC CALIPSO overpass along the transect labeled "A" and "B" in the TPW image. | |
a) Synoptic Situation
On 19 August 1200 UTC, Hurricane Bill was a minimal category 4 hurricane
(115 kt) located at ~18.4°N 55.6°W (Fig. 2) and positioned between two
large Saharan Air Layer (SAL) air masses. Figure 2 (bottom) also shows that
the SAL air mass wrapping around the western semicircle of Hurricane Bill
contained a significant amount of dust from the near-surface up to ~5 km.
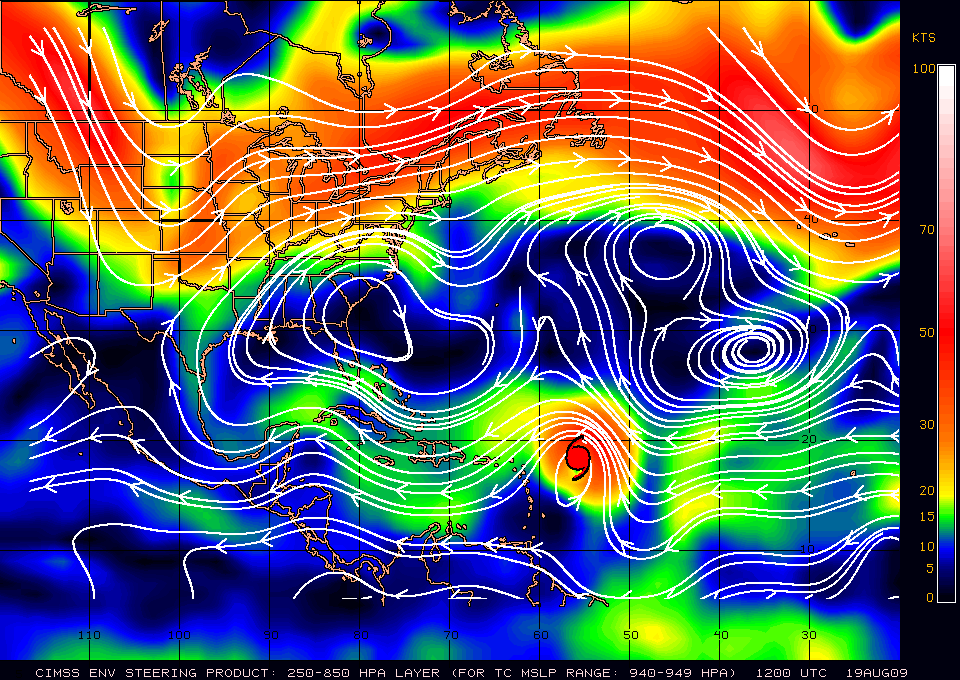
The storm was tracking 295-300 degrees at 14 kt around the southern periphery
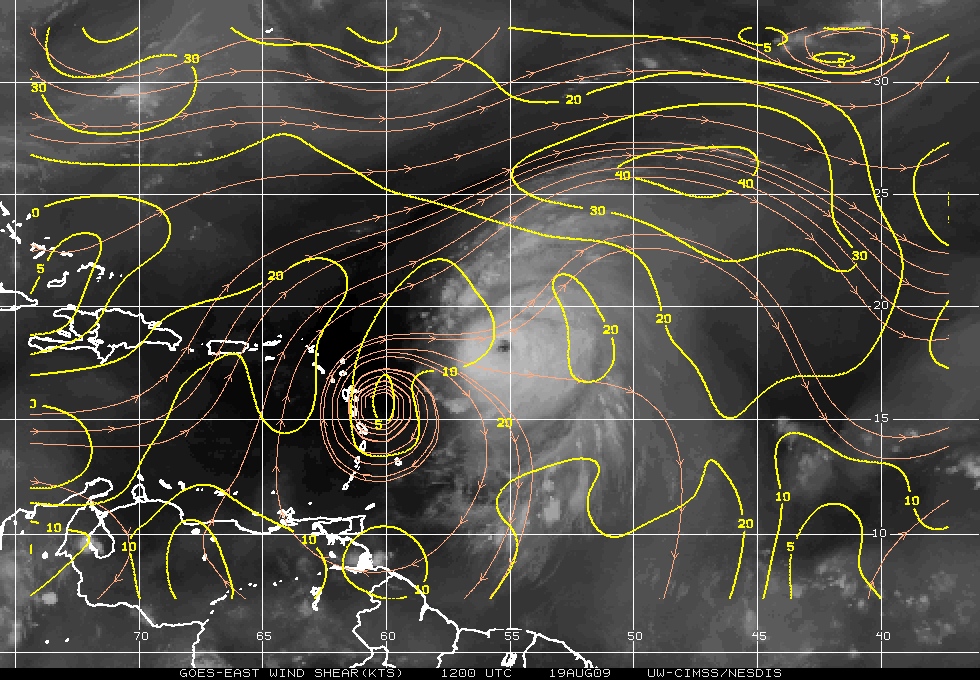
of a deep layer ridge [Fig. 3 (left)]. Also at this time, a trough was
continuing to amplify over the central U.S. and a weakness and a weakness was
developing in the ridge NNW of the storm. Bill was located in a region of
increasing westerly shear (10-20 kt, Fig. 3, right). Based on dropsonde data
from the missions and GOES satellite winds (Fig. 4), the 20+ kt of vertical
wind shear indicated in Figure 3 (right) was likely an artifact of the vortex
removal process. Given the skewed E-W symmetry of the vortex at this time
[more (less) restricted around the western (eastern) semicircle], some of the
upper-level outflow associated with the storm may not have been sufficiently
removed on the eastern side of the storm during the vortex removal.
|
|
| Fig. 3: Plots of (left) 250-850 mb deep layer mean steering [magnitude (direction) of the steering flow is indicated by colored shading (white streamlines] and (right) vertical wind shear for 19 August 1200 UTC. Images courtesy of UW-CIMSS. | |
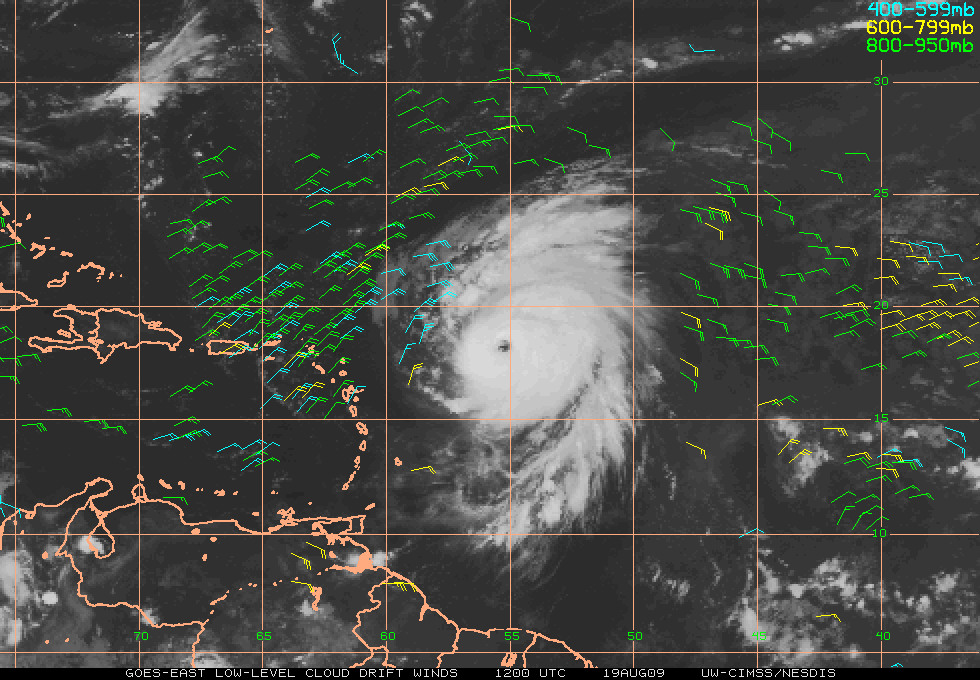
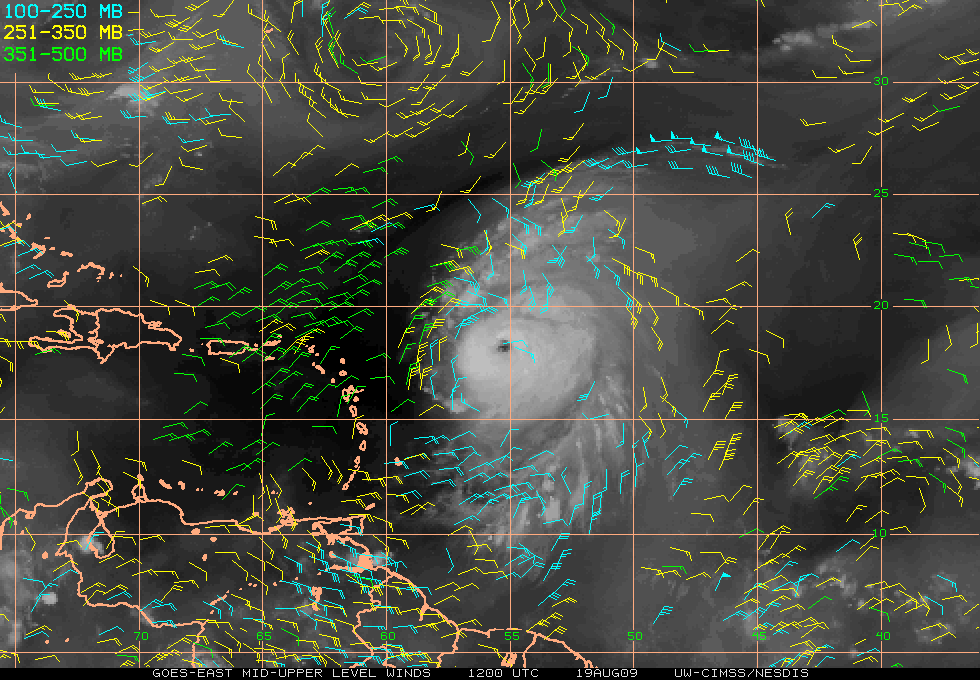
GOES low-level cloud drift winds indicated strong (25-30 kt) winds around the periphery of the northern semicircle of the storm (Fig. 4, left). GOES water vapor winds also indicated that the upper-level outflow pattern was not as favorable as it had been the previous day. Upper-level winds were generally cyclonic in the NW, SE and NE quadrants of the storm. The north side of the storm had the most unrestricted outflow, though there was also some weak (10-20 kt) anticyclonic outflow to the SW (Fig. 4, right). TPW imagery indicated that a SAL intrusion was continuing to wrap into the storm in the southwest quadrant and was even beginning to impinge on the SE quadrant (Fig. 2 (top), Fig. 5).
|
|
| Fig. 4: Plots of (left) GOES low to mid-level cloud drift winds and (right) mid to upper-level water vapor winds for 19 August 1200 UTC. Images courtesy of UW-CIMSS. | |
|
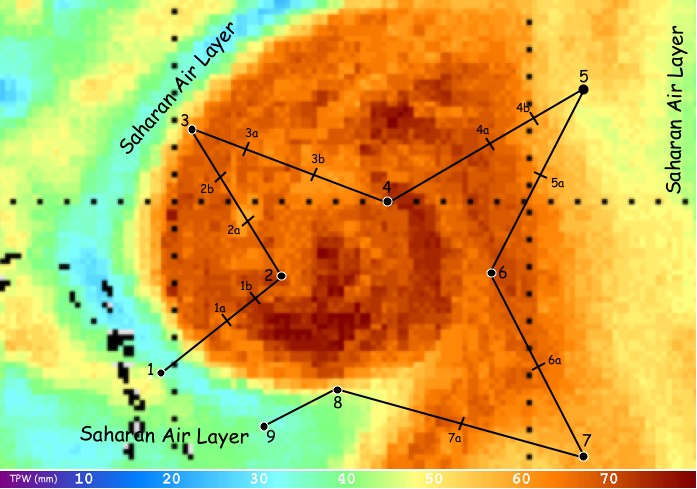
| Fig. 5: TPW imagery showing Hurricane Bill on 19 August 1200 UTC. The SAL's dry air is indicated by values of ≤45 mm (green to blue shading) in the TPW image. The G-IV flight track (black curve) and dropsonde points (black circles and hash marks) are overlaid for reference. Imagery courtesy of UW-CIMSS. |
Problems :
There were no major problems related to this flight. Twenty-one GPS dropsondes were deployed during the mission, one of which was a fastfall.
Page last updated October 13, 2009
Return to Mission page.