Mission Summary
20090819I1 Aircraft 43RF
TDR experiment into Hurricane Bill 2009
Aircraft Crew (43RF)
| Aircraft Commander | Carl Newman |
| Co-pilot | Al Girimonte |
| Co-pilot | Amelia Ebhardt |
| Flight Engineer | Dewie Floyd |
| Flight Engineer | Paul Darby |
| Navigator | Joe Bishop |
| Navigator | Chris Sloan |
| Flight Director | Barry Damiano |
| Flight Director | Ian Sears |
| Data Tech | Terry Lynch |
| Electrical Engineer | Jeff Smith |
| El Tech | Bobby Peek
Damon San Souci |
Scientific Crew (43RF)
| Lead Project Scientist | Rob Rogers |
| Dropsonde Scientist | Kathryn Sellwood |
| Radar Scientist | Shirley Murillo |
| IWRAP Scientist | Joe Sapp (UMass) |
Mission Plan :
Conduct a TDR mission into Hurricane Bill, which was a 110-kt hurricane at 03
UTC, according to NHC. Bill has steadily intensified to 110 kt from 85 kt
yesterday. The eye has cleared out, but the storm is struggling some. Fly a
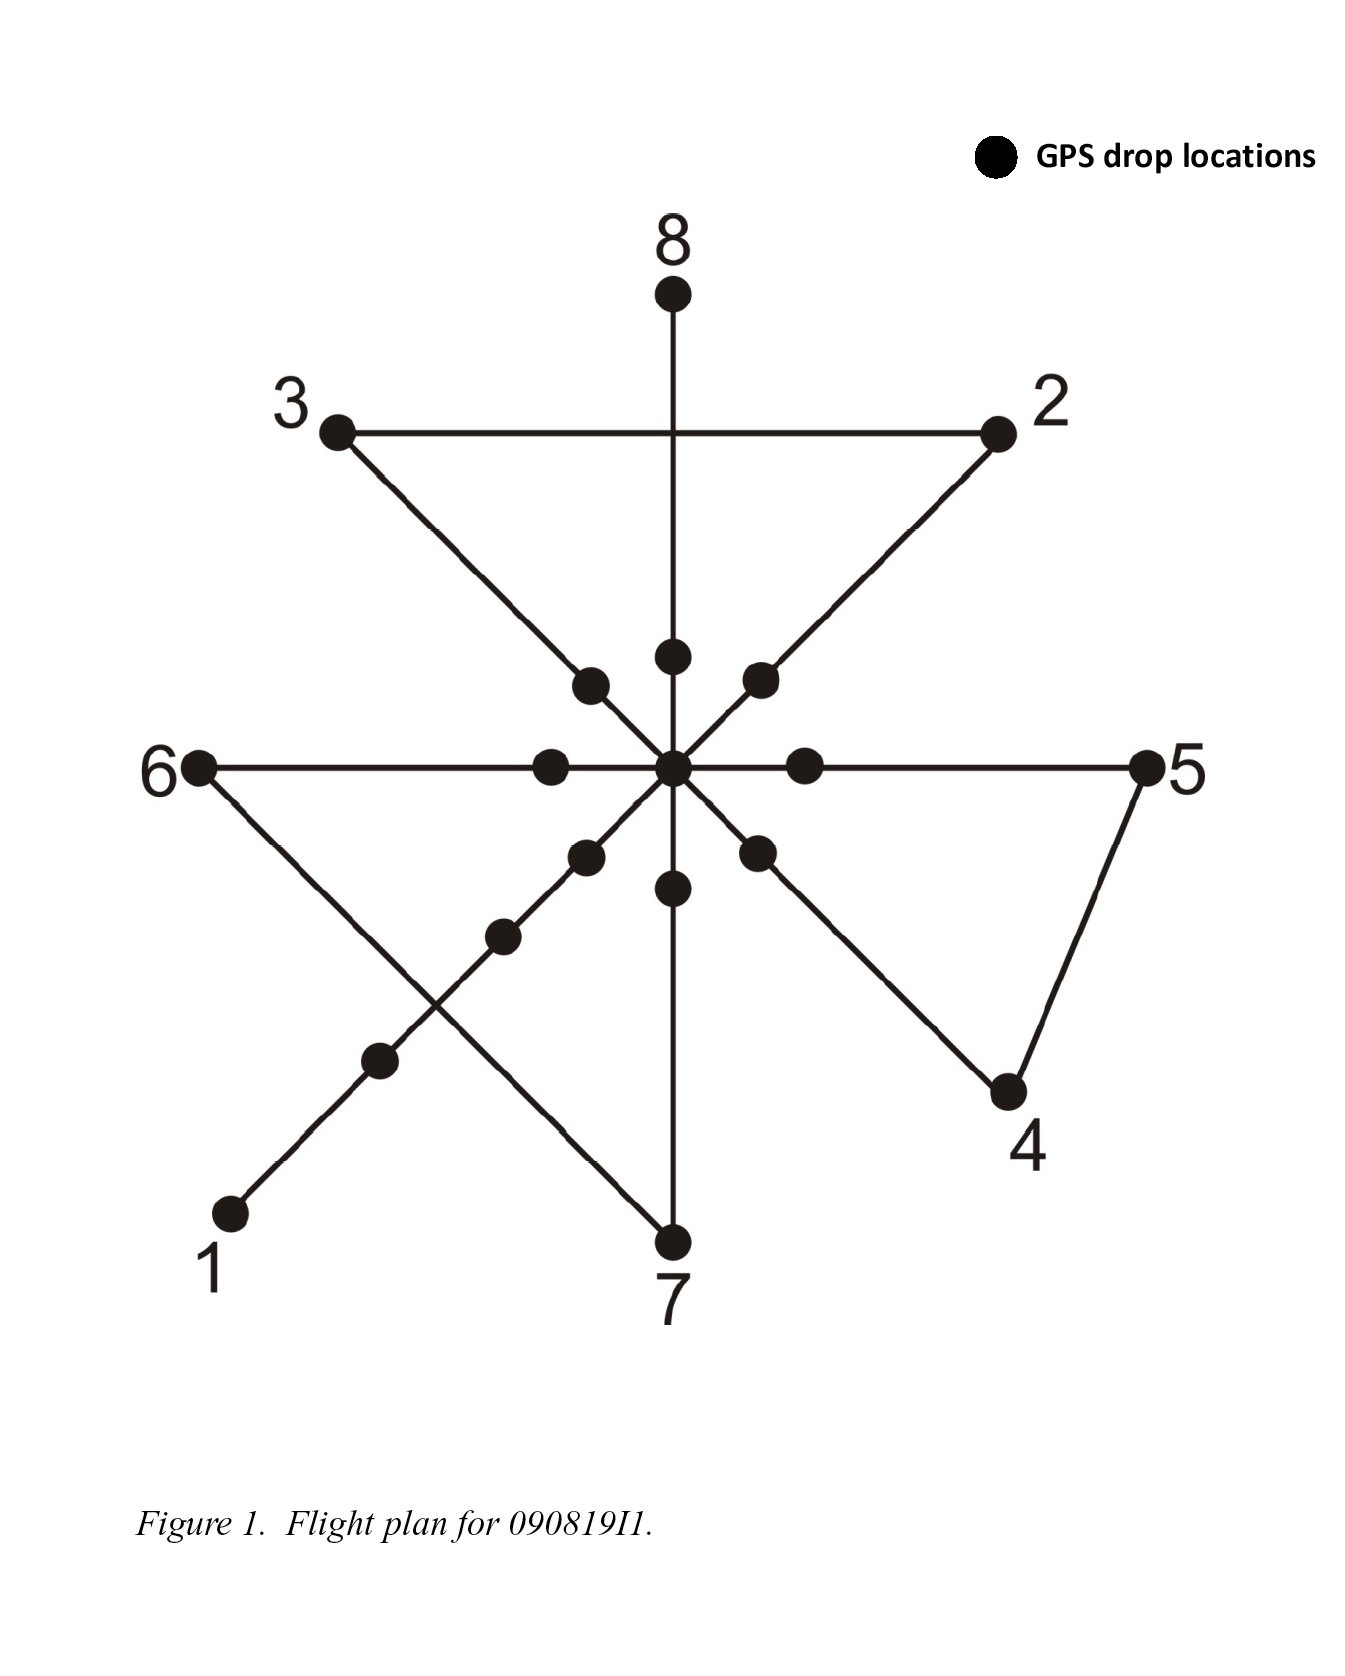
rotated Figure-4 pattern, IP 150 nm from the center on the SW side. Remaining
legs are 100 nm length (Fig. 1). Finish pattern on north side of storm, then
RTB. On ferry to IP, fly successive legs at 500, 5000, 10,000, 14,500, then
20,000 ft. if possible for measurements in SAL using cloud aerosol spectrometer
. If arc clouds are seen, drop sondes across boundary. Drop sondes at
endpoints,2 center drops, and at 150, 100, 50 nm on SW inbound leg. Drop
sondes at all max wind points.
| Take off
| Landing
| Barbados | 07:39 UTC
| Barbados | 15:17 UTC
| |
Mission Summary :
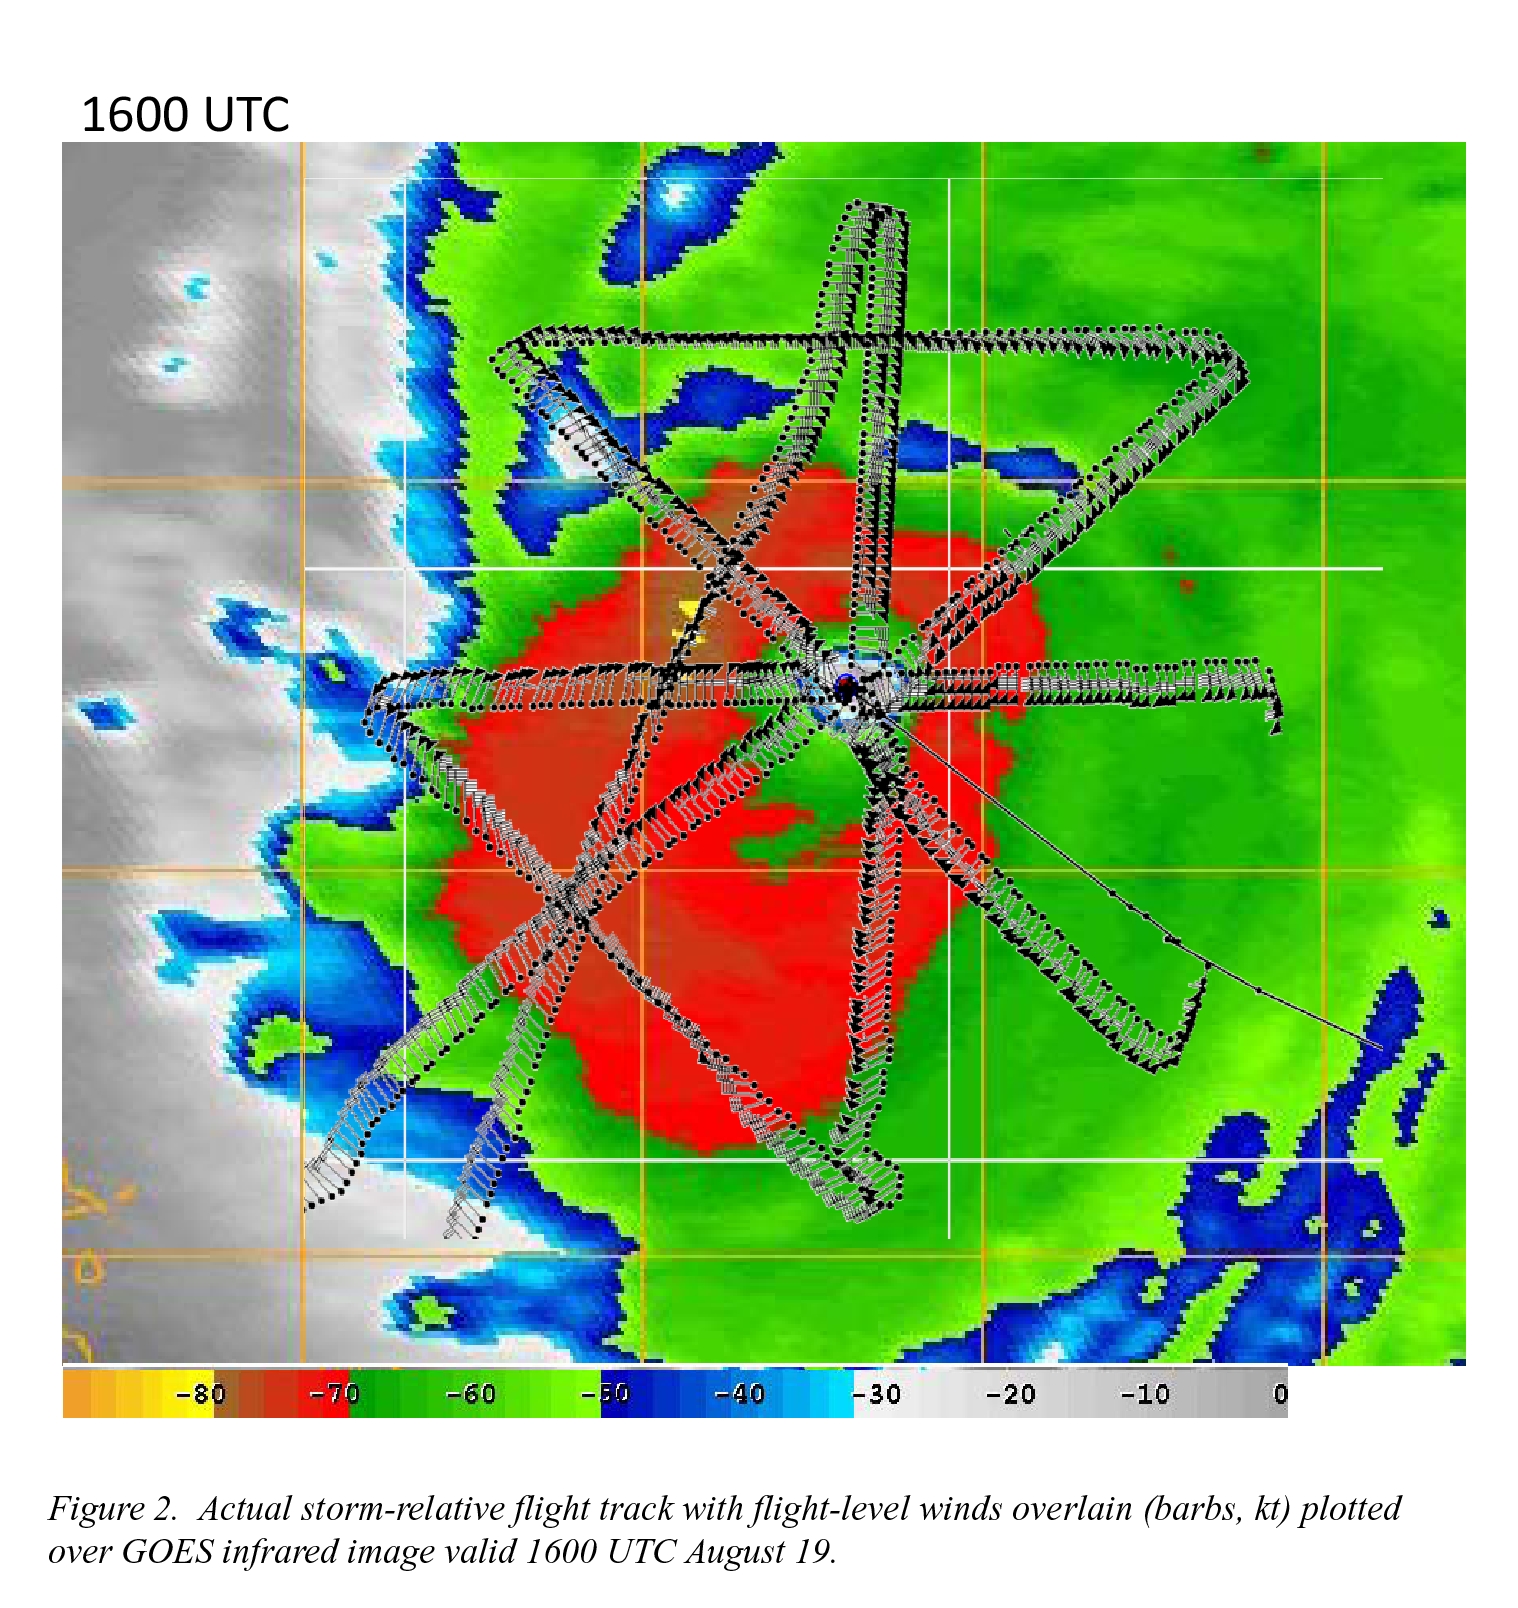
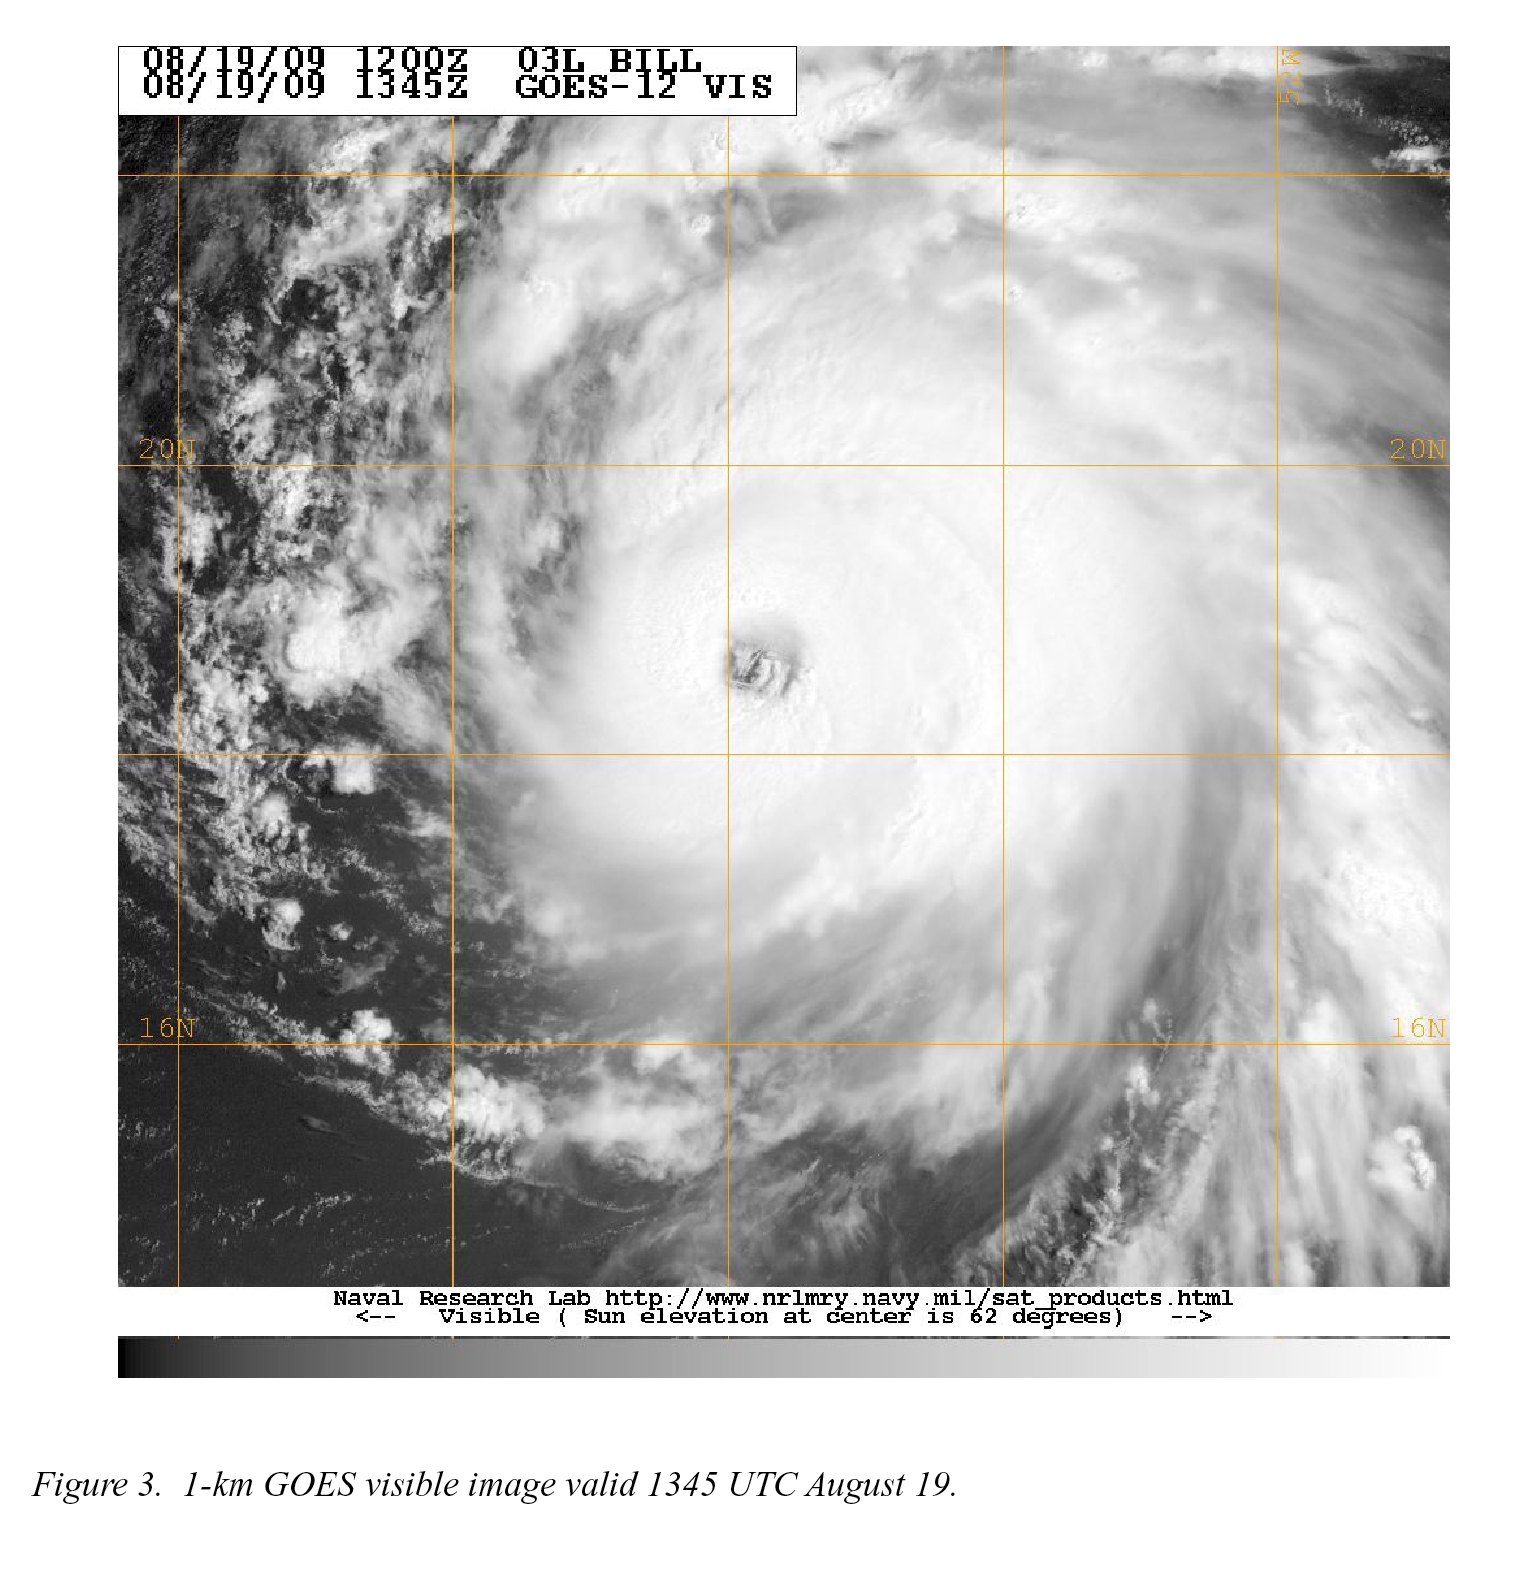
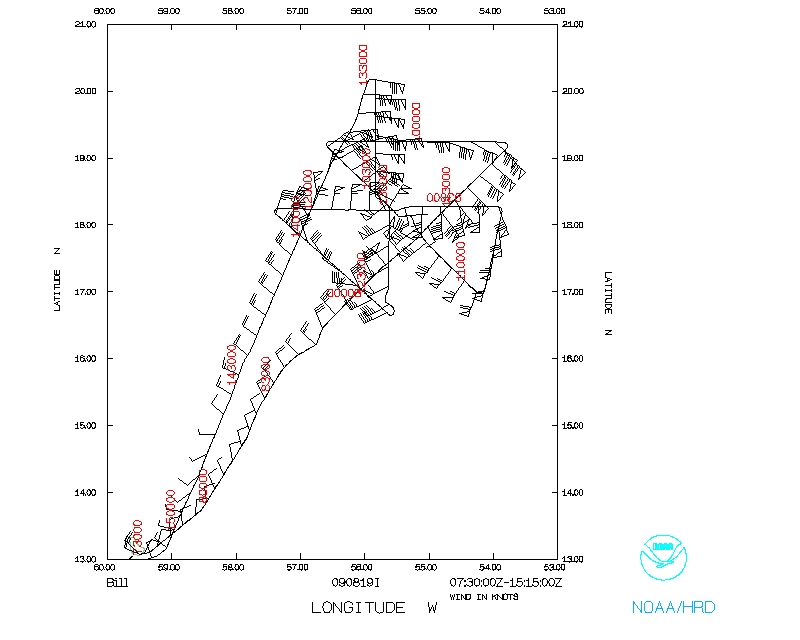
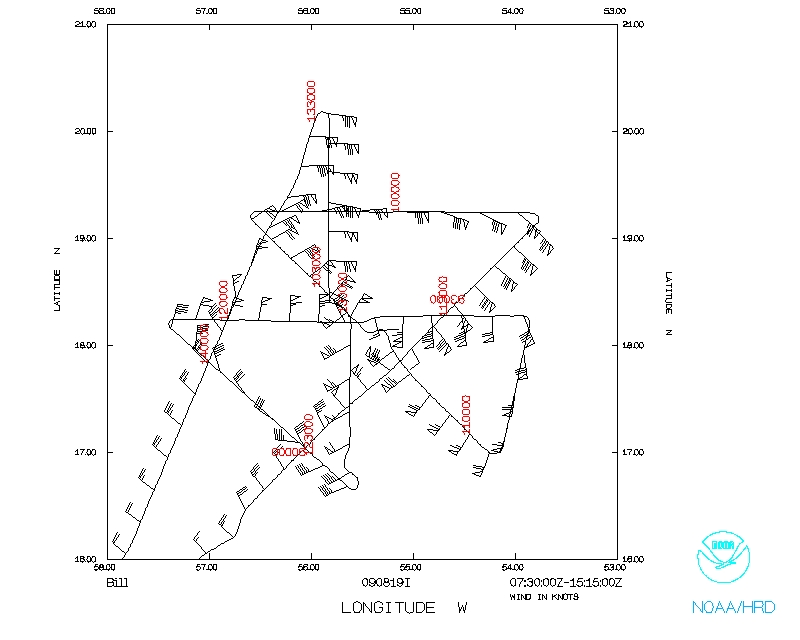
Take off was at 0739 UTC. We flew the pattern as planned (Fig. 2). The storm
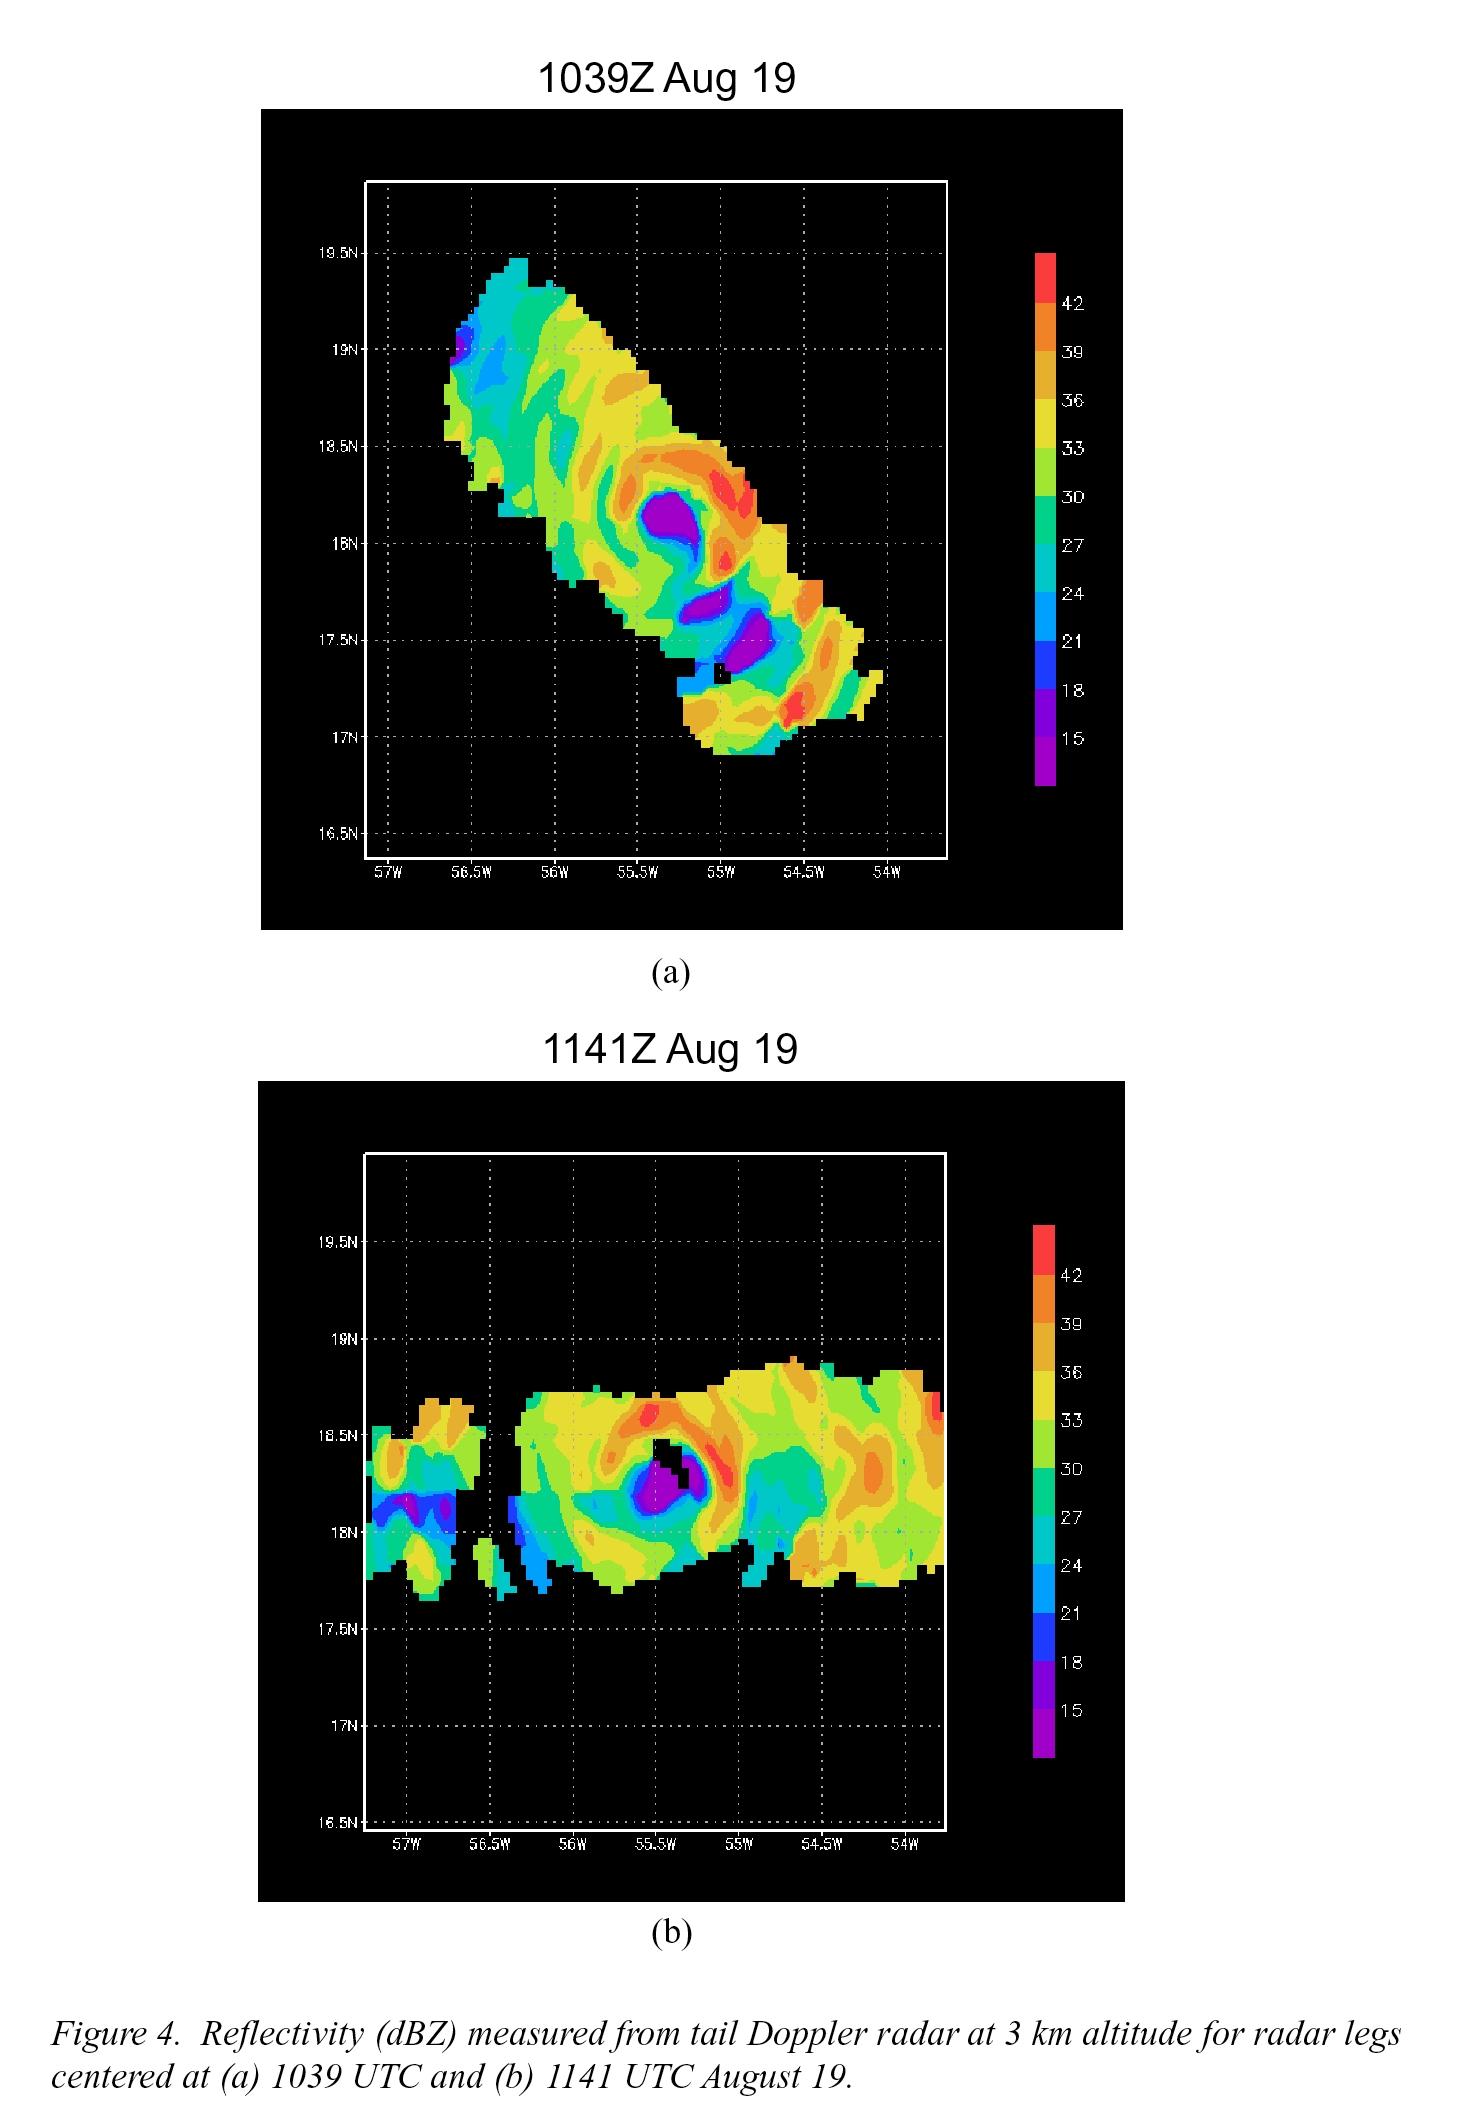
was fairly intense, with a clearing eye (Fig. 3). It was very asymmetric,
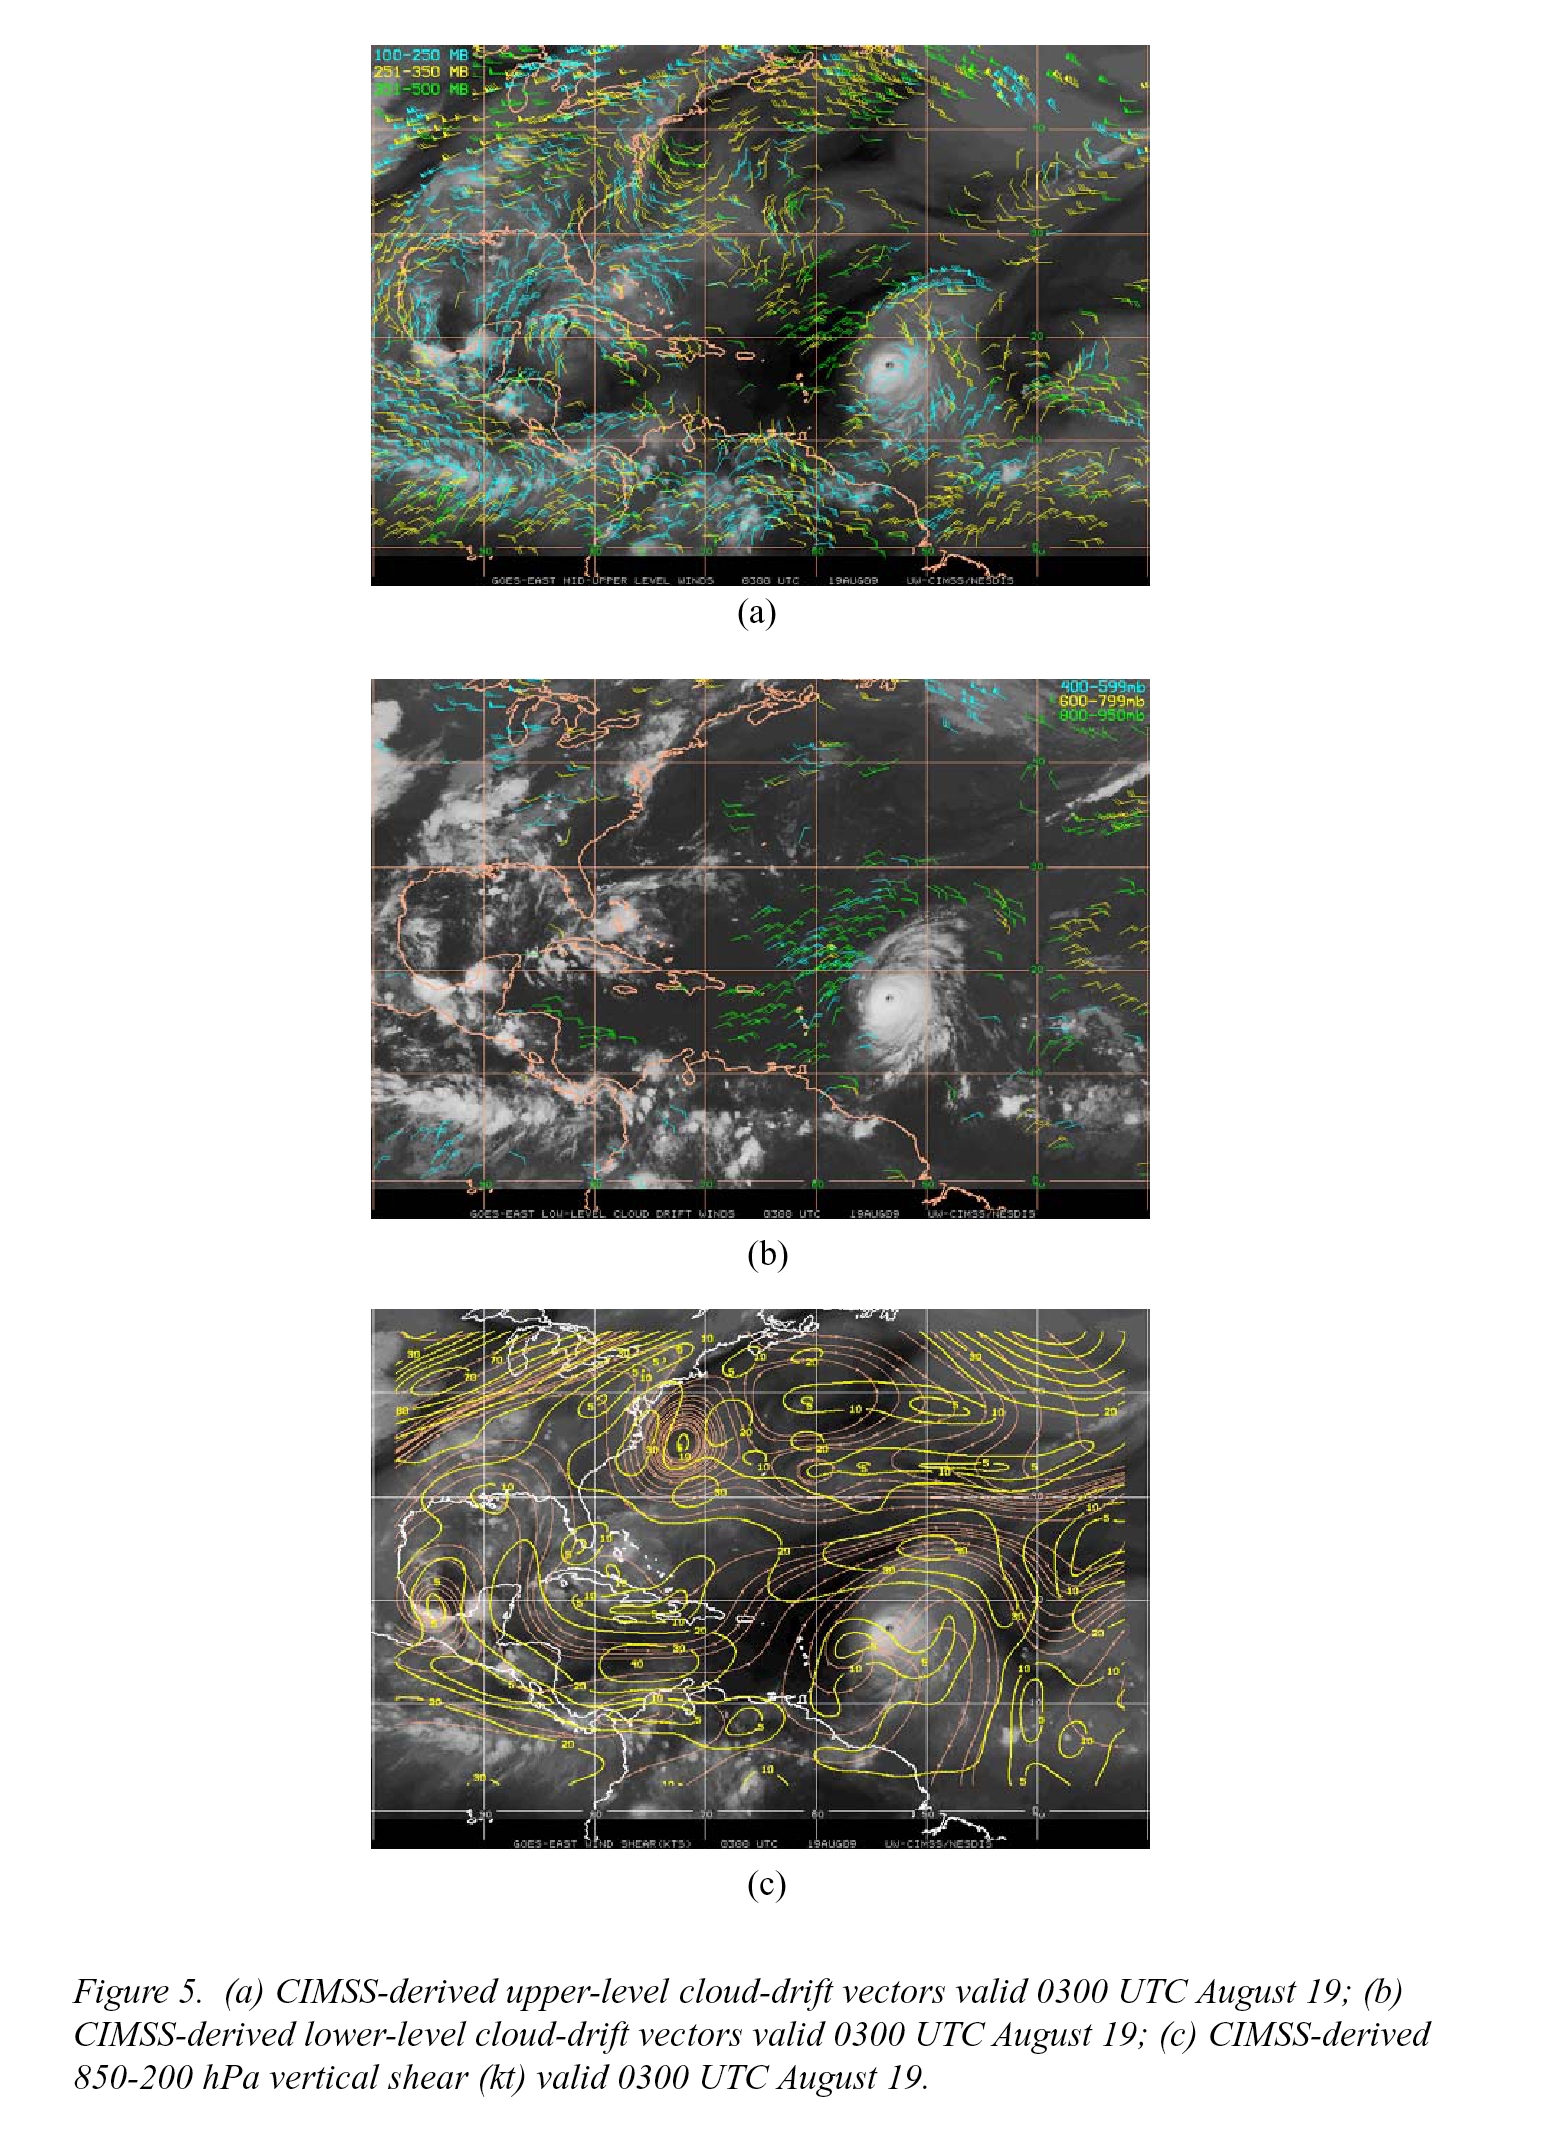
though. Eyewall precipitation was maximized on the north side (Fig. 4), which
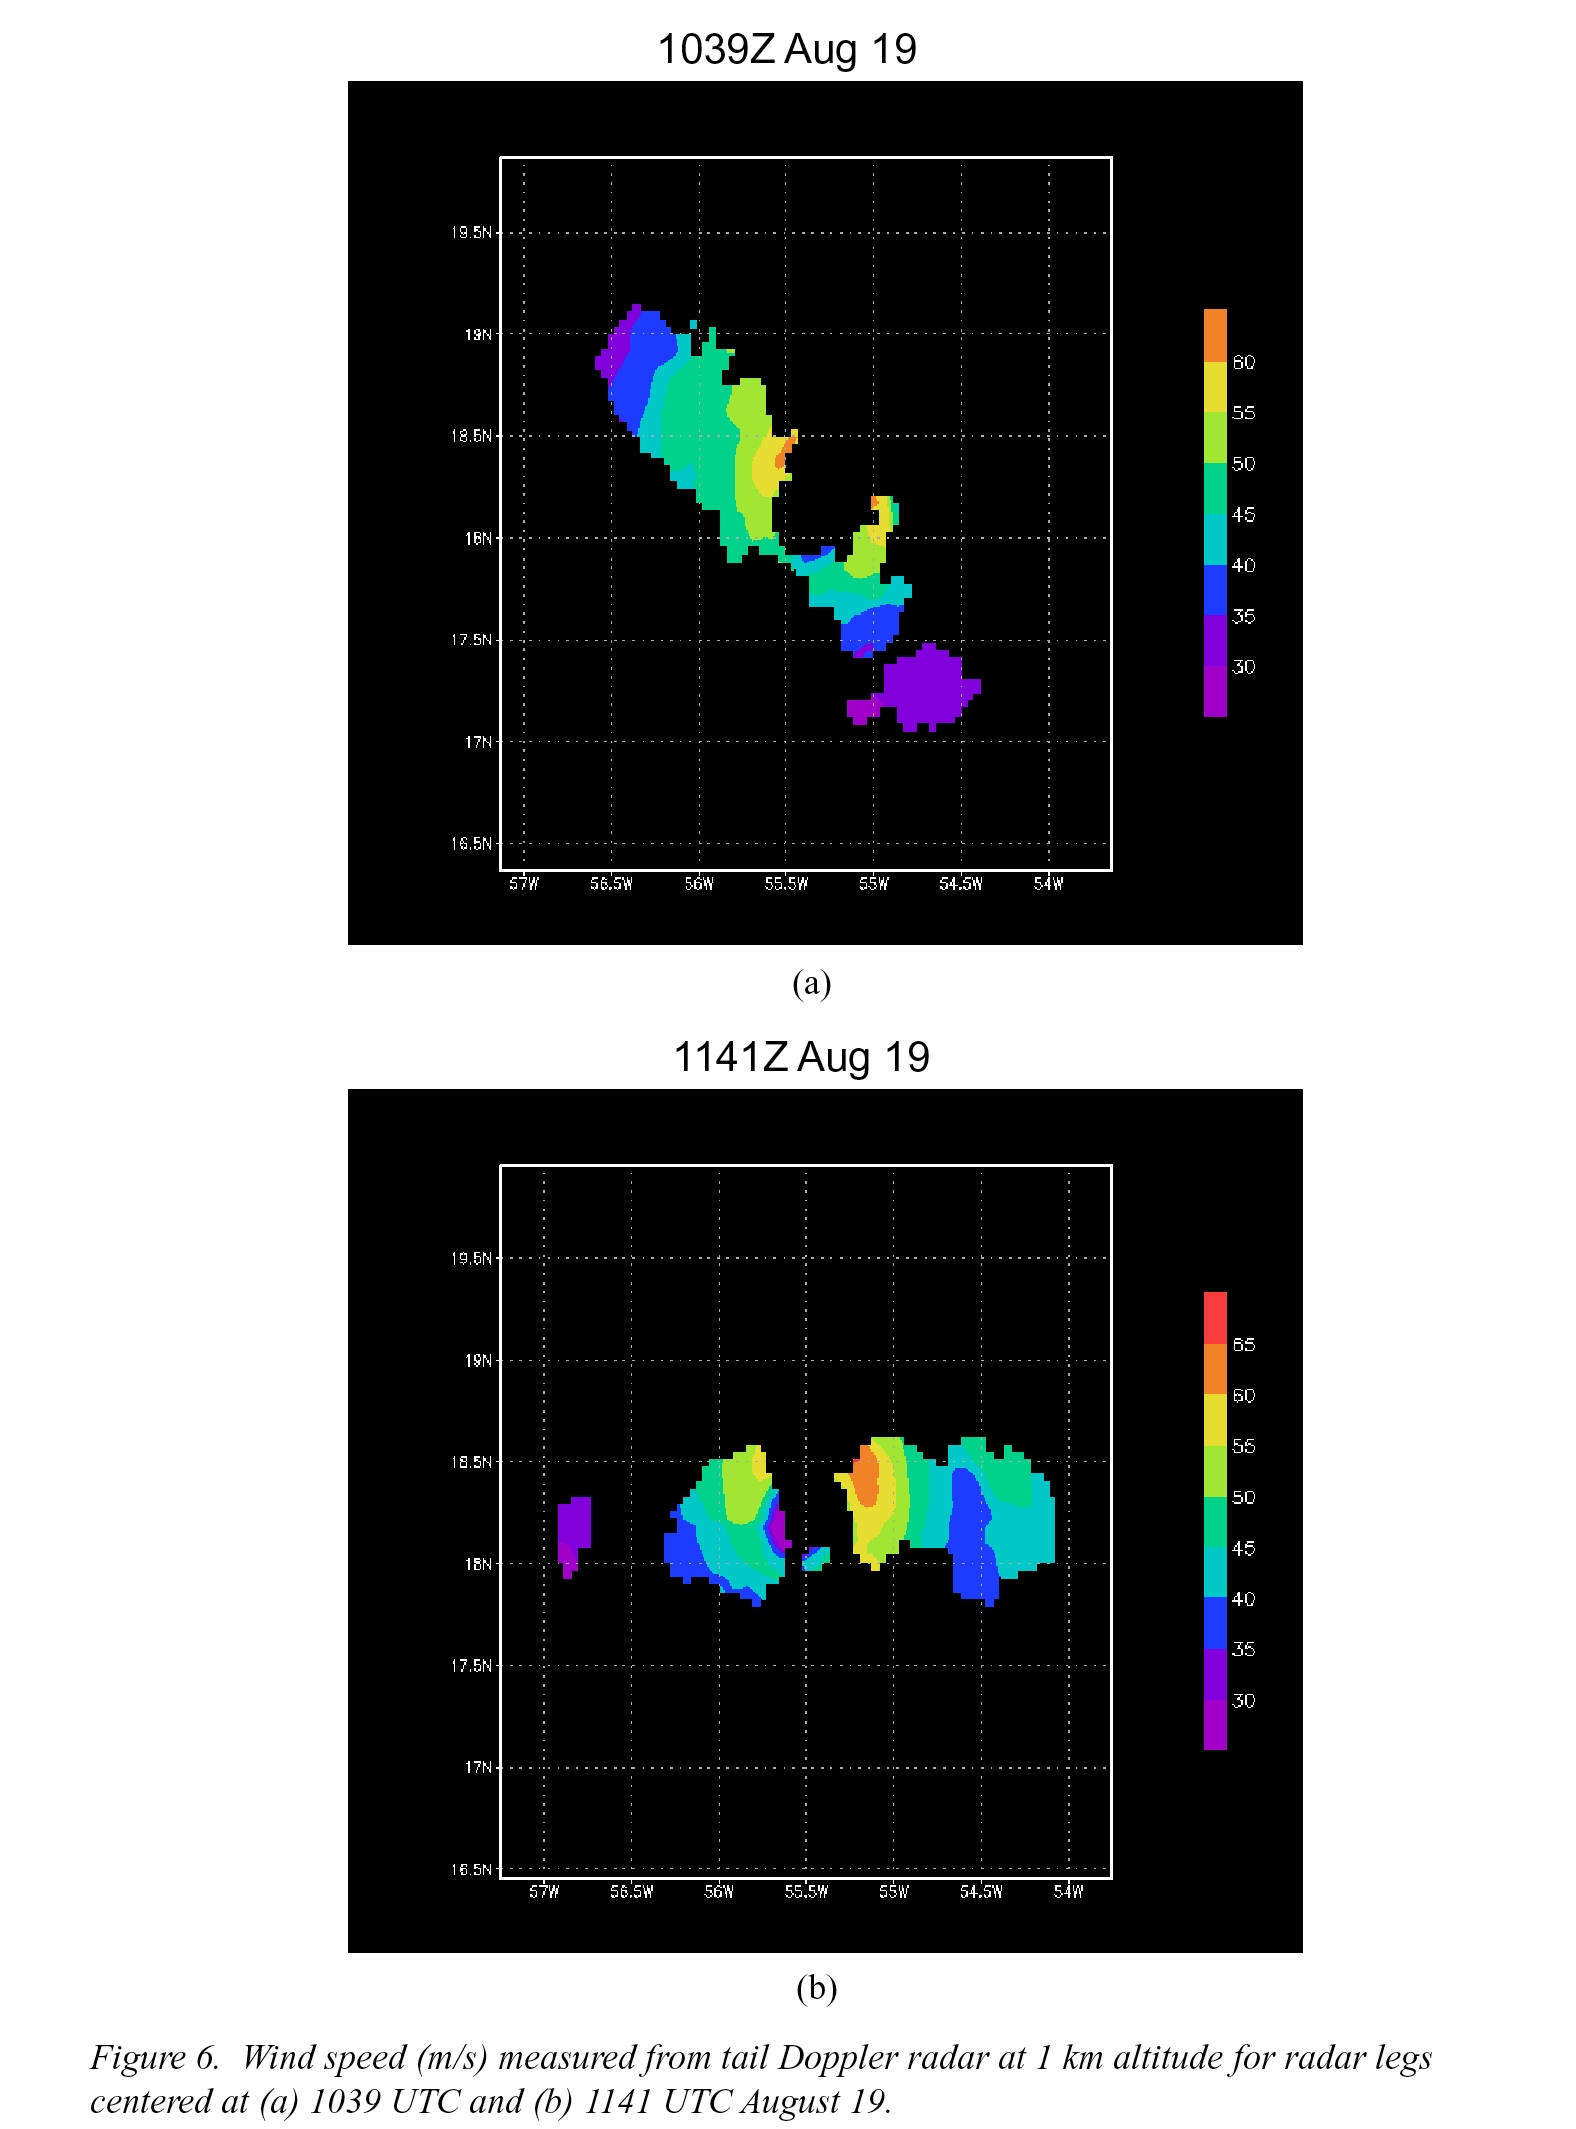
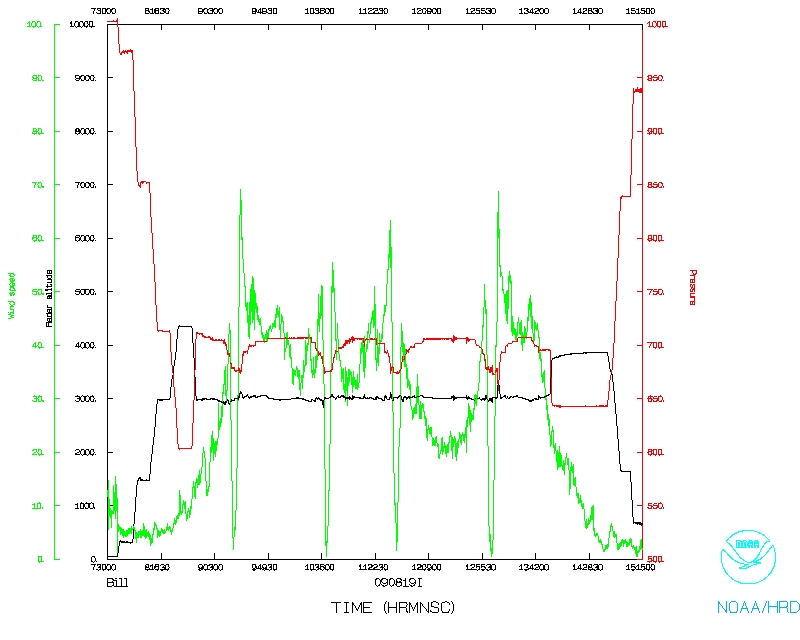
was evidence that W or SW shear was impacting storm (Fig. 5). Overall winds
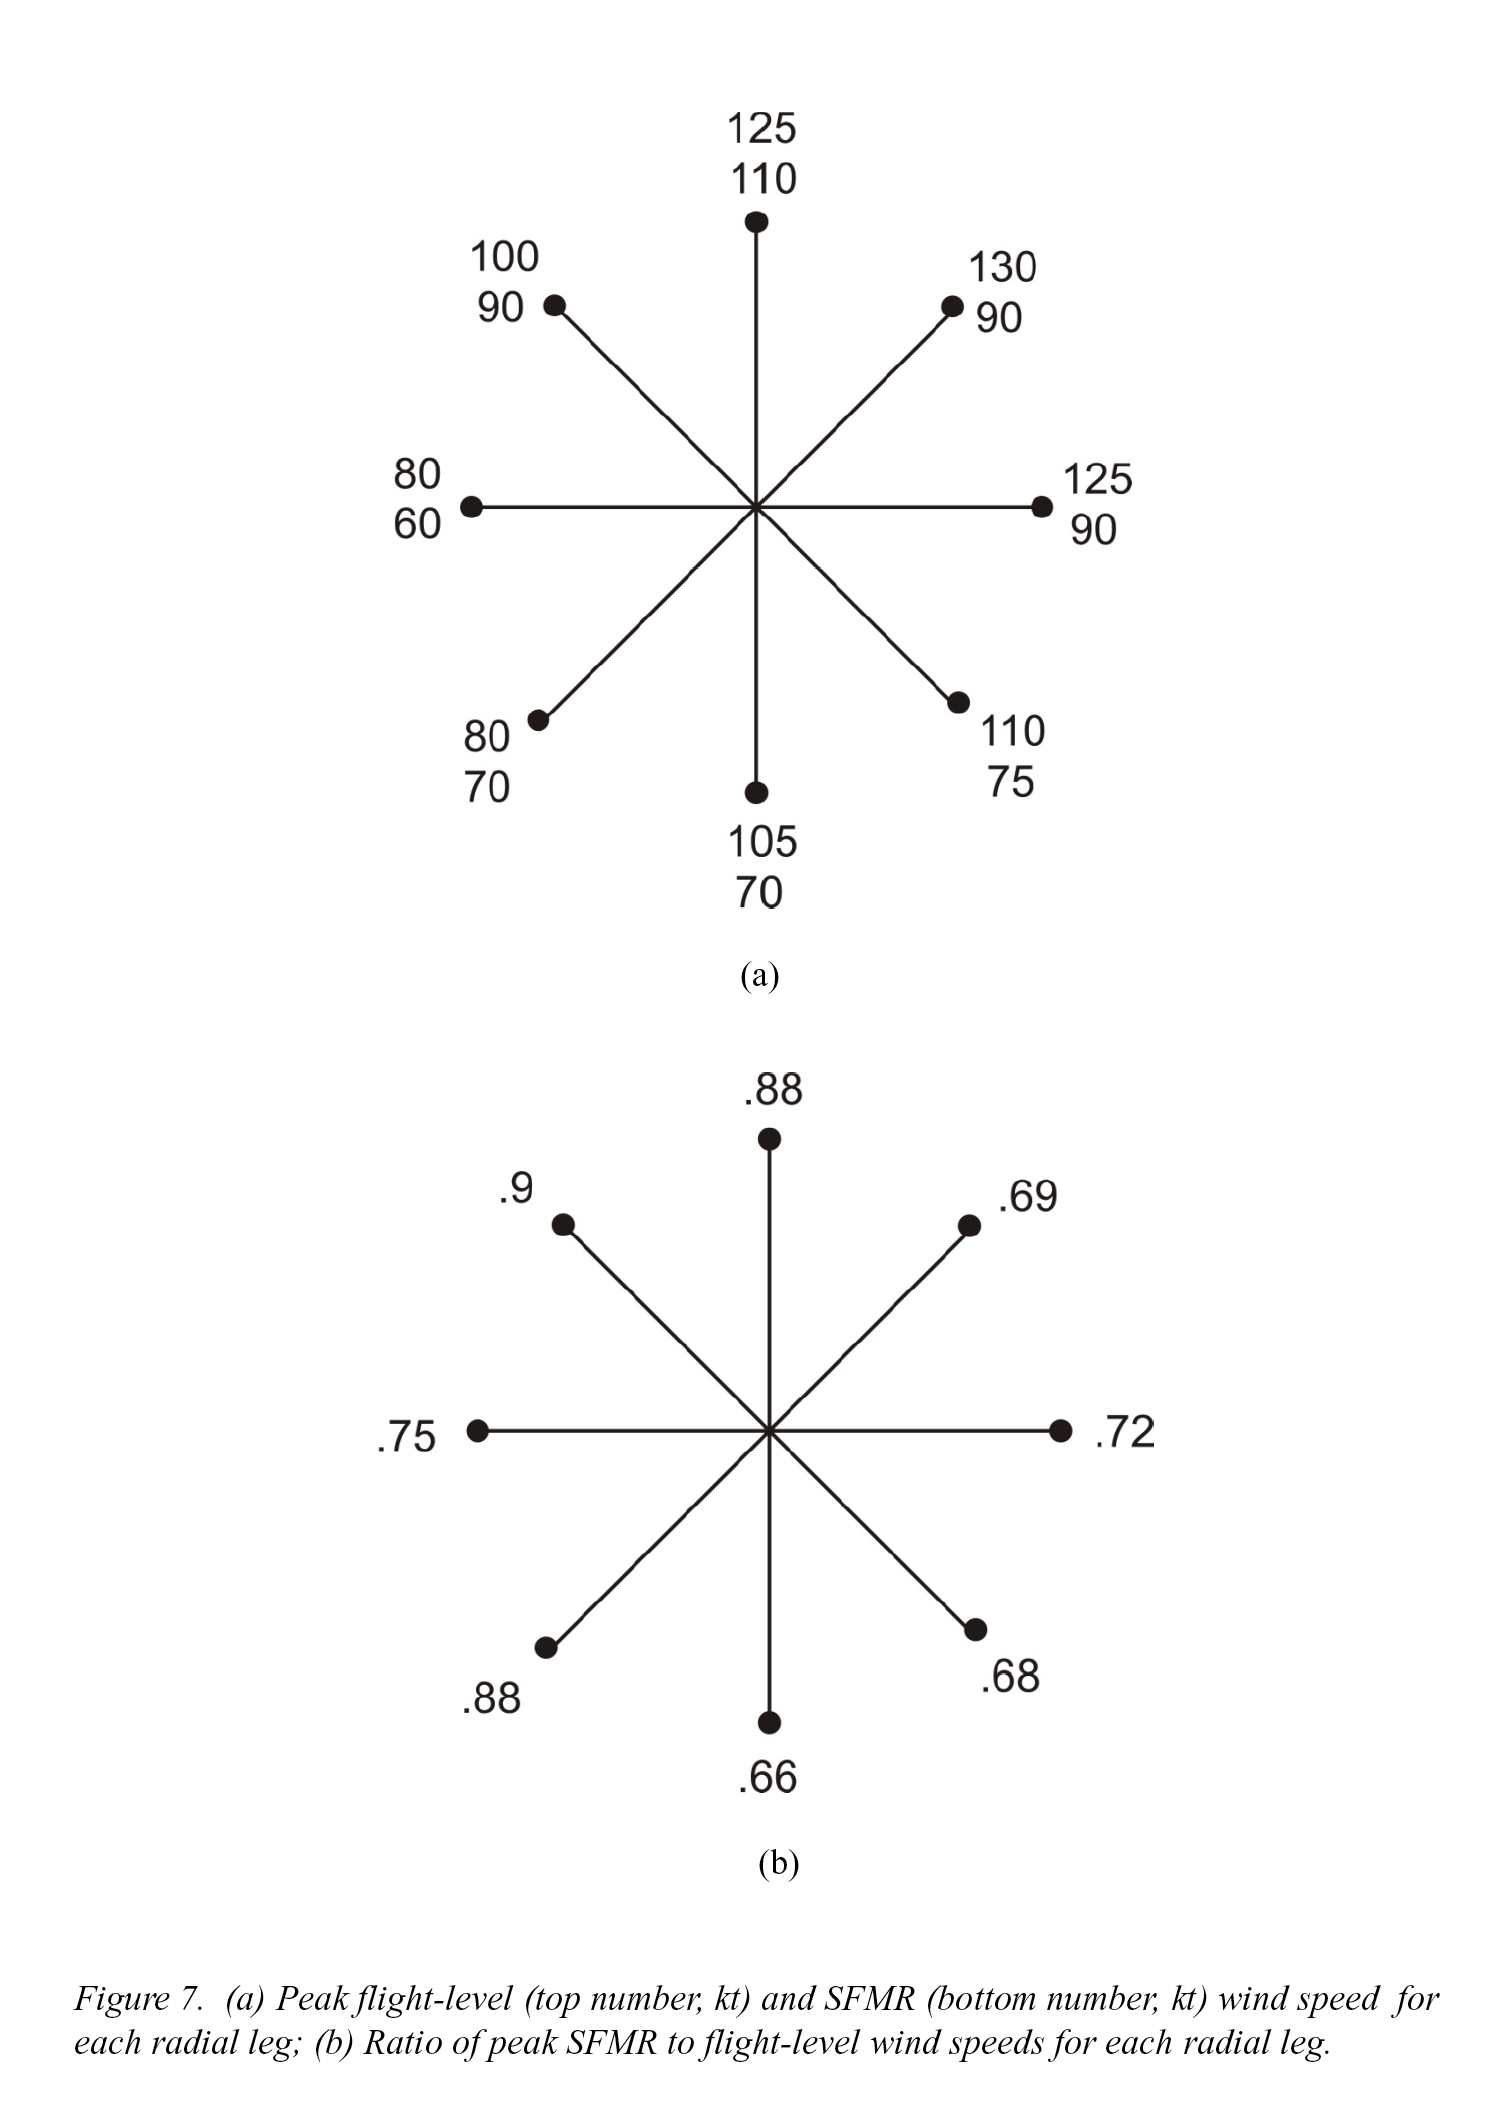
were maximized on the north and northeast sides (Fig. 6). The SFMR max winds
of 110 kt were seen in the N eyewall; max flight-level winds of 130 kt were
located in the NE eyewall. Minimum SFMR winds of 60 kt were located in the W
eyewall; minimum flight-level winds of 80 kt were located in the W and SW
eyewall (Fig. 7). As a result the ratio of peak surface to peak flight-level
winds varied around the storm, ranging from 0.68 to 0.9, with maximum values
on the west and northwest sides and minimum values on the east and southeast
sides (Fig. 7). Central dense overcast was somewhat restricted on the west
side on visible imagery, though the inner core was surrounded by cloud. On the
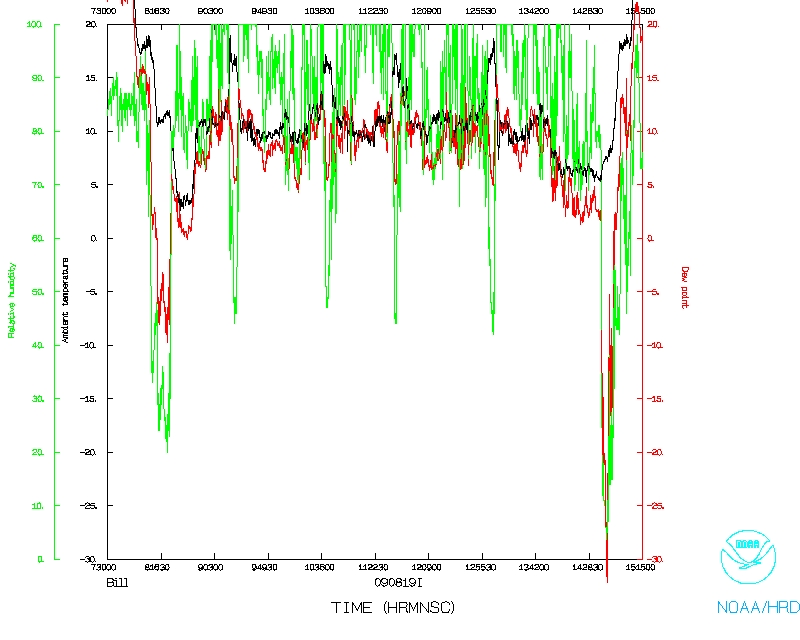
ferry to the IP flew low-level stair-step patterns to test the CAS probe. It
seemed to get some readings, especially at 10,000 ft., though I don't know how
reasonable they were. The IP was 150 nm out, but I did not see any evidence
of dry air at that radius. A total of 20 drops were released; no arc cloud
drops were released. The minimum eye pressure was 952.1 hPa. The aircraft
landed at 1517 UTC.
Mission Evaluation
The mission was generally successful. We sampled a storm that was continuing
to slowly intensify, while at the same time showing many asymmetries especially
in wind and precipitation field. We were able to get some radar analyses done,
but radar data system kept freezing, limiting the amount of data collected.
Four analyses were created, and superobs were generated and transmitted.
Problems :
The only significant problem was the radar data system that kept locking up,
limiting the amount of data available for real-time analyses. Presumably these
data can be recovered in research mode. All sondes worked well, except for
the first one, which did not get any winds.
Rob Rogers
Oct. 5, 2009
Mission Data :
LPS log
|
Misc. LPS doodles
|
Radar log
|
Drop log
Error log |
g'zipped Fast file |
NetCDF file |
1 second data
Page last updated October 13, 2009
Return to Mission page.