Mission Summary
20140803N1 Aircraft 49RF
TDR Mission Tropical Storm Bertha
Aircraft Crew (49RF)
| Aircraft Commander | Jeff Hagan
|
| Co-pilot | Kristie Twining
|
| Co-pilot | David Cowan
|
| Flight Director | Barry Damiano
|
| Dropsonde Scientist | Shannon Hefferan
|
| Electronic Technician | Gabe Defeo
|
| AVAPS Technician | Dale Carpenter
|
| Data Engineer | Alan S. Goldstein
|
| Data Engineer | Leonard Miller
|
| Crew Chief | Angel Negron
|
Scientific Crew (49RF)
| None
|
Mission Plan :
NOAA 49RF will conduct a G-IV TDR pattern around Tropical Storm Bertha, which
had maintained steady intensity during the prior 24 h period. The plan calls
for a circumnavigation TDR pattern at 1, 1.5 and 2 degrees radius from the
storm center followed by a short arc at 3 degrees radius for environmental
sampling. Dropsondes are launched at every turn point of the hexagonal pattern.
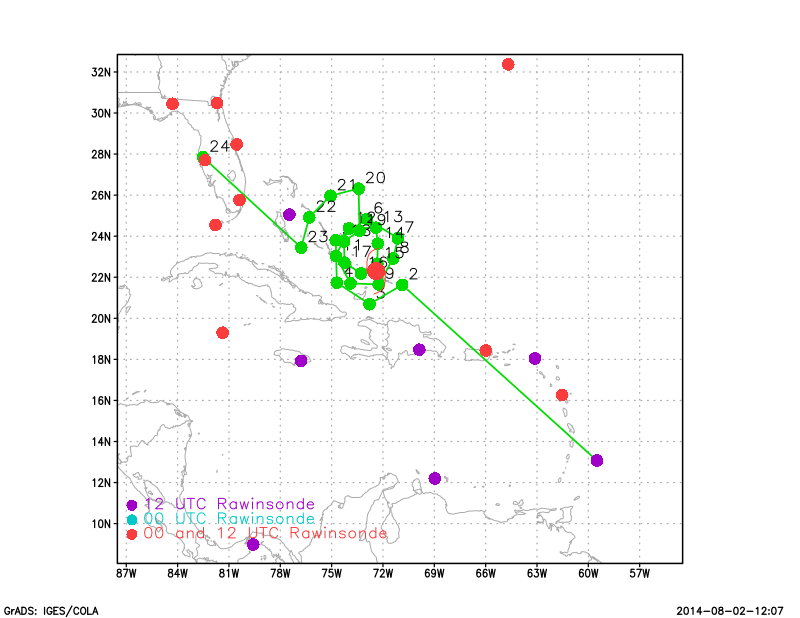
Visible satellite imagery (Fig. 1) shows the center of circulation over the
Bahamas.
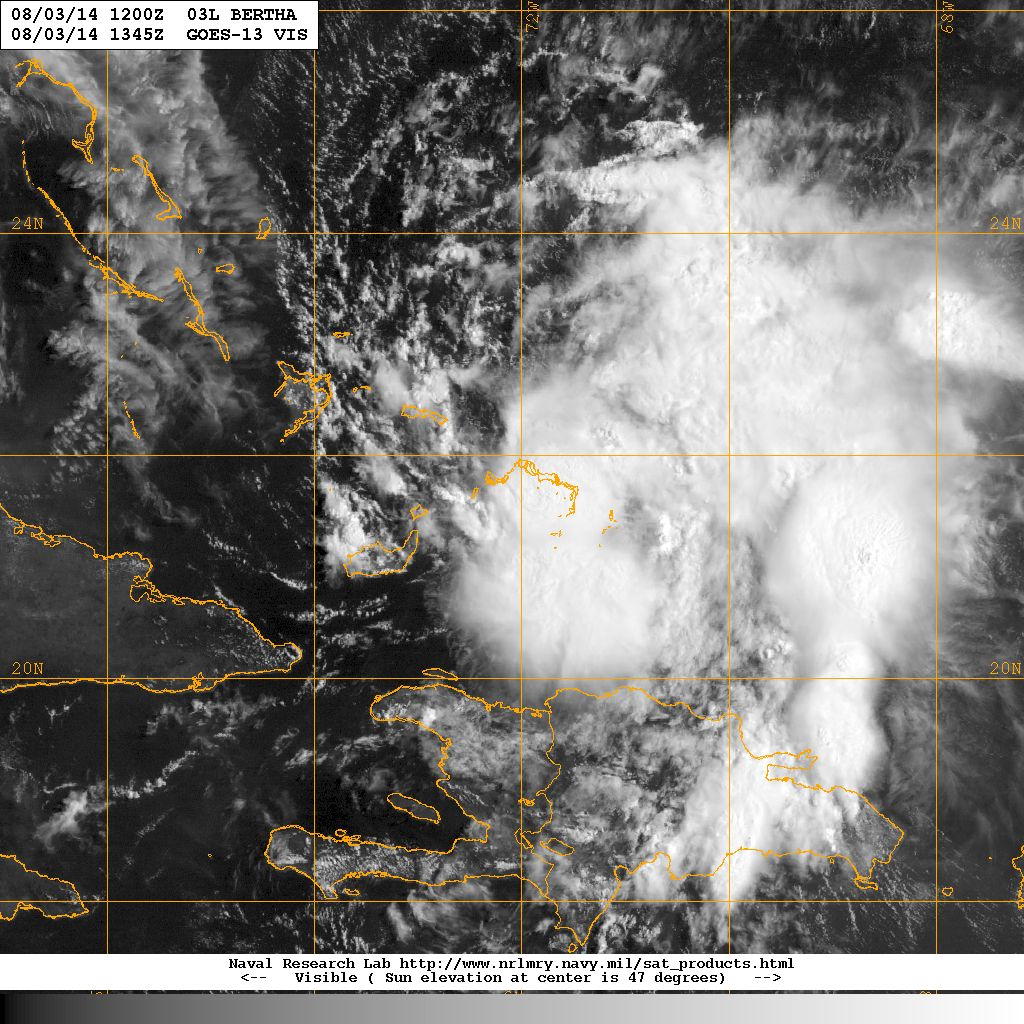
Figure 1 Visible satellite picture at 13:45 Z
|
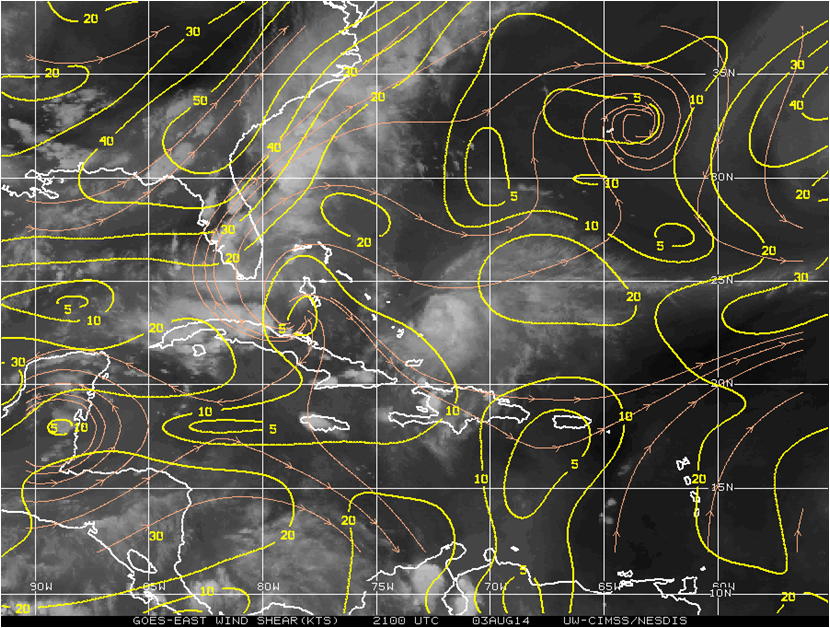
Figure 2 Vertical wind shear analysis
|
The main inhibitor of Bertha's development had been moderate westerly
environmental vertical wind shear (Fig. 2), combined with dry air on
the western side of the circulation seen in the TPW field (Fig. 3).
The G-IV will leave Barbados, BWI 1730 UTC on August 2nd and will recover back
at MacDill AFB, FL by 0100 UTC the next day.
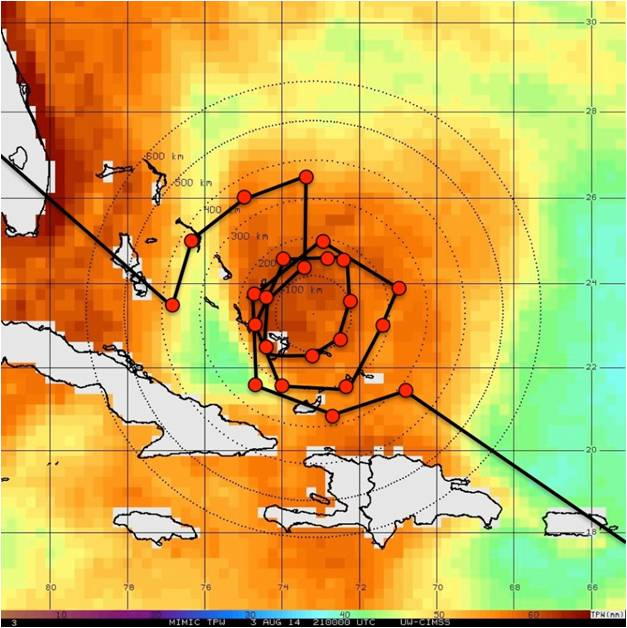
Figure 3 TPW field with proposed drops
|
TDR MISSION PLAN: Bertha
Hurricane Research Division
Augus 2, 2014 03:45 PM
Aircraft: N49RF
Proposed takeoff: 03/1730Z
|
TURN LOCATIONS
|
| #
| LAT
| LON
| RAD/AZM
| TIME
|
|
| deg min
| deg min
| nm/dg
| hr:mn
| | 2S | 21 38 | 70 53 | 120/120 | 1:55
| | 3S | 20 41 | 72 47 | 120/180 | 2:12
| | 4S | 21 44 | 74 42 | 120/240 | 2:30
| | 5S | 23 48 | 74 46 | 120/300 | 2:48
| | 6S | 24 50 | 72 57 | 120/360 | 3:05
| | 7S | 23 54 | 71 07 | 120/060 | 3:21
| | 8S | 22 55 | 71 24 | 90/090 | 3:31
| | 9S | 21 39 | 72 15 | 90/150 | 3:44
| | 10S | 21 42 | 73 54 | 90/210 | 3:57
| | 11S | 23 02 | 74 45 | 90/270 | 4:11
| | 12S | 24 23 | 73 59 | 90/330 | 4:24
| | 13S | 24 25 | 72 25 | 90/030 | 4:37
| | 14S | 23 38 | 72 18 | 60/060 | 4:44
| | 15S | 22 40 | 72 20 | 60/120 | 4:54
| | 16S | 22 11 | 73 17 | 60/180 | 5:03
| | 17S | 22 43 | 74 15 | 60/240 | 5:12
| | 18S | 23 45 | 74 17 | 60/300 | 5:22
| | 19S | 24 16 | 73 22 | 60/360 | 5:30
| | 20S | 26 19 | 73 25 | 180/360 | 5:48
| | 21S | 25 58 | 75 04 | 180/330 | 6:02
| | 22S | 24 55 | 76 18 | 180/300 | 6:15
| | 23S | 23 27 | 76 47 | 180/270 | 6:29
| |
Mission Summary :
| Take off
| Landing
| Barbados, BWI | 17:15 UTC
| MacDill AFB, FL | 00:25 UTC
| |
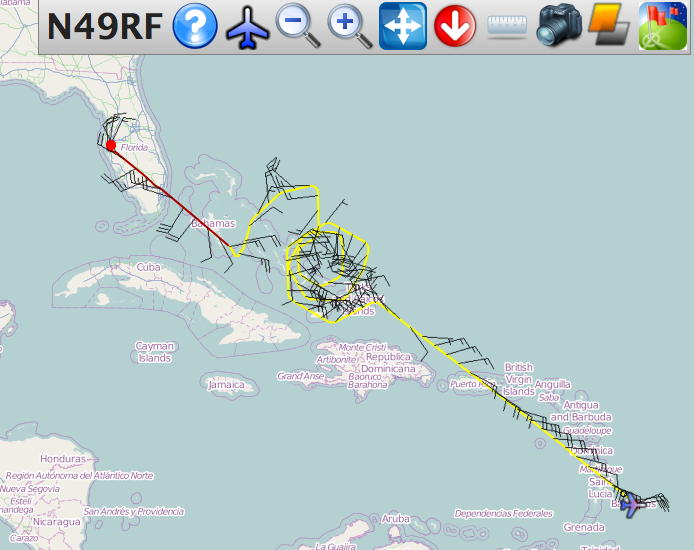
The actual flight track is shown in Fig. 4. Takeoff was at 1715 UTC from
Barbados. The aircraft landed in Tampa at 0025 UTC.
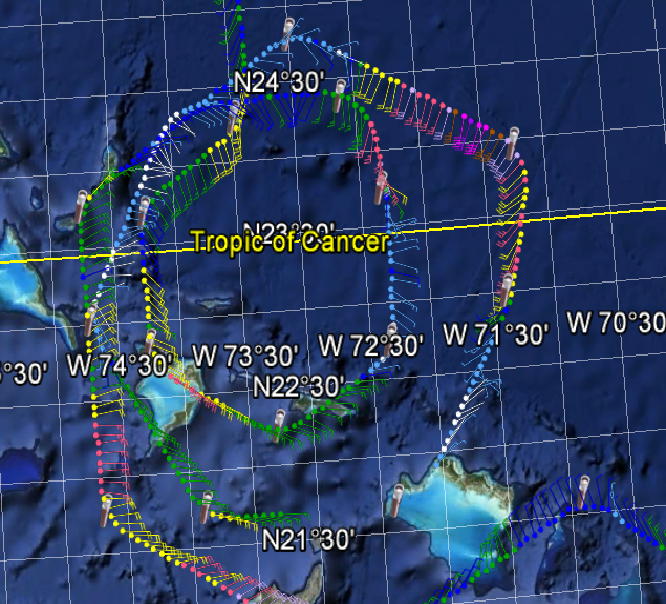
Figure 4 Actual flight track
|
Mission Evaluation :
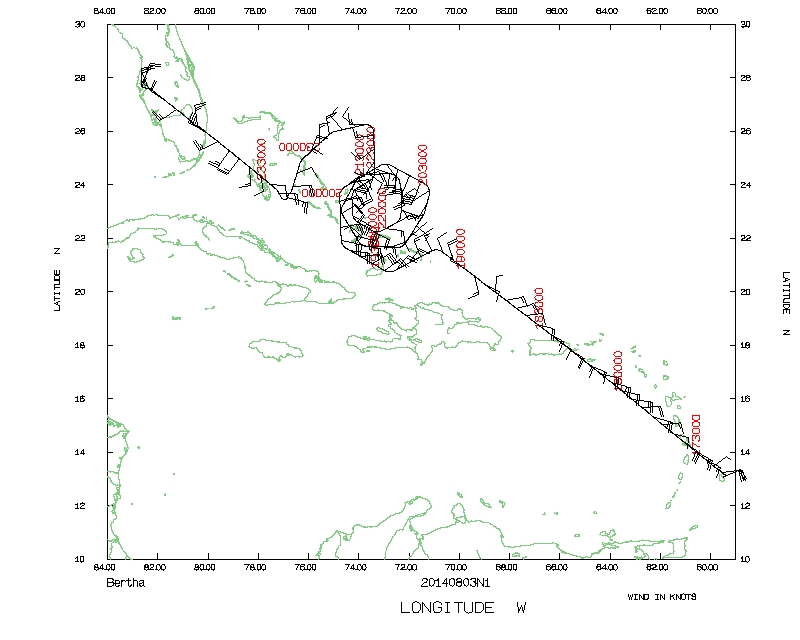
A total of two radar analyses were created and transmitted in real time. A
composite of these two analyses is shown in Fig. 5 at 2-km altitude. The
strongest winds are located on the eastern side of the storm. A total of 23
dropsondes were processed. A period of rapid intensification began shortly
after this mission.

Figure 5 Composited Doppler wind and drop analysis
|
Problems :
No problems with the data collection systems were noted.
Paul Reasor
Nov. 26, 2014
Mission Data :
Flight Director's log |
Flight Director's form |
serial data |
NetCDF file |
One second file
Page last updated March 24, 2015
Return to Mission page.