 |
 |
| Aircraft Commander | Scott Price |
| Co-pilot | Nate Kahn |
| Co-pilot | Adam Abitbol |
| Flight Engineer | Paul Darby |
| Flight Engineer | Chris Lalonde |
| Navigator | Todd Richards |
| Flight Director | Mike Holmes |
| Flight Director | Carpenter |
| System Engineer | Hartberger |
| Data Technician | Mike Mascaro |
| Data Technician | Warnecke |
| LPS | Rob Rogers | HRD |
| Dropsonde | Kaythryn Sellwood | HRD |
| Radar | Paul Reasor | HRD |
| Radar | Jon Zawislak | HRD |
| Guest | Jonathan Shannon |
| Radar | Nancy Griffin | HRD |
Mission Plan :
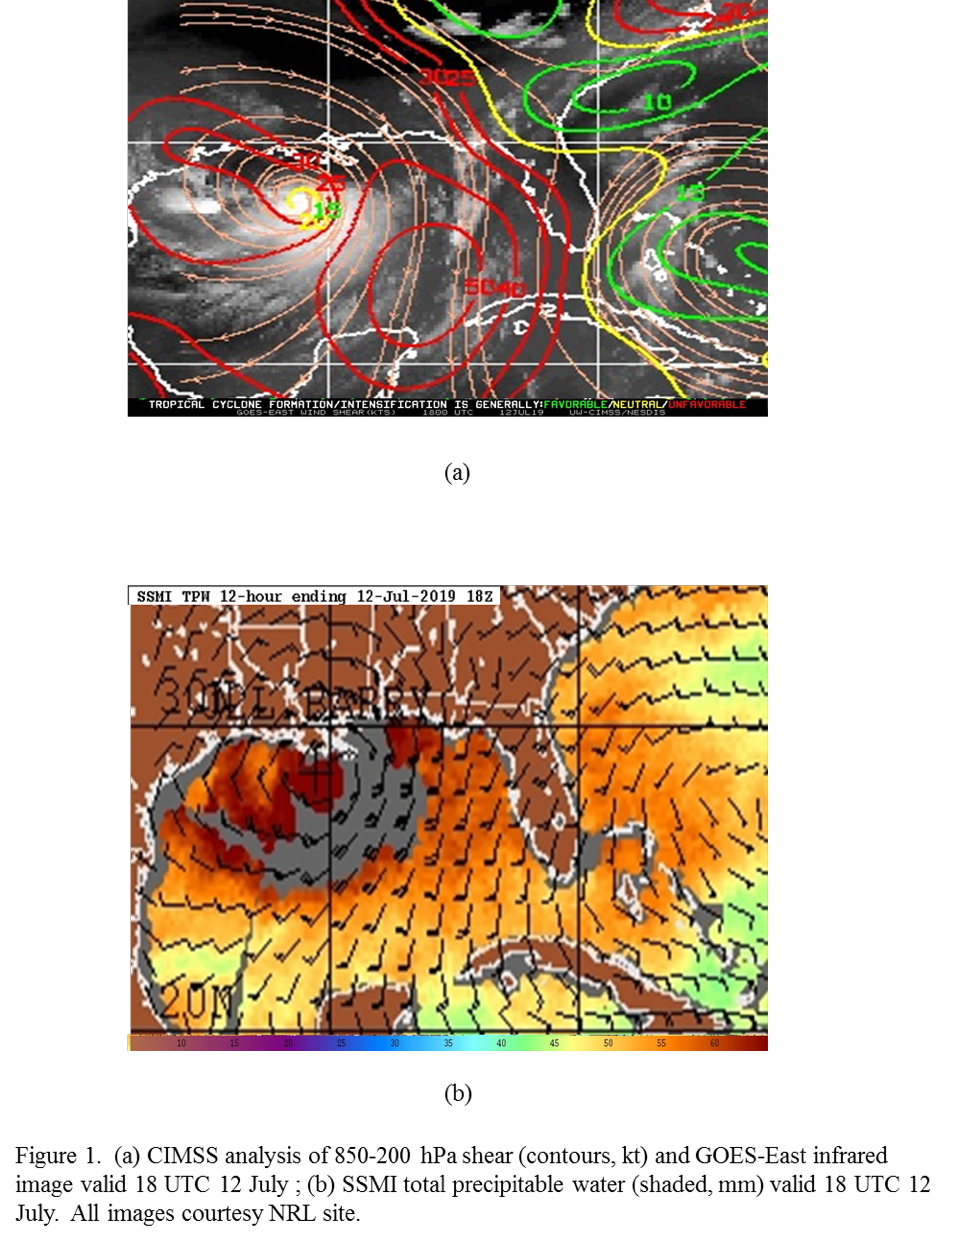
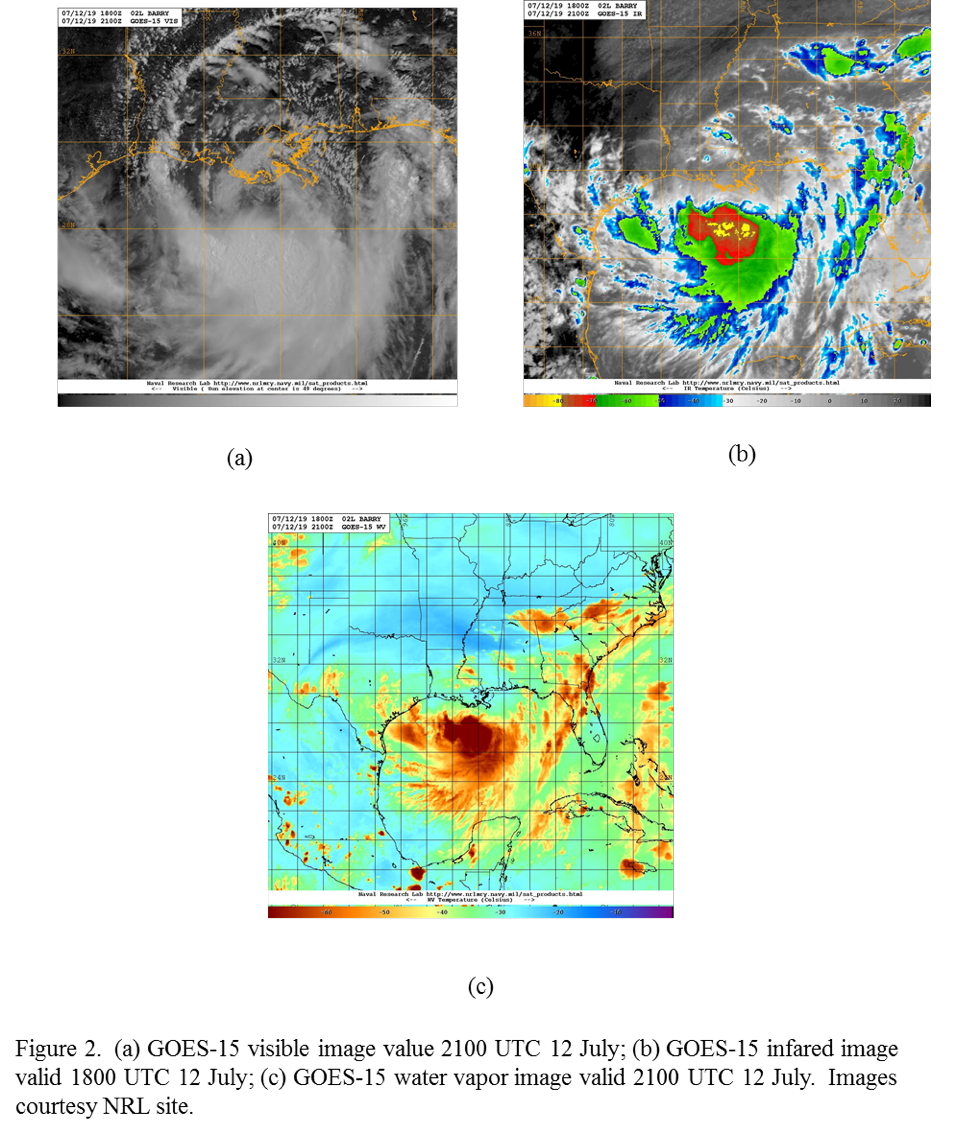
NOAA 42RF (N42) will Conduct EMC-tasked TDR mission into TS Barry, which is now a 55-kt tropical storm. Barry continues to be asymmetric, with almost all the convection on the south side of the circulation. There have been some episodes of strong convection appearing near the low-level center, but the northerly shear has actually strengthened to 25-30 kt nearly everywhere and a moist lower troposphere in the vicinity of the circulation (Fig. 1). The convection then wanes and low-level circulations propagate away, similar to what was seen 24 h before. Barry is a large circulation, with the strongest winds on the southeast side. The Air Force recently found 70 kt winds at flight level, and NHC found that the central pressure was 993 hPa shortly before takeoff. There is some potential for downshear reformation, but the circulation is slowly moving toward the northwest, so its time over water is limited. Satellite imagery (Fig. 2) shows that convection and cold cloud tops remain confined to the south of the circulation, as mentioned above. There is a sharp gradient in cloud-top temperature in the infrared, indicative of the strong northerly shear evident in Fig. 1. Dry mid- and upper-level air remains apparent in the northern Gulf in water vapor imagery in Fig. 2c.
|
|
|
The plan calls for flying a butterfly pattern (Fig. 3) with the initial point on the north side. Fly outbound 120 nm to the south to better sample the convection concentrated there. Drop sondes at all turn and mid-points, and the center point. Fly at 10,000 ft for most of the mission, except for the final west-east pass, where the aircraft will try to climb to 20,000 ft. After the pattern is complete, attempt to fly an offshore intense convection module, and possibly an SFMR module on the first southwest leg. If there is a possibility, also try a convective burst module.
 |
 |
|
Prepared by the Hurricane Research Division July 10, 2019 Aircraft: N42RF Proposed takeoff: 11/0800Z
DROP LOCATION TABLE
| #
| LAT
| LON
| RAD/AZM
| Time
|
| deg min
| deg min
| n mi/deg
| hr:min
| 1S | 30 03 | 90 12 | 90/030 | 1:23
| 2S | 27 01 | 92 10 | 120/210 | 2:16
| 3S | 27 01 | 89 56 | 120/150 | 2:47
| 4S | 30 03 | 91 54 | 90/330 | 3:40
| 5S | 28 45 | 93 03 | 105/270 | 4:05
| 6S | 28 45 | 89 03 | 105/090 | 4:59
| | ||||||||||||||
Mission Summary :
| Take off | Landing
| Linder-Lakeland Airport, FL
| 19:49 UTC
| Linder-Lakeland Airport, FL
| 02:49 UTC
| | ||
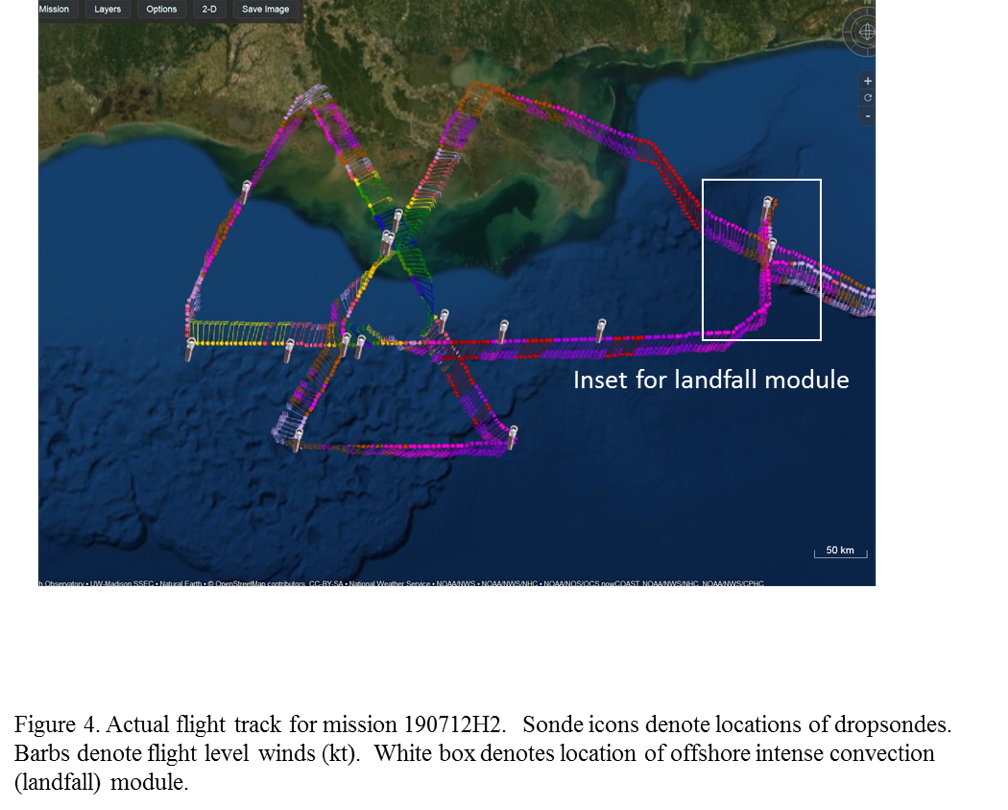
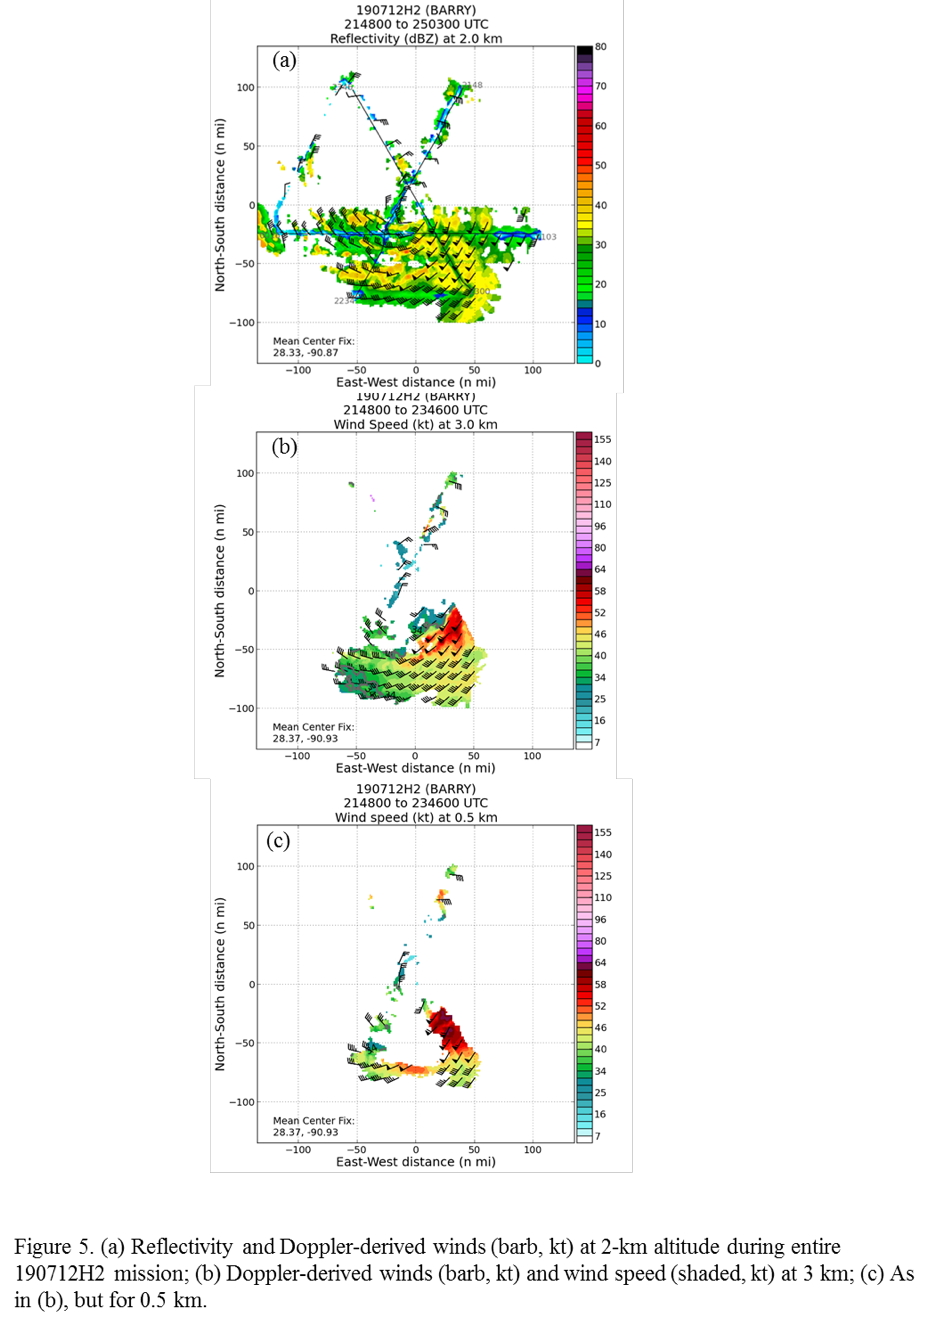
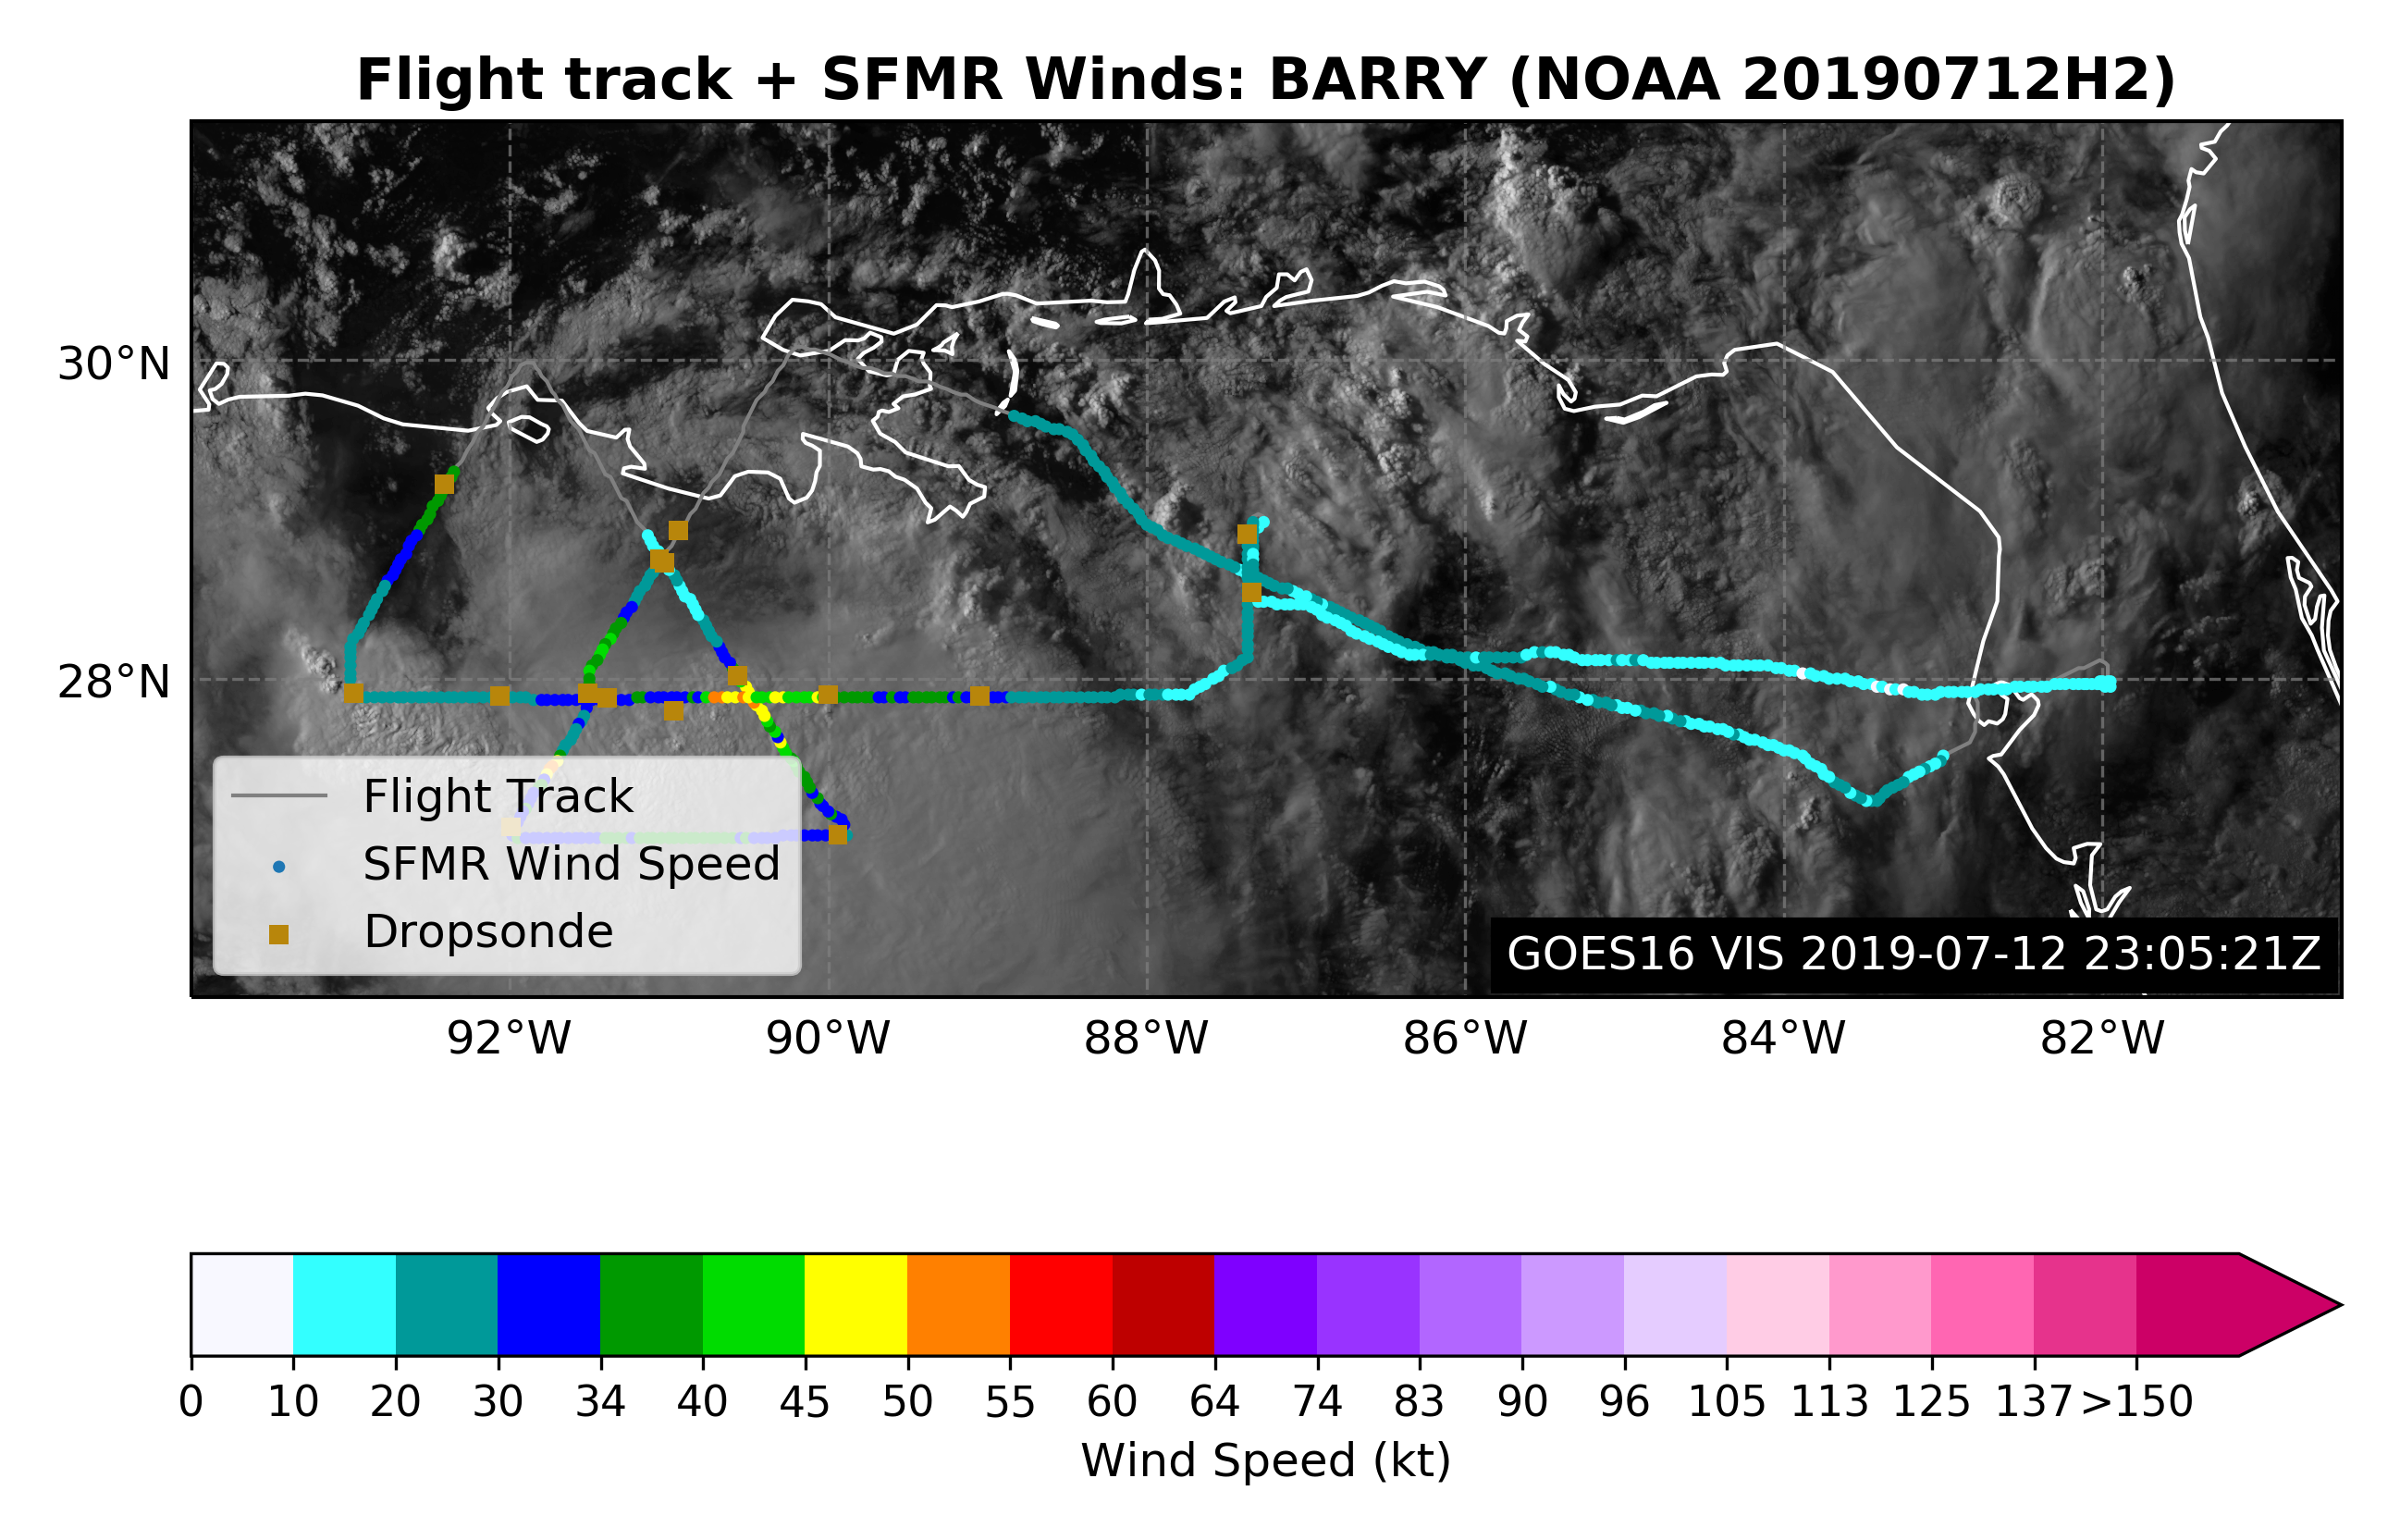
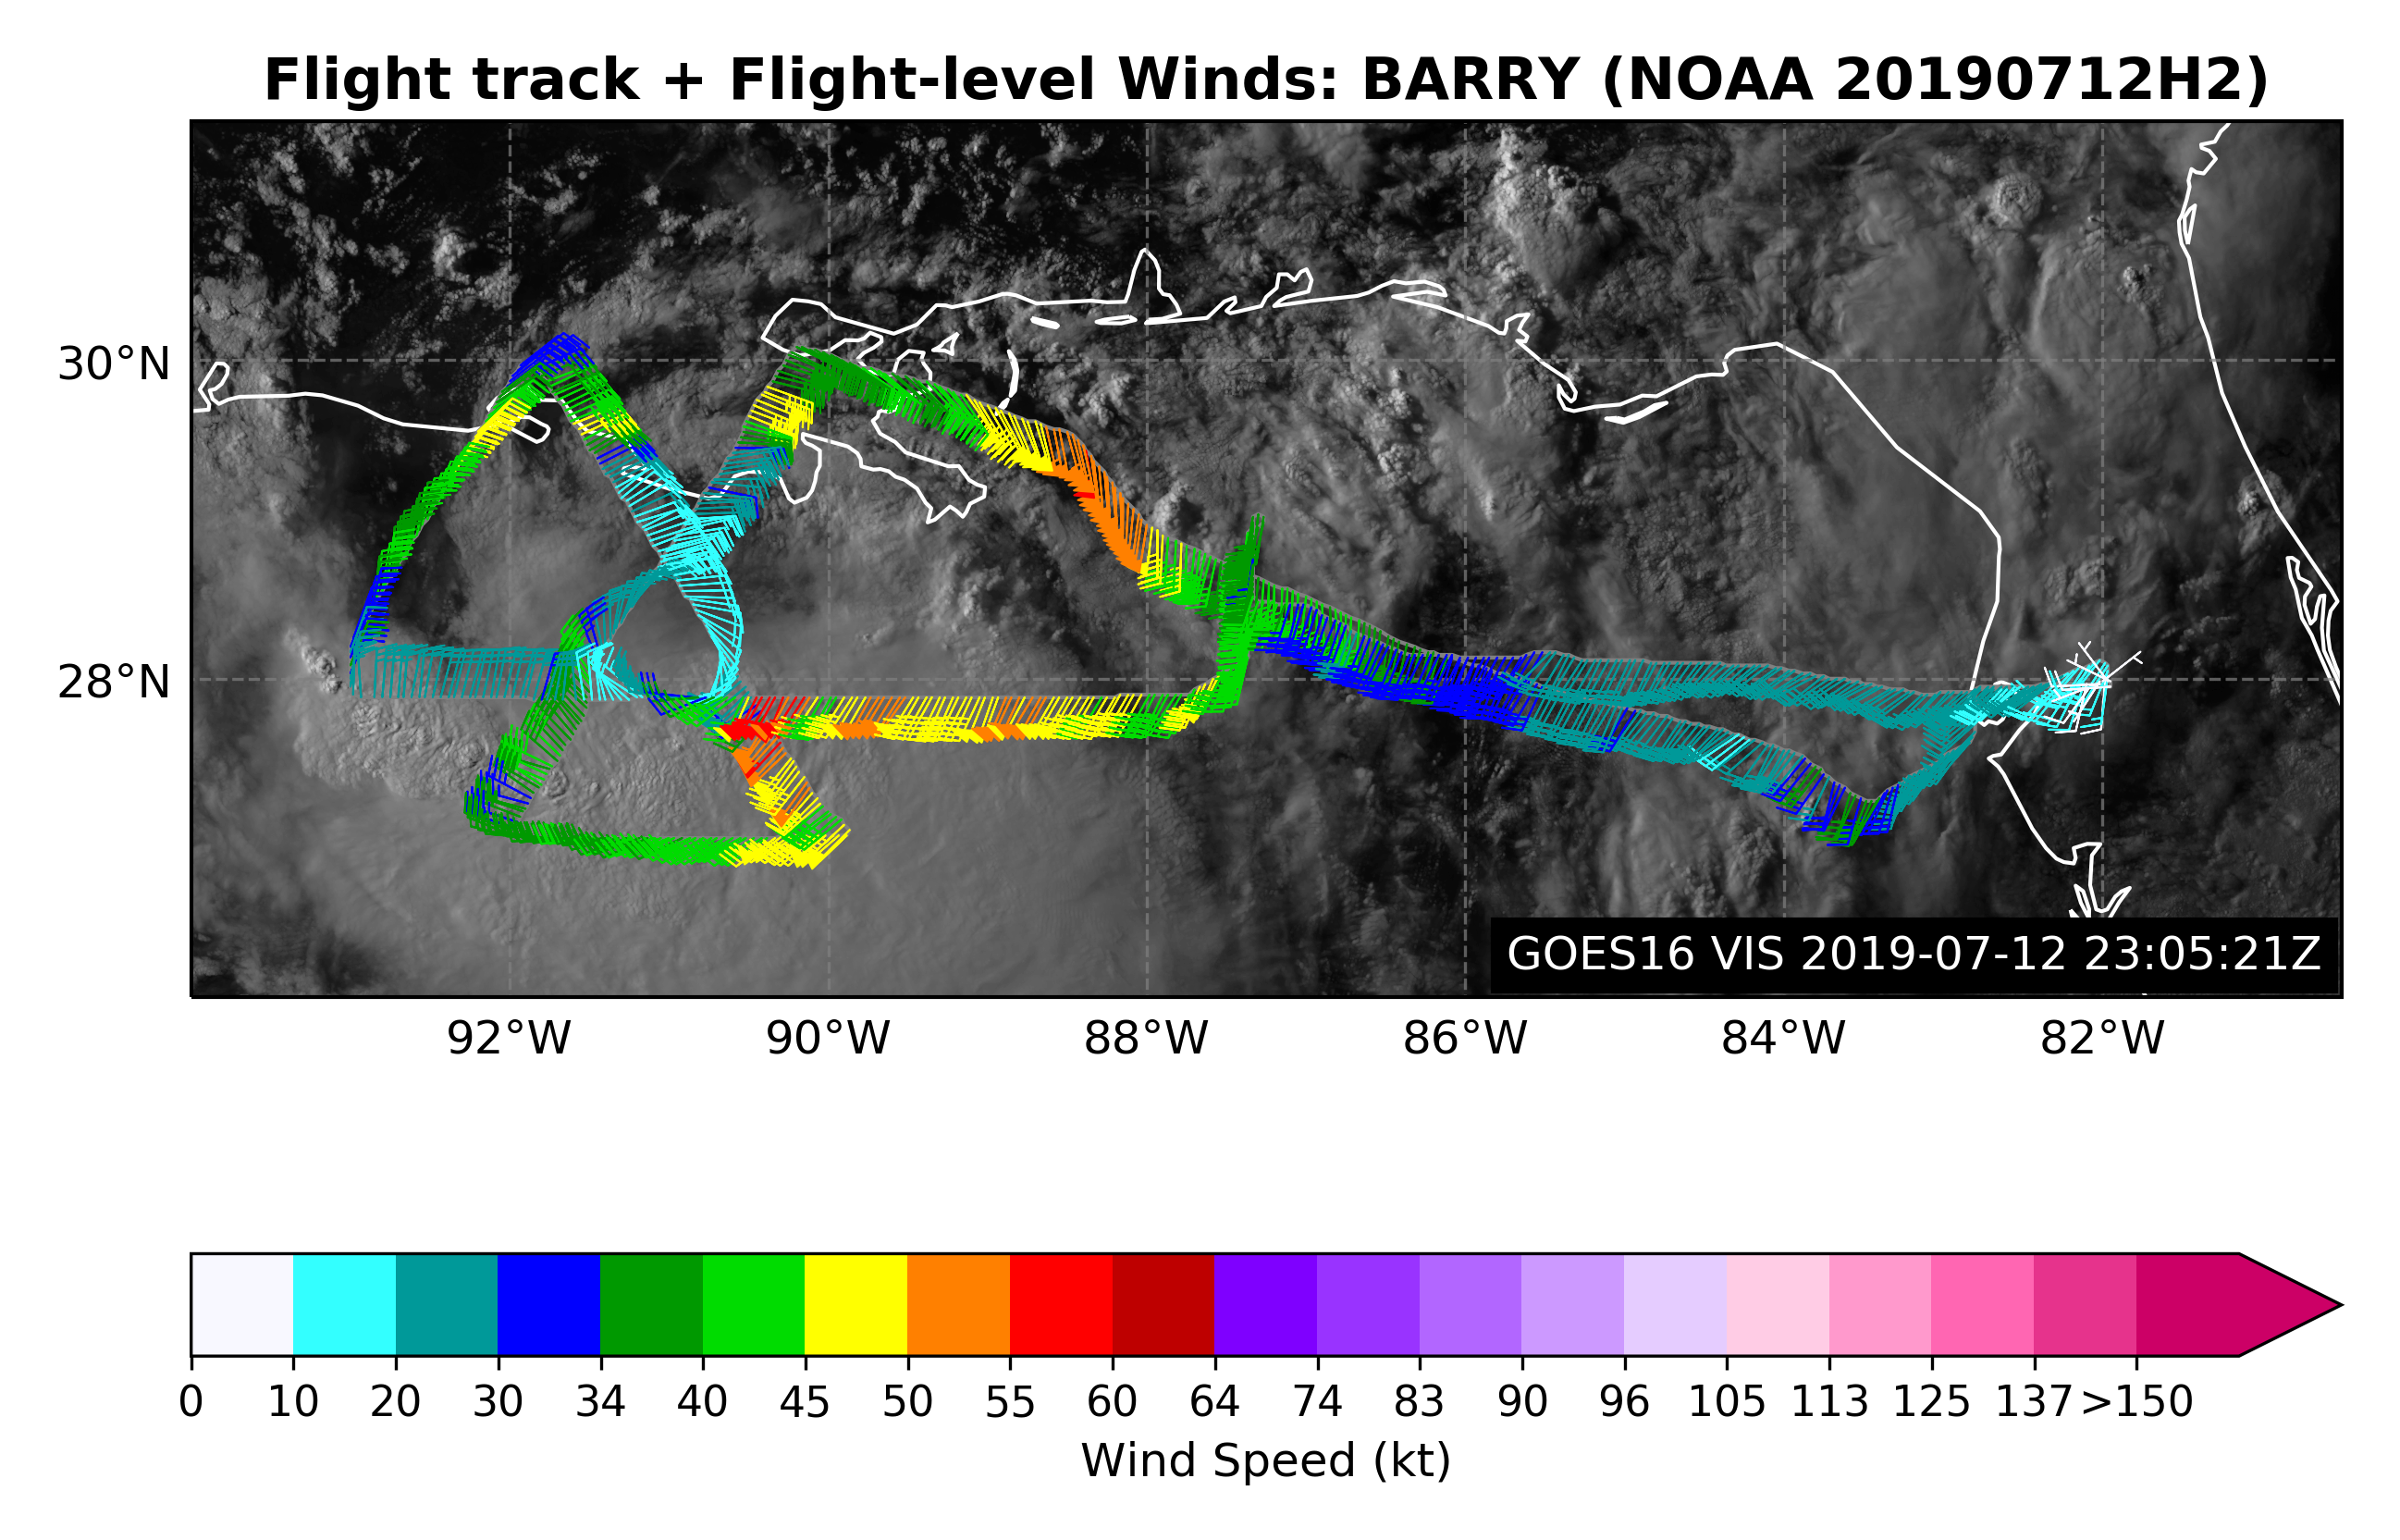
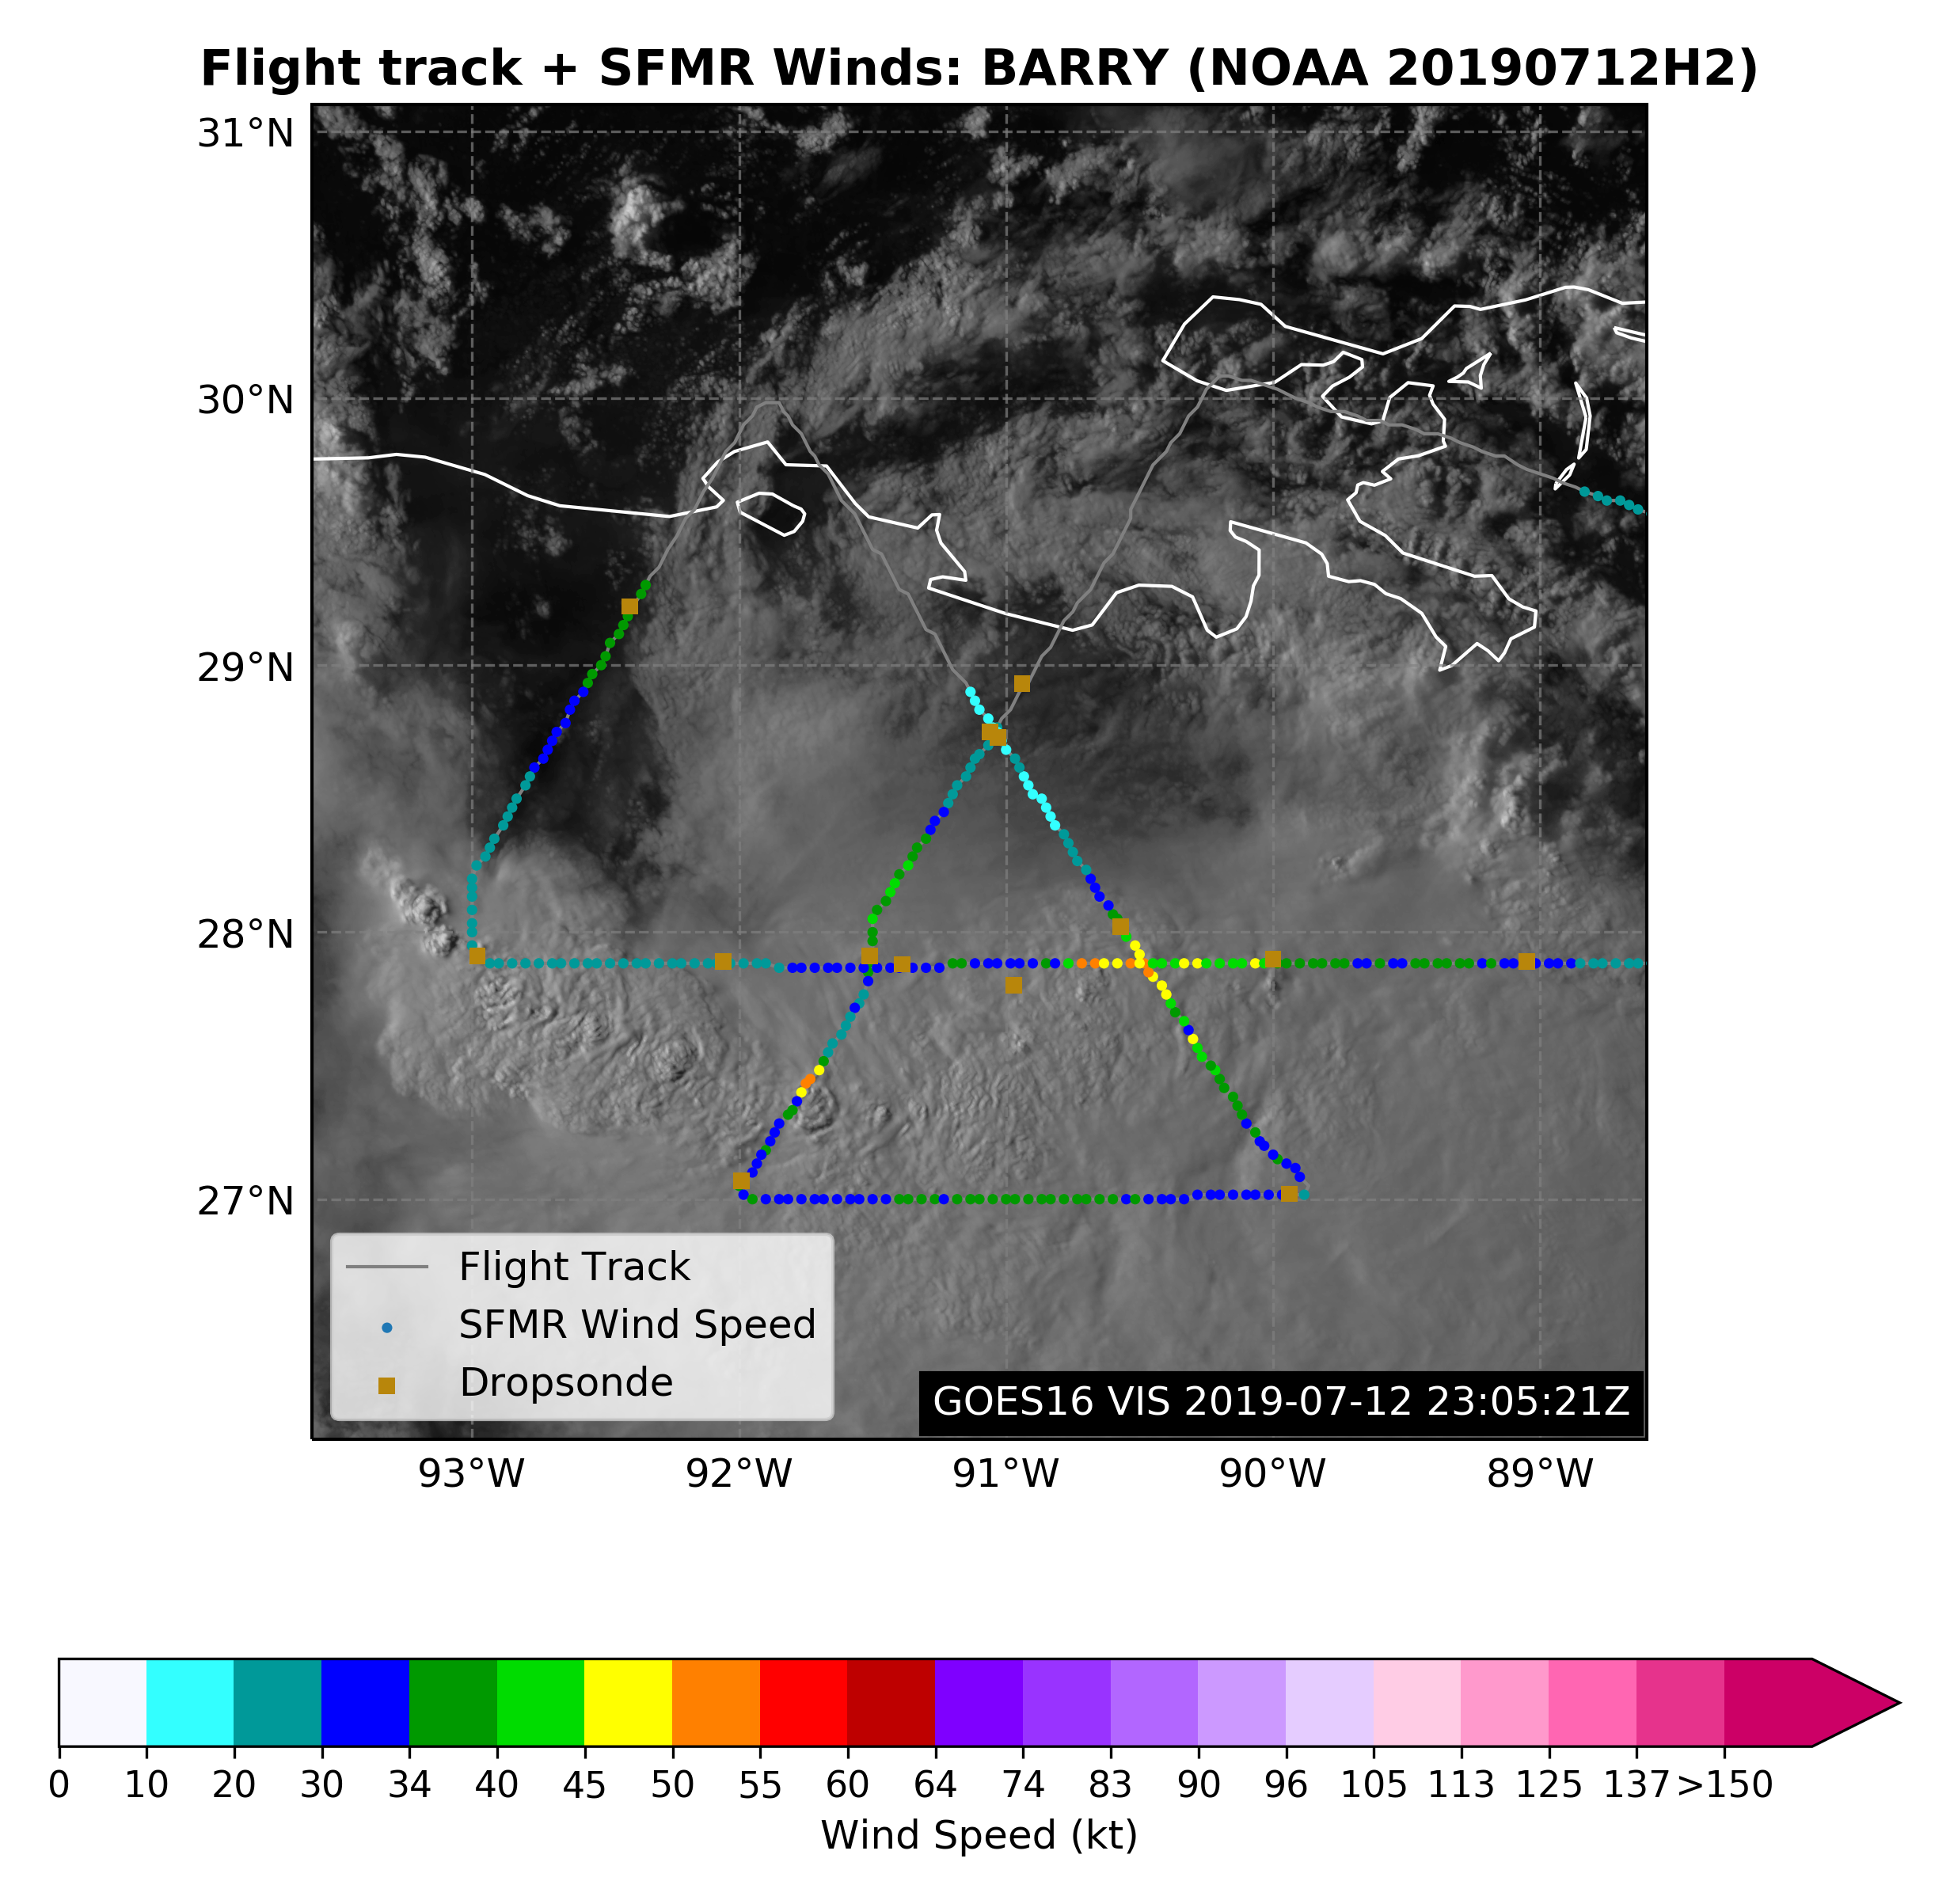
The mission was flown mostly as planned (Fig. 4). The aircraft took off at 1949 UTC. The legs were extended to 120 nm on the south side to better capture the band of precipitation evident on satellite (cf. Fig. 2). Two sondes were dropped on the first northeast-southwest leg where the aircraft was emerging offshore for the SFMR shoaling module (see location of two near-coincident drops in Fig. 4). On the final west-east leg the aircraft climbed to 20,000 ft on the west side for better dropsonde coverage in the vertical. The radial leg was shifted to the south to try to sample the band on the south side. On the west side of the band, the aircraft was too far north for good sampling, but as the east side was approached the aircraft passed through the band. The band did show a nice along-band variation from convective upwind to stratiform downwind (Fig. 5). The low-level and midlevel circulation centers appeared to be coming into a better alignment, and the low-level circulation may have been consolidating some. Wind speeds from the radar analysis showed 65 kt winds on the southeast side. Reflectivity on the southeast side of the circulation was greater than 40 dBZ below 4-km altitude, suggestive of localized regions of heavy rainfall (Fig. 6). There were echo tops of ~16 km ~50 nm from the center of the profile, suggestive of moderate and deep convection, and a clear bright banding structure radially outside, indicative of stratiform precipitation. However, downshear reformation did not appear to be occurring, and time was limited before landfall.
 |
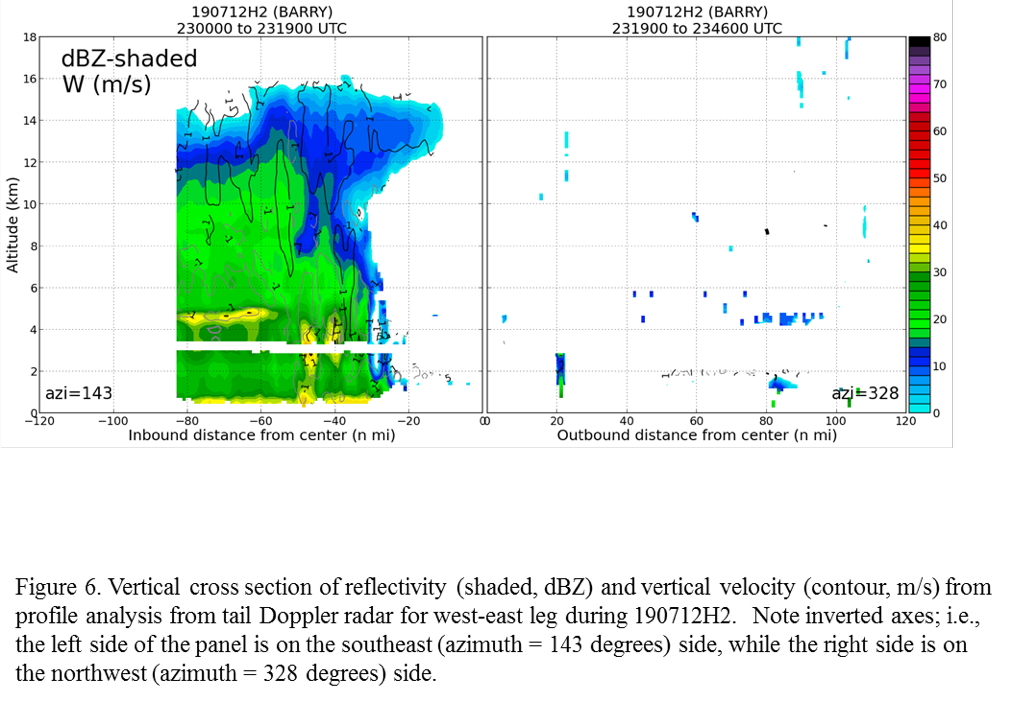 |
An offshore intense convection module was flown upon completion of the survey pattern (Fig. 7) on the east side of the storm. The aircraft sampled the band ~10 nm from the line of cells, with leg lengths of about 30 nm. The sampling occurred over a 23-minute span, from 0119-0142 UTC. Unfortunately, most of the precipitation was moderate and shallow convection and stratiform precipitation; i.e., not intense convection.
The aircraft landed at Lakeland at 0249 UTC.
Evaluation :
The mission was a success. Three radar analyses were completed and transmitted, while all 15 drops released were successful. The SFMR shoaling and offshore intense convection module were flown, but the convective burst module was not. The storm is still trying to better align and symmetrize, but it is struggling with the increasing shear, dry air, and proximity to land.
 |
Problems :
No problems were apparent during the mission.
Rob Rogers
Oct. 31, 2019
Track with SFMR winds |
Flight track with winds |
Track with SFMR winds (Inner core) |

Flight track with winds (Inner core) |
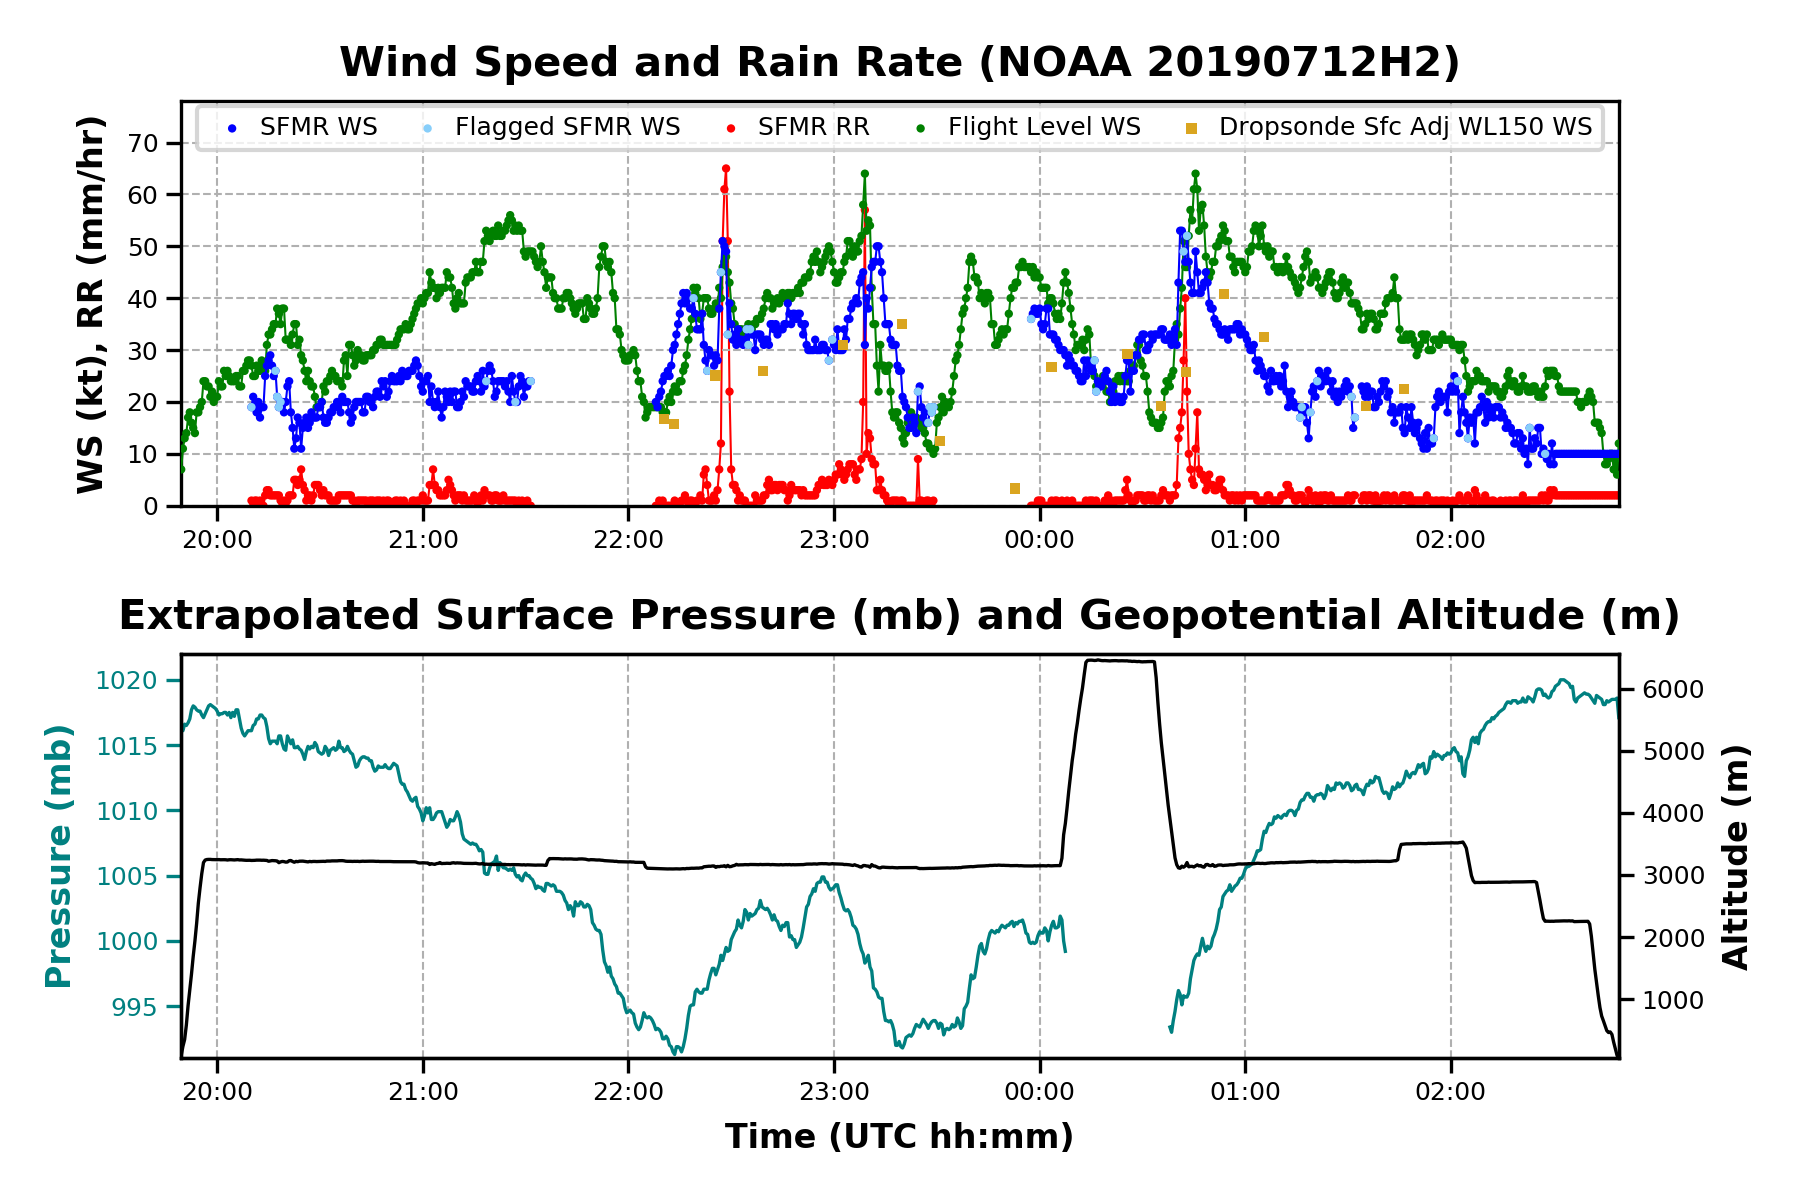
Timeseries wind, SFMR wind, rain rate, altitude and pressure plots |
|
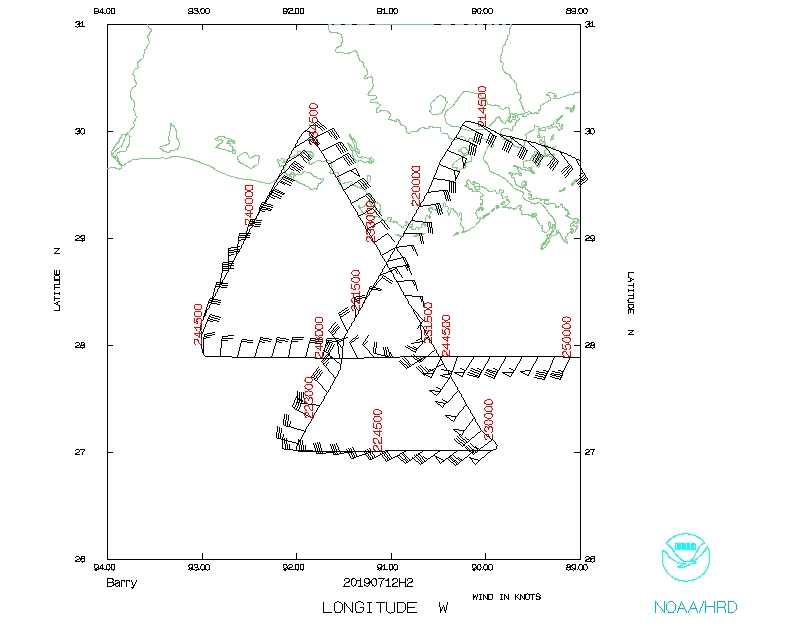 Flight track |
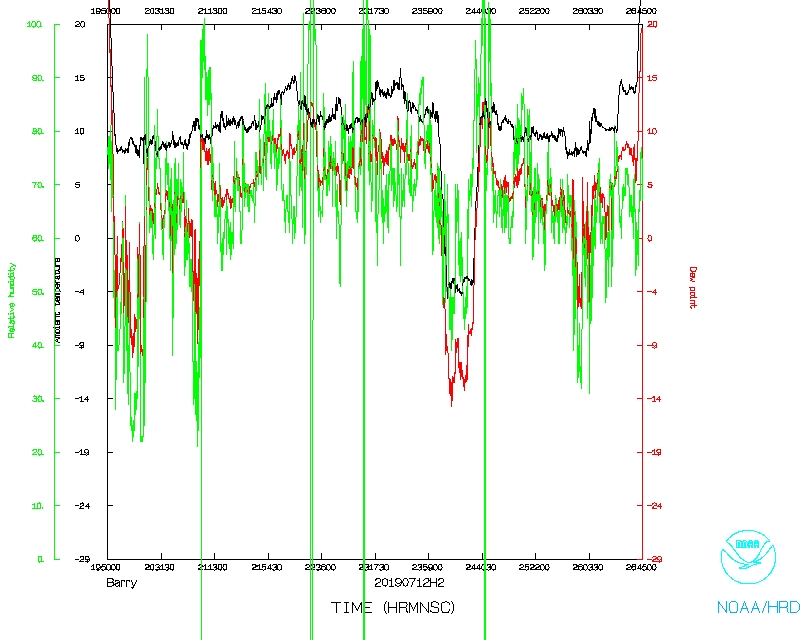 Temperature and Moisture |
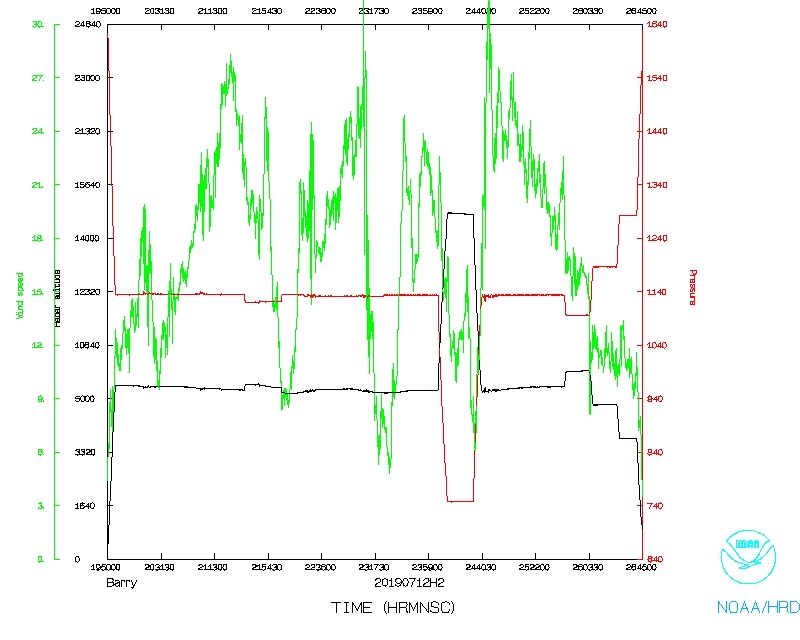 Wind and Atlitude |
Flight Director's log |
Flight Director's manifest |
Flight Director's overview |
AVAPS log |
NetCDF data |
serial data |
1 second data
LPS log |
Radar log |
Dropsonde log |