Mission Summary
20140703N1 Aircraft 49RF
Tail Doppler Radar Mission Hurricane Arthur
Aircraft Crew (49RF)
| Aircraft Commander | Ron Moyers
|
| Co-pilot | Jason Mansour
|
| Co-pilot | Doug MacIntyre
|
| Flight Director | Rich Henning
|
| Flight Director | Shannon Hefferan
|
| Data Technician | Joe Greene
|
| Data Technician | Gabe DeFeo
|
| Dropsonde Operator | Mike Mascaro
|
| Dropsonde Operator | Jeff Newnam
|
Scientific Crew (49RF)
| None
|
Mission Plan :
NOAA 49RF will conduct a G-IV TDR pattern around Hurricane Arthur, which had
intensified rapidly off the eastern coast of Florida and Georgia. The system
was declared a hurricane less than 9 h earlier. The plan calls for a
circumnavigation TDR pattern at 1, 1.5 and 2 degrees radius from the storm
center. Dropsondes are staggered at every other turn point of the octagonal
pattern. Visible satellite imagery (Fig. 1) shows that the center of
circulation is less than 2 degrees from the South Carolina coast. This
proximity to land is expected to limit sonde coverage on the northwestern side
of the storm.
The G-IV will leave MacDill AFB, FL 1730 UTC on July 3rd and will recover
back at MacDill AFB, FL by 2300 UTC the same day.
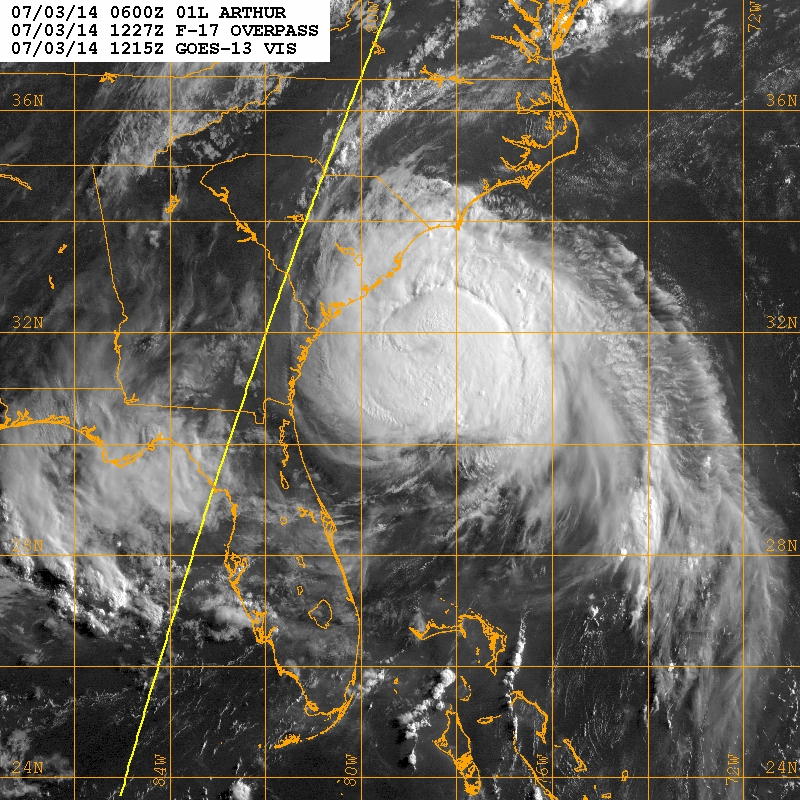
Figure 1. Visible satellite picture at 12:15 Z
|
HURRICANE SYNOPTIC SURVEILLANCE MISSION PLAN: ARTHUR
Prepared by the Hurricane Research Division
July 02, 2014 1:53 PM
Aircraft: N49RF
Proposed takeoff: 03/1730Z
|
TRACK DISTANCE TABLE
|
| #
| LAT
| LON
| RAD/AZM
| LEG
| TOTAL
| TIME
|
|
| deg min
| deg min
| n mi/deg
| n mi
| n mi
| hh:mm
| | 2S | 32 06 | 78 29 | 120/225 | 330. | 330. | 0:47
| | 3S | 33 30 | 79 12 | 120/270 | 92. | 422. | 1:00
| | 4S | 34 55 | 78 30 | 120/315 | 92. | 514. | 1:14
| | 5S | 35 30 | 76 48 | 120/000 | 90. | 605. | 1:27
| | 6S | 34 55 | 75 06 | 120/045 | 90. | 695. | 1:40
| | 7S | 33 30 | 74 24 | 120/090 | 92. | 787. | 1:54
| | 8S | 32 06 | 75 07 | 120/135 | 92. | 879. | 2:07
| | 9S | 31 30 | 76 48 | 120/180 | 93. | 972. | 2:21
| | 10S | 32 27 | 78 04 | 90/225 | 86. | 1058. | 2:34
| | 11S | 33 30 | 78 36 | 90/270 | 69. | 1127. | 2:44
| | 12S | 34 34 | 78 04 | 90/315 | 69. | 1196. | 2:54
| | 13S | 35 00 | 76 48 | 90/000 | 68. | 1264. | 3:05
| | 14S | 34 34 | 75 32 | 90/045 | 68. | 1331. | 3:15
| | 15S | 33 30 | 75 00 | 90/090 | 69. | 1401. | 3:25
| | 16S | 32 27 | 75 32 | 90/135 | 69. | 1469. | 3:36
| | 17S | 32 00 | 76 48 | 90/180 | 69. | 1539. | 3:46
| | 18S | 32 48 | 77 39 | 60/225 | 64. | 1603. | 3:56
| | 19S | 33 30 | 78 00 | 60/270 | 46. | 1649. | 4:03
| | 20S | 34 12 | 77 39 | 60/315 | 46. | 1695. | 4:10
| | 21S | 34 30 | 76 48 | 60/000 | 45. | 1740. | 4:17
| | 22S | 34 12 | 75 57 | 60/045 | 45. | 1786. | 4:24
| | 23S | 33 30 | 75 36 | 60/090 | 46. | 1832. | 4:32
| | 24S | 32 48 | 75 57 | 60/135 | 46. | 1878. | 4:39
| | 25S | 32 30 | 76 48 | 60/180 | 46. | 1924. | 4:46
| |
Mission Summary :
| Take off
| Landing
| MacDill AFB, FL | 17:14 UTC
| MacDill AFB, FL | 22:53 UTC
| |
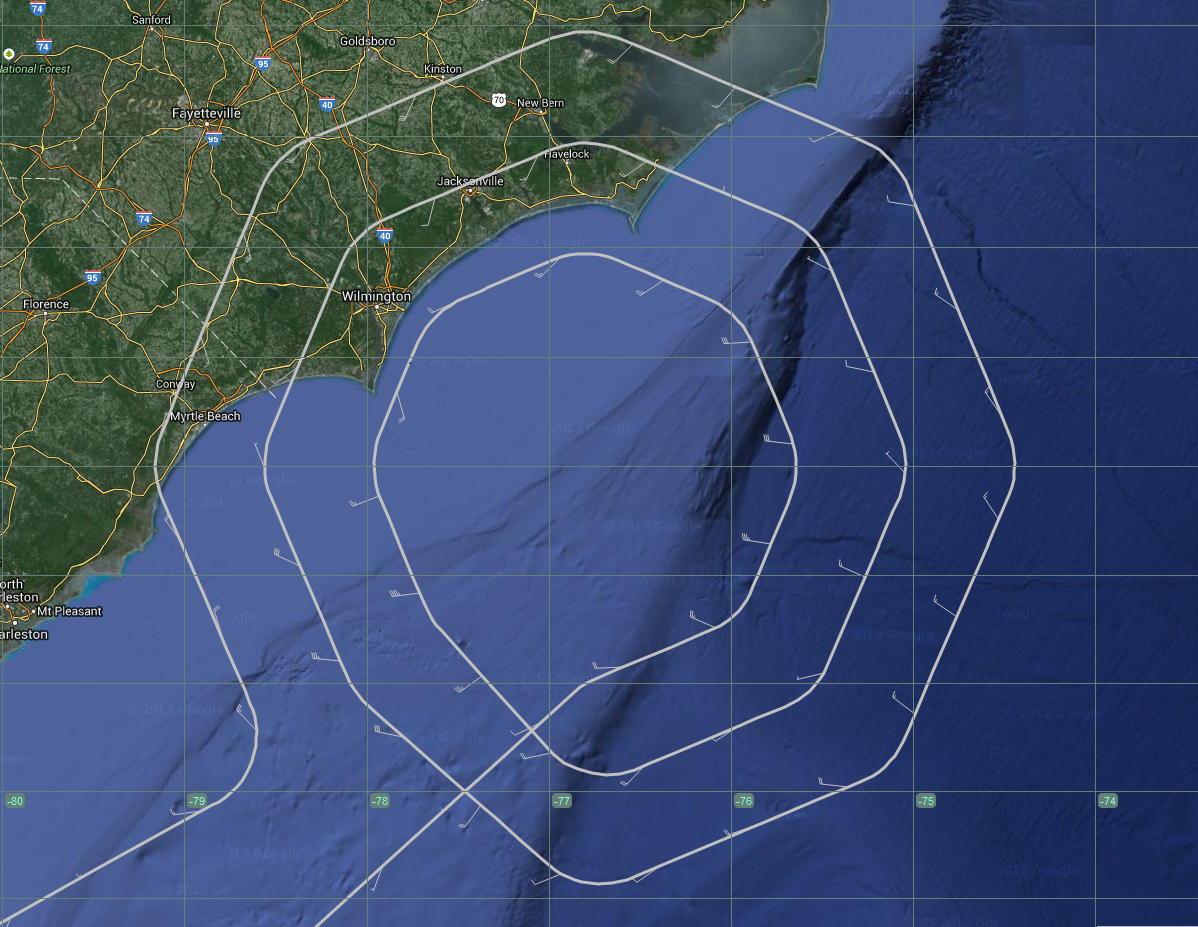
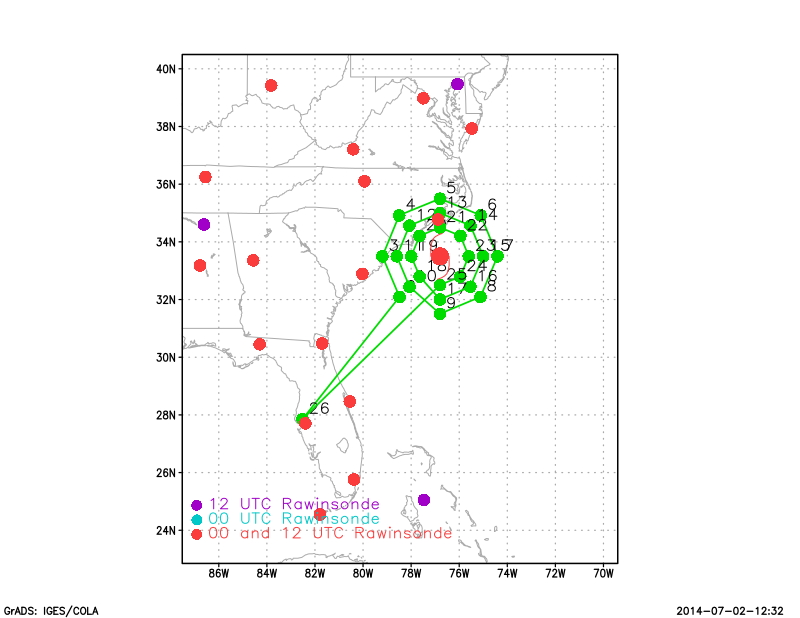
Figure 2. Actual flight track
|
The actual flight track is shown in Fig. 2. Takeoff was at 1714 UTC from
Tampa. The aircraft landed in Tampa at 2253 UTC. 12 sondes were deployed.
Mission Evaluation :
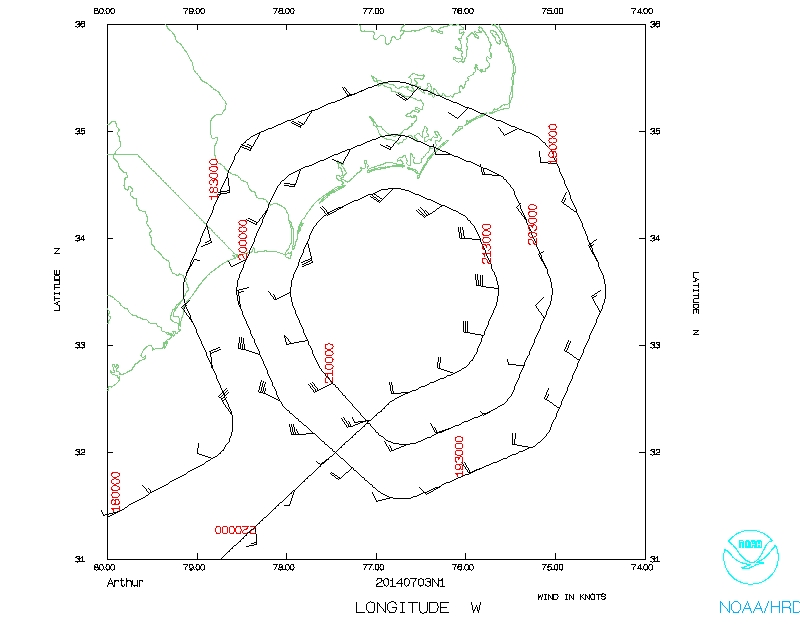
A total of three radar analyses were created and transmitted in real time. A
composite of these three analyses is shown in Fig. 3 at different altitudes.
A total of 12 dropsondes were processed. The position used to center the TDR
pattern was based on an earlier forecast. Because this position was not updated
to the real-time storm position (which was to the west of the forecast
position), the G-IV ended up flying over the eye and eyewall of Hurricane
Arthur. Although this was not intended, it did provide for good coverage of
the wind field in Arthur's inner core.
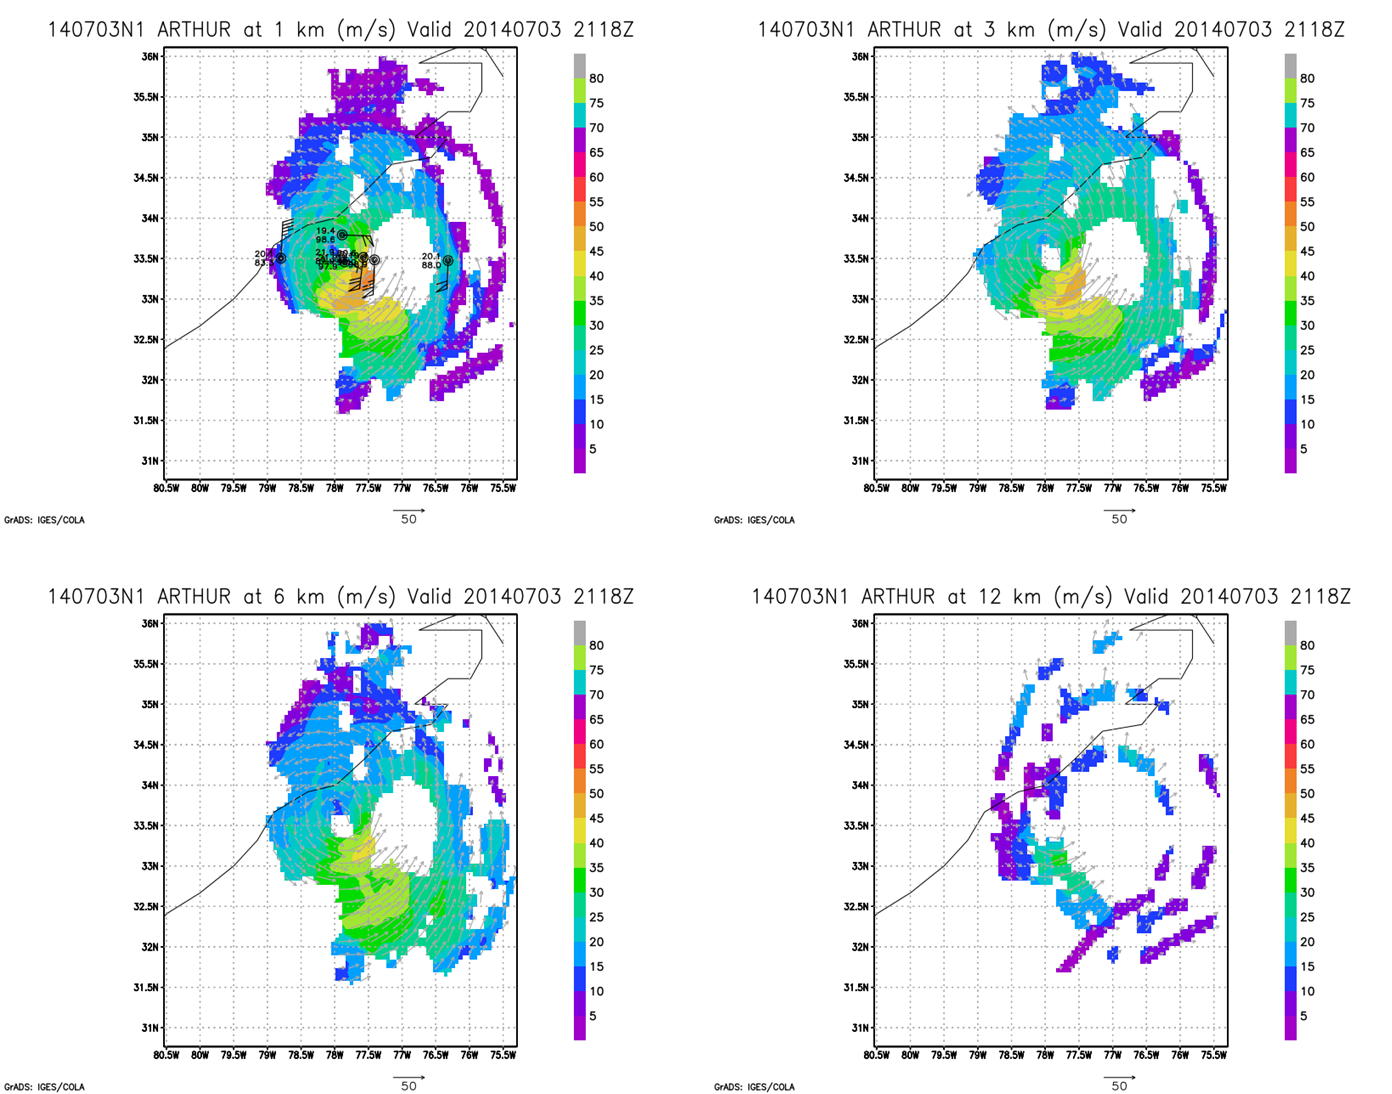
Figure 3. Composited radar analyses
|
Problems :
No problems with the data collection systems were noted.
Paul Reasor
Nov. 24, 2014
Mission Data :
Flight Director's log |
NetCDF data |
1 second data |
serial data
Page last updated March 3, 2015
Return to Mission page.