Proposed track
| Aircraft Commander | Harris Halverson |
| Co-pilot | Cathy Martin |
| Co-pilot | Pat Didier |
| Navigator | Chris Sloan |
| Flight Engineer | Ken Heystek |
| Flight Engineer | C. Lalonde |
| Flight Director | Ian Sears |
| Flight Director | Mike Holmes |
| System Engineer | Terry Lynch |
| Data Technician | Dana Naeher |
| Data Technician | James Wernecke |
| LPS | Sim Aberson |
| Dropsondes/AXBT | Kathryn Sellwood |
| Radar | Jun Zhang |
| Observer | Joseph Patton (Univ. Okla.) |
| Observer | Kelly Nuñez (Univ PR) |
| Observer | Kyle Nolan (UMaine) |
| Observer | Nikki Perrini (FSU) |
Mission Plan :
Conduct EMC-tasked TDR mission into Hurricane Arthur, which was approaching landfall in North Carolina. The proposed flight pattern was for an initial figure-4 pattern followed by a circumnavigation of the storm outside the radius of maximum wind speed, and ending with a second, rotated, figure 4. There was a concurrent G-IV TDR mission, which allowed for excellent radar and dropwindsonde coverage of the vortex and the environment.
Mission Summary :
| Take off | Landing
| MacDill AFB, FL | 18:40 UTC
| MacDill AFB, FL | 23:50 UTC
| Penetrations
| 2
| | |||
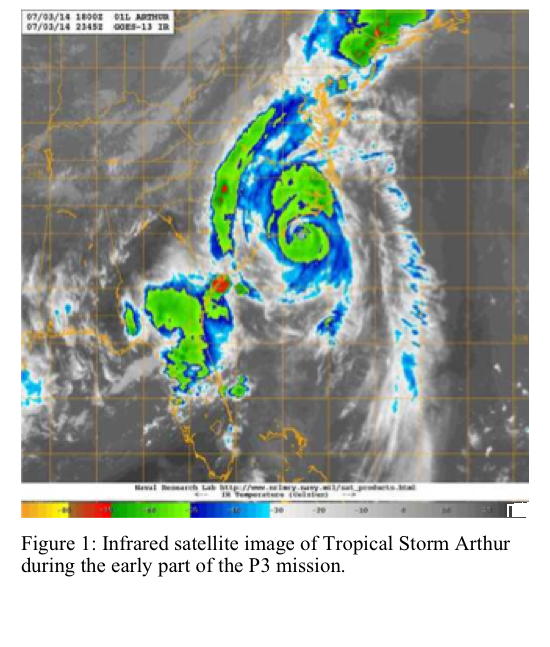
Hurricane Arthur continued to strengthen slowly during the morning as an eye started to appear on satellite imagery (Fig. 1), though the convection was noticeably less vigorous than on the previous day. convection started to develop in all quadrants of the tropical cyclone (Fig. 1). Arthur was encountering moderate southerly shear, as shown by the extension of the cloud pattern northward from the center. This could be considered an early stage of the extratropical transition of the storm.
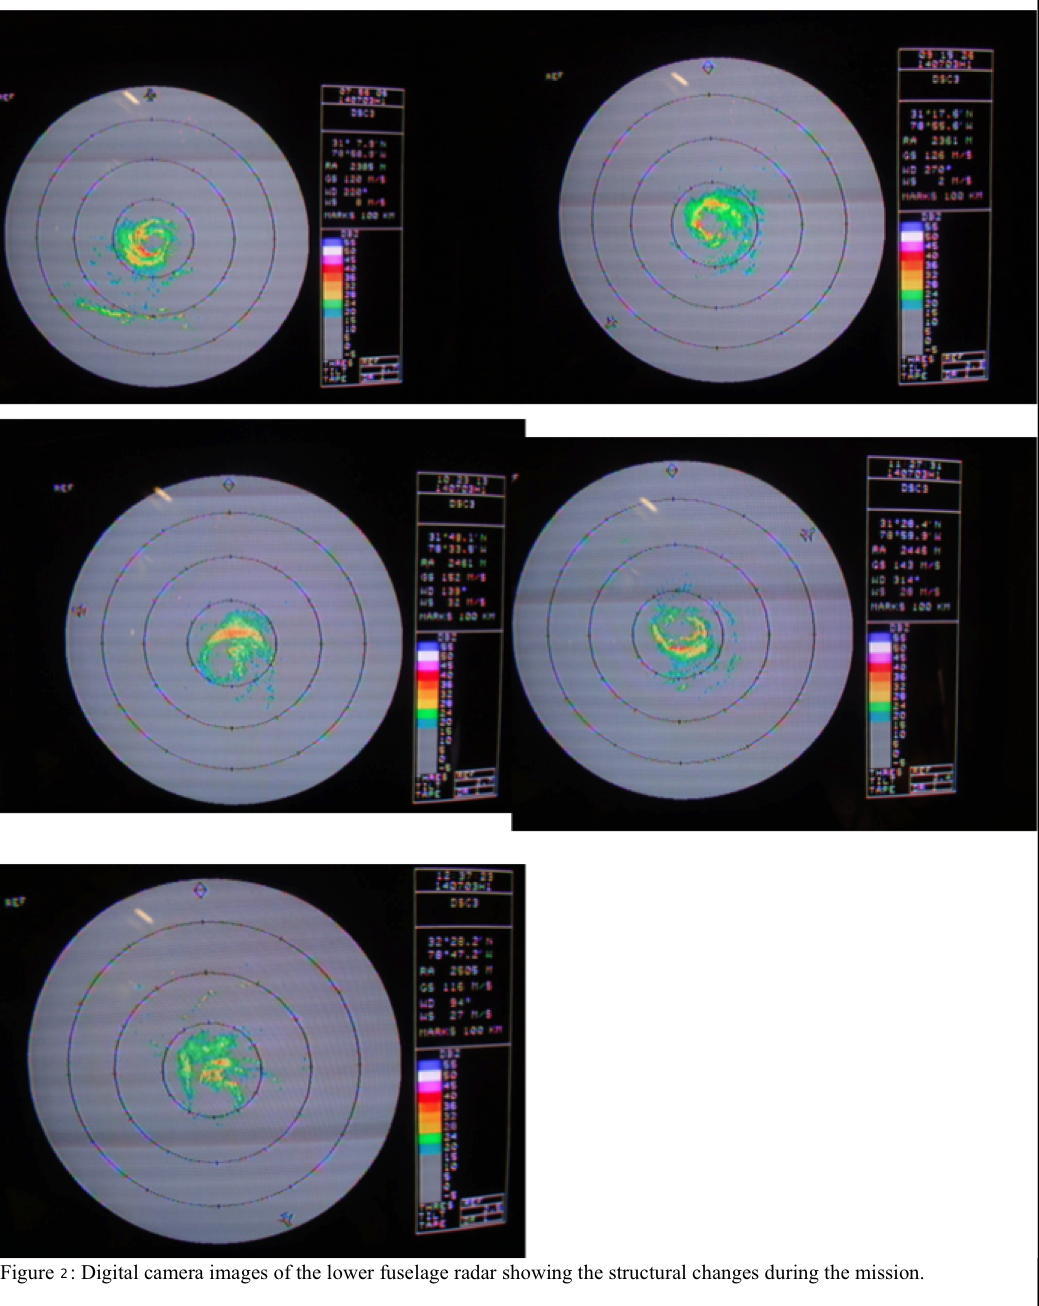
During the first figure-4 pattern, the convective structure of Arthur was as expected from satellite, with an eye surrounded by convection (Fig. 2). The intensity of the convection was in the 40-dBZ range, what is usual for a tropical cyclone of this intensity and structure and much less than encountered on the previous day. The structure did not change substantially during the mission, except for the direction of the wavenumber-1 asymmetry as convection rotated around the eywall.
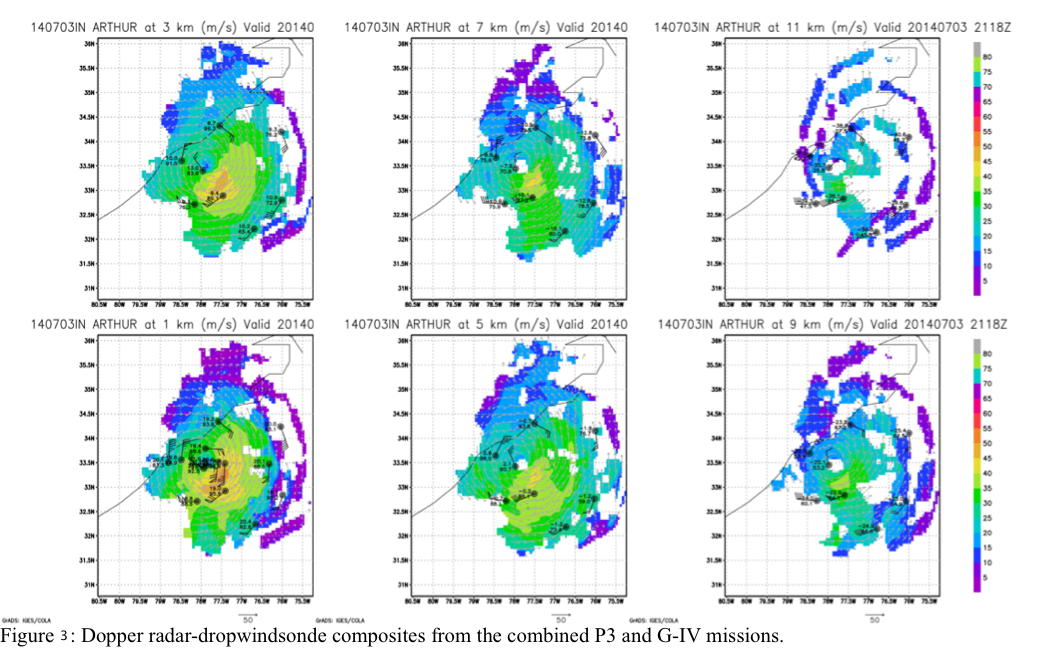
After the initial figure-4 pattern was completed, a fire of unknown origin caused the nose radar to be deactivated, and, subsequently, the remainder of the mission was canceled. Despite this, a successful figure-4 pattern was completed. Two radar analyses were successfully completed and transmitted from the plane. The Doppler radar-dropwindsonde composites show that there were wind speeds approaching 110 kt at 1-km altitude, confirming estimates that Arthur was a category-2 hurricane during the mission. The wind field remained asymmetric at all levels with the strongest winds remaining well offshore during the landfall.
7 dropsondes deployed all good, 10 AXBTs launched, eight good, 2 bad.
Problems:
The mission was generally much smoother than the previous one.
The air conditioner at the front of the aircraft failed before takeoff. AOC put fans throughout the tube to cool the air, and the flight was relatively comfortable as a result.
There was some discussion between the ground and the LPS concerning the radius of the circumnavigation (that was subsequently canceled). The convective pattern seen on the ground (via WSR-88D) was very different from that seen from the lower-fuselage on the aircraft. The lower-fuselage should always be used when such discrepancies are seen.
Sim Aberson
July 31, 2014
Mission Data :
 Flight track |
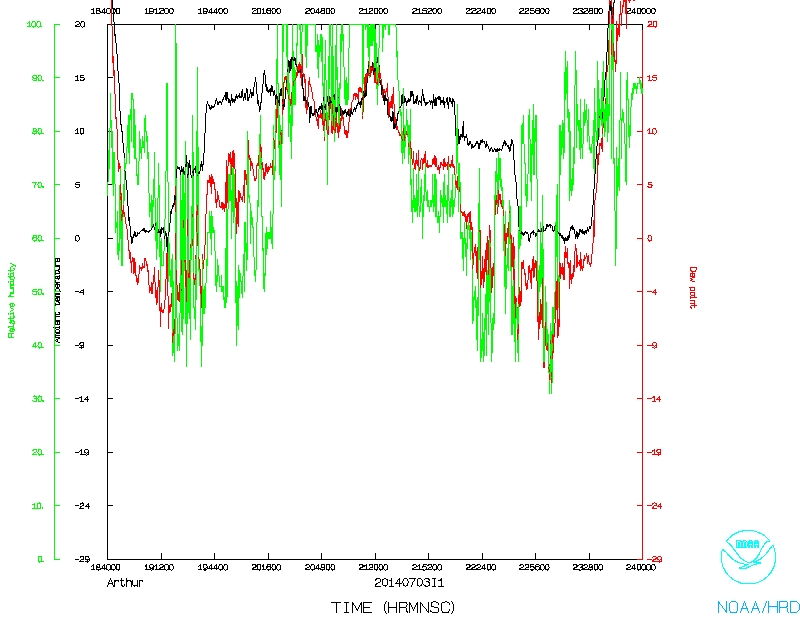 Temperature and Moisture |
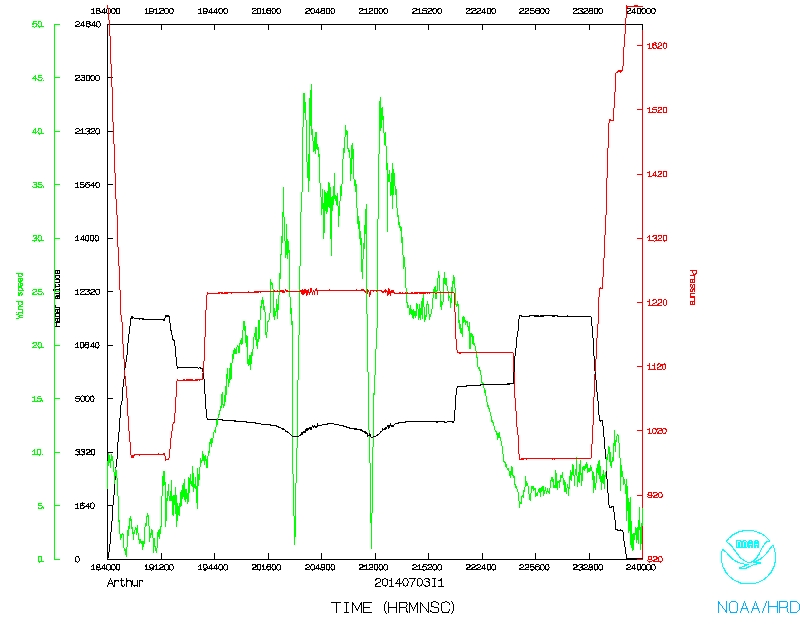 Wind and Atlitude |
LPS log | Radar log | Drop log | AXBT
Flight Director's log | NetCDF data | One second data | serial data
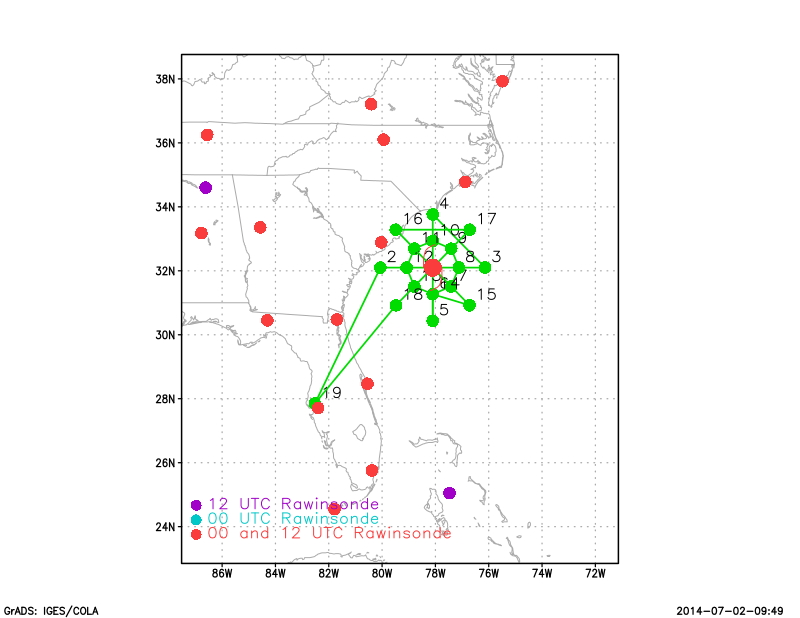
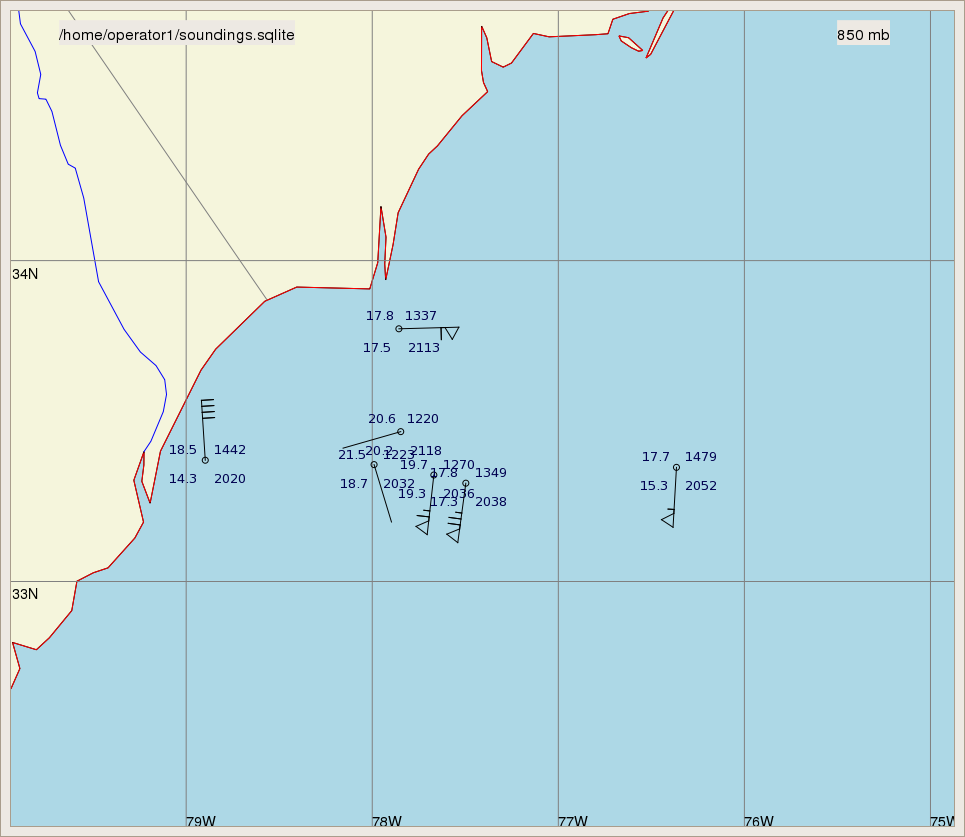
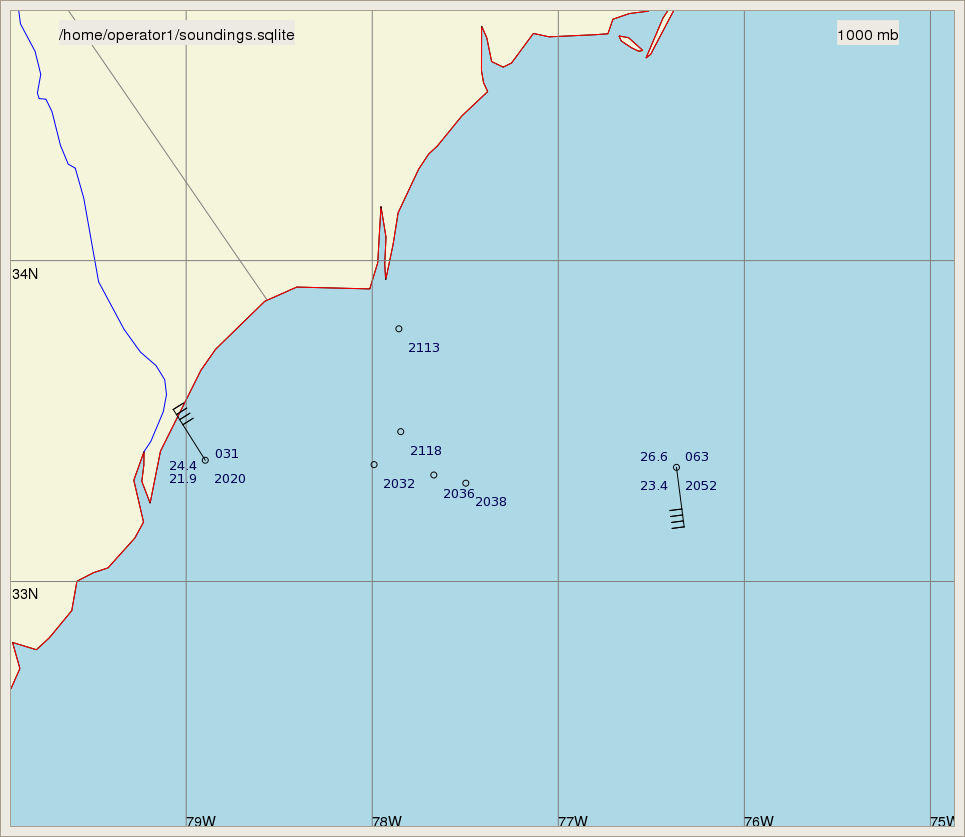
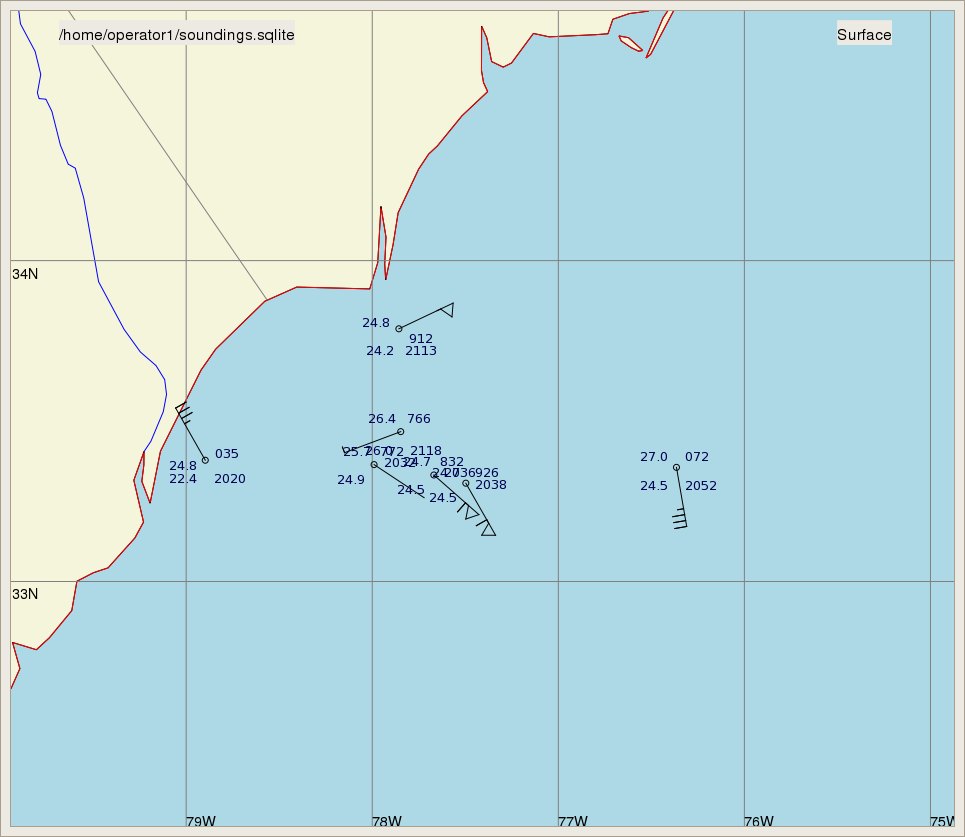
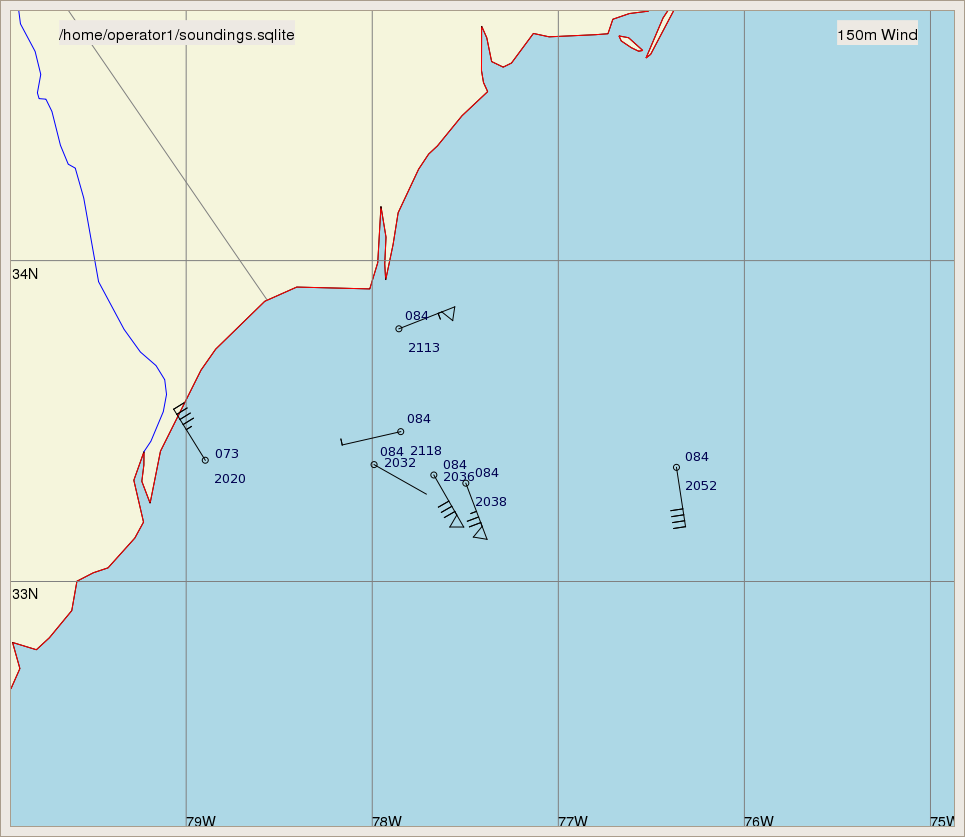
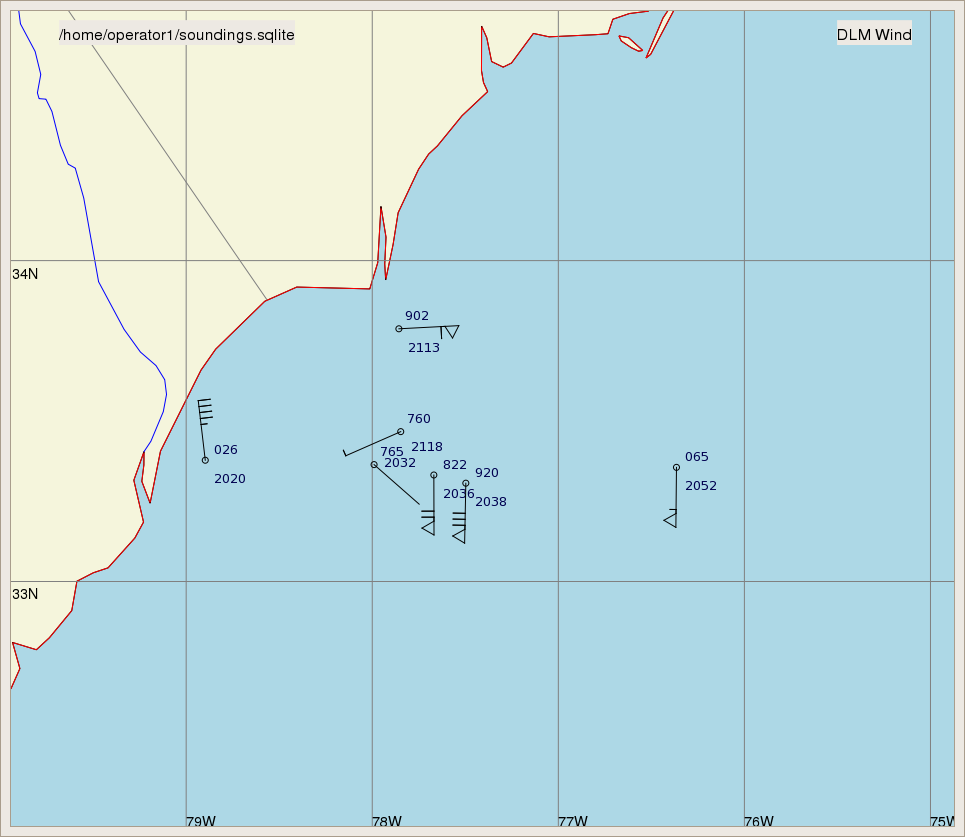
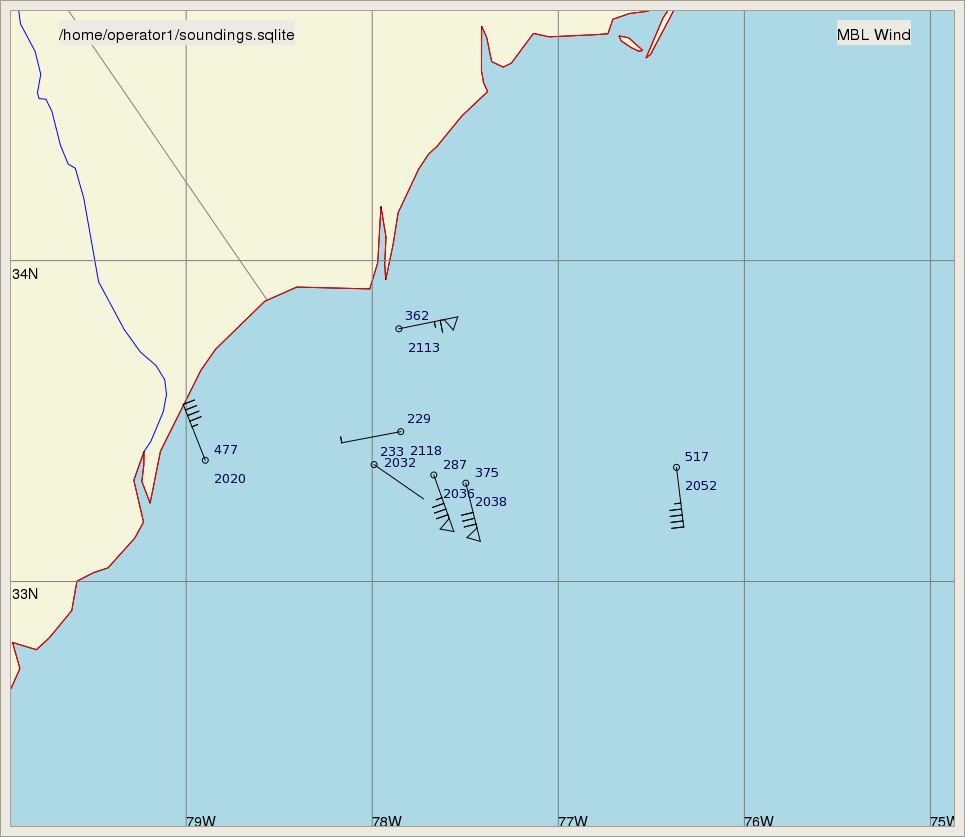
Synoptic maps of dropsondes
850 mb
925 mb
1000 mb
Surface
150 m Winds
Deep Layer Mean Winds
Mean Boundary Layer Winds