
| Aircraft Commander | Justin Kibbey |
| Co-pilot | Chris Kerns |
| Co-pilot | Adam Abitbol |
| Navigator | Pete Siegel |
| Flight Engineer | Joe Klippel |
| Flight Engineer | Paul Darby |
| Flight Director | Barry Damiano |
| System Engineer | Charles Lynch |
| System Engineer | Jorge Delgado |
| Data Technician | Joe Bosko |
| Data Technician | Todd Richards |
| LPS | Rob Rogers (HRD) |
| Dropsondes | Hua Chen (HRD) |
| Radar | Lisa Bucci (HRD) |
| Radar | Robert Nystrom (U.Illinois U-C) |
Mission Plan :
Conduct EMC-tasked TDR pattern in Tropical Storm Arthur, which is nearly stationary off the east coast of Florida. Arthur is experiencing northerly to northwesterly shear (Fig. 1). The storm is in a region of shear gradient, with shear on the western side of the storm ~5 kt and on the eastern side ~20 kt.
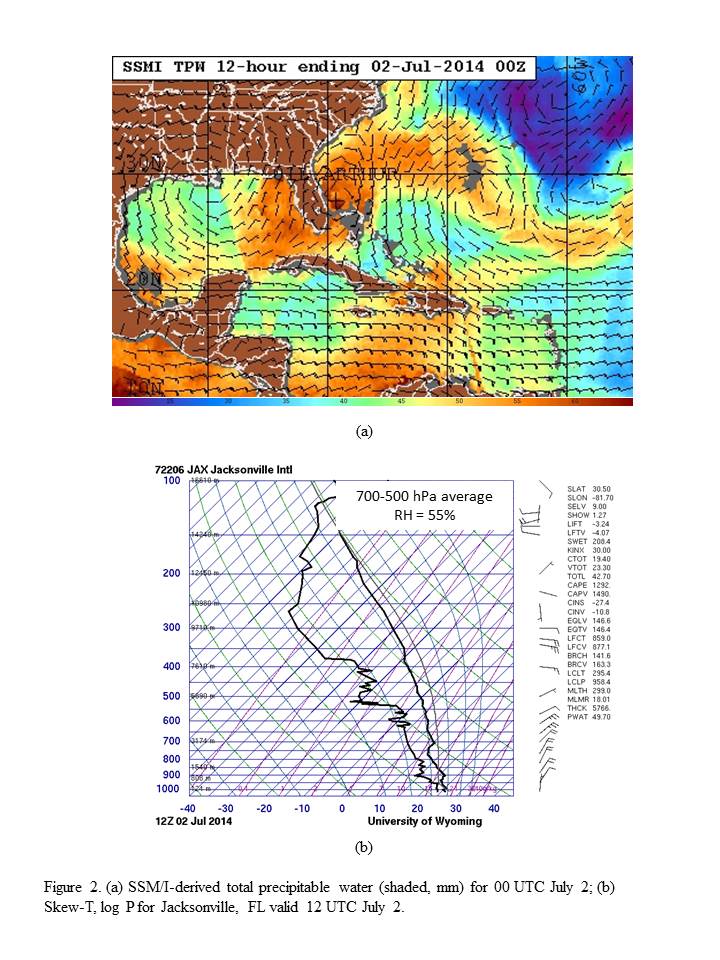
A plot of total precipitable water (Fig. 2) indicates a generally moist (TPW > 55 mm) environment in the immediate vicinity of Arthur, though there is some indication of reduced TPW immediately off the coast of Georgia and South Carolina. A rawinsonde from Jacksonville, FL at 12 UTC July 2 shows dry air in the middle and upper levels, with average relative humidity in the 700-500 hPa layer at 55%.
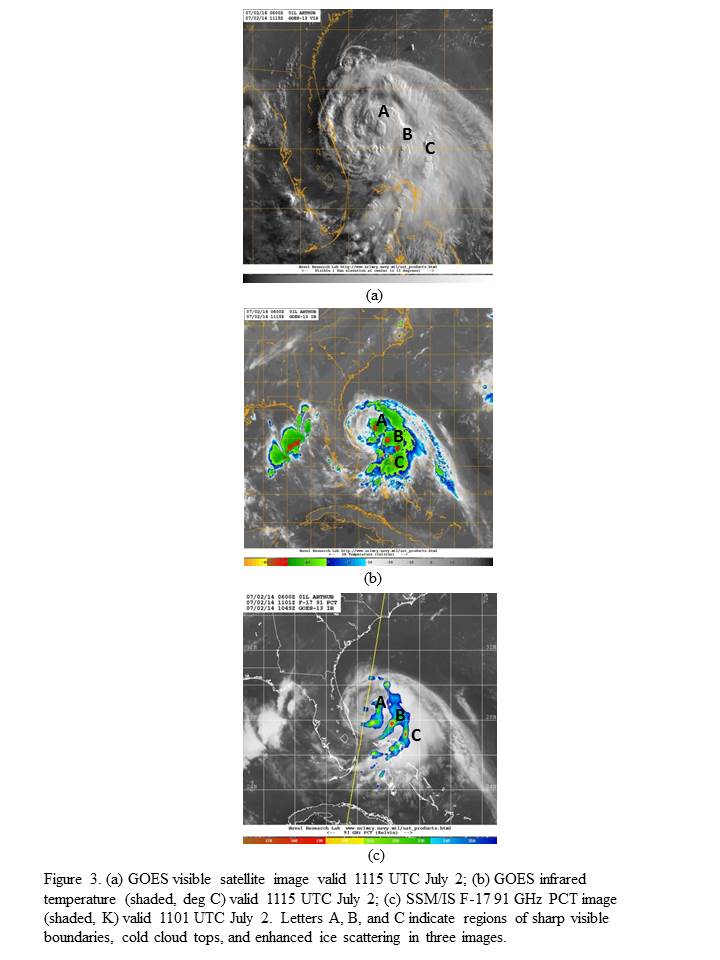

Satellite imagery taken during the mission (Fig. 3) shows the majority of the precipitation on the south and east side of the storm, i.e., in the downshear left quadrant. There are three distinct areas of well-defined cloud boundaries associated with cold cloud tops and enhanced ice scattering, likely associated with deep convection. These areas are marked as "A", "B", and "C", and they are located in a line extending southeast from the storm center. The innermost region of deep convection, denoted "A", is located close to the storm center.
Model guidance (Fig. 4) are all tightly clustered around a solution that brings Arthur toward the north and eventually turning toward the northeast, just brushing along the coast of North Carolina. The intensity guidance generally brings Arthur up to hurricane strength, with only the SHIPS model predicting that Arthur will reach Category 2 strength.
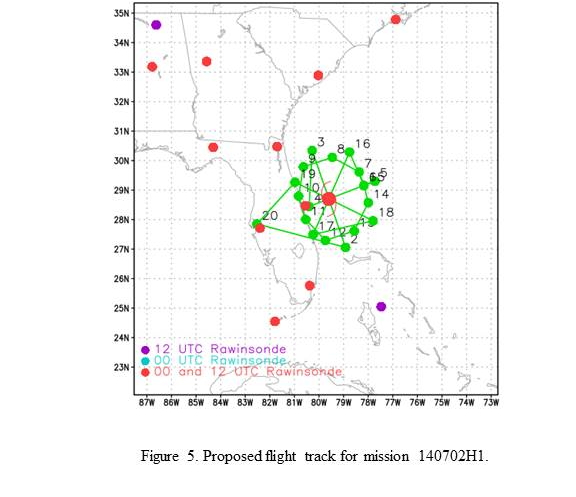
The plan calls for a TDR pattern with an initial point on the south side of the storm (Fig. 5). A figure-4 pattern will be flown, finishing the pattern on the east side. Upon completion of this figure 4, the aircraft will turn around and begin an octagonal circumnavigation around the storm at a radius of approximately 1.5 times the radius of maximum winds (RMW). Once that is completed, continue downwind to the northeast side of the storm and complete a second figure 4. Release dropsondes at all turn points, RMW points on the radial legs, and at each center pass.
Mission Summary :
| Take off | Landing
| MacDill AFB, FL | 06:04 UTC
| MacDill AFB, FL | 12:59 UTC
| | ||

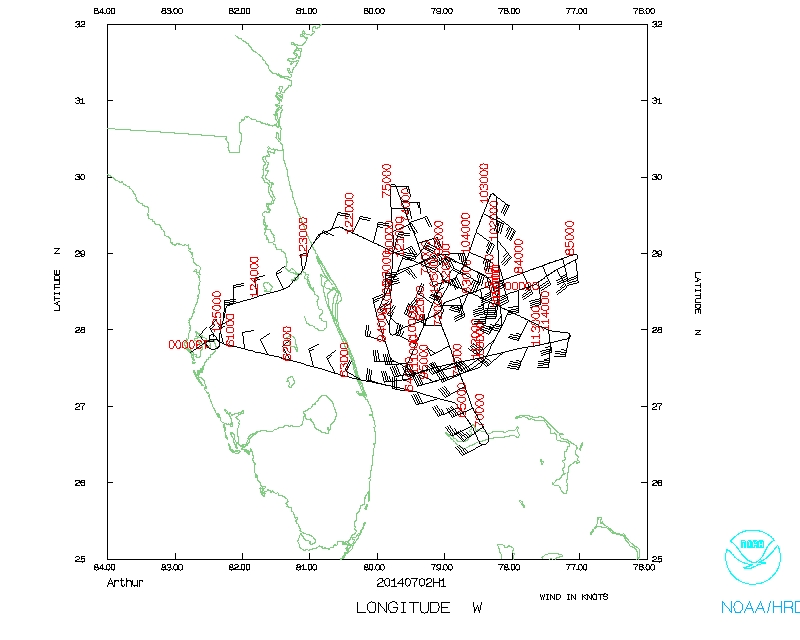
The pattern was flown as planned (Fig. 6). Take-off was at 0604 UTC. The strongest winds at flight level were about 50 kt on the southeast side of the storm about 30 nm from the center. The storm is still highly asymmetric, with very little precipitation on the north and west sides and fairly significant precipitation with some embedded deep convection on the southeast side. The aircraft encountered some notable turbulence with lightning and some graupel in the southeast portion of the pattern, and radar echo tops extended up to 12-14 km altitude here. While a center drop indicated a displacement of the circulation from 5000 to 12,000 ft, radar analyses suggest that the circulation is generally aligned between 2 and 8 km altitude (Fig. 7).


A plot of wind speeds at 2-km altitude and peak vertical velocity in the 6-14 km layer from the operational, 5-km radar analyses (Fig. 8) shows that the strongest updrafts are located on the southeast side of the storm. The regions identified as deep convection from the satellite imagery in Fig. 3 are also evident in the radar analyses, where they are indicated by the strongest updraft strengths in the middle to upper troposphere. Additionally, note that region "A" is located inside the RMW at 2-km altitude for radar legs centered at 1047 and 1202 UTC July 2.
There were some significant problems with the radar communications and the processing that caused us to fail getting the first two passes transmitted to EMC in time for assimilation. Specifically, there was a problem with the radar data such that the fore and aft antenna measurements were being written to the same file, rather than to different files. Additionally, there were permission problems with accessing the AOC server using jobfiles that were created on the ground and transmitted up to the aircraft. Both of these problems were corrected during the flight and three analyses were ultimately transmitted. Additionally, there was a problem with the AVAPS system, where the first six drops were not seen by the system.
The aircraft completed its mission and landed at MacDill at 1258 UTC. A total of 30 GPS sondes were dropped.
Mission Evaluation:
The pattern was flown successfully, and noteworthy structures were revealed by the information collected during the flight. However, there were significant issues with the radar analysis generation that were ultimately resolved (there were no issues at all during the next flight 24 h later). The dropsondes worked well, though there was an issue with seeing the data for the first six drops.
Problems :
The primary problems were with the radar analyses and the first six dropsondes. These problems were resolved during the mission.
Rob Rogers
July 8, 2014
 Flight track |
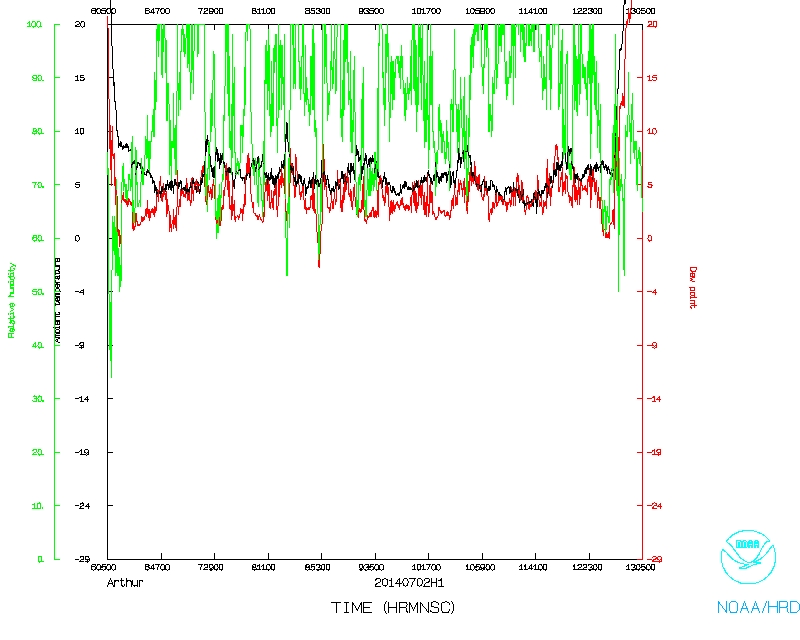 Temperature and Moisture |
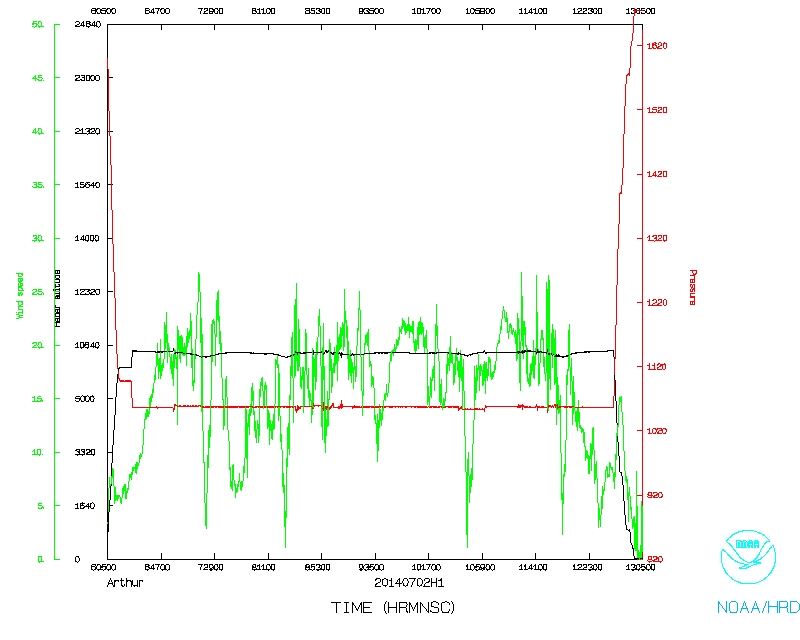 Wind and Atlitude |
Flight Director's log | Flight Director's summary | Lead Scientist's log | Radar log | Dropsonde log
NetCDF data | 1 second data | serial data