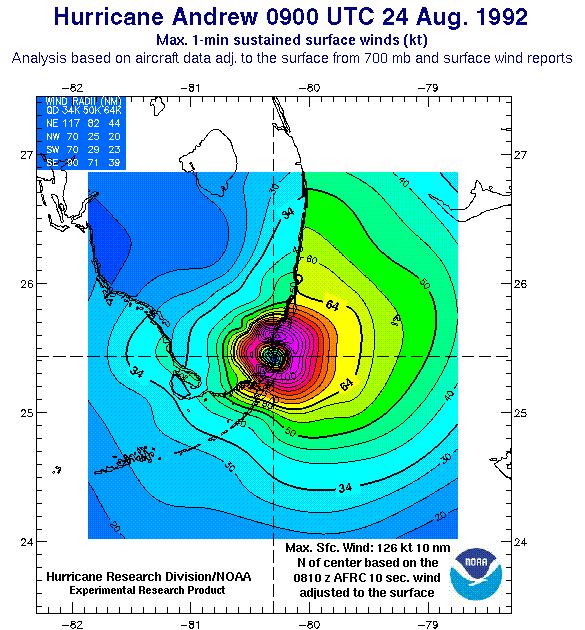
Snapshot of Andrew's Winds at Landfall
This is a color graphic of the sustained surface (10 m) wind speed
distribution at landfall (5 am local time) described in the
Weather and Forecasting
articles. The strongest winds are contained in the eyewall
(reds and purples), and the weakest winds are in the eye (the
cross hairs show the storm center). Due to uncertainties in
adjusting flight level reconnaissance wind measurements to the
surface, accuracy of the winds in the eyewall is +/- 20%,
elsewhere accuracy is on the order of 10%. The winds are
representative of marine exposure over the water and open
terrain (similar to an airport runway) over land. The
discontinuity at the coastline is a few kilometers wide and
represents the distance over which the air flow responds to
a new underlying surface. Trees, houses, and other terrain
features slow down the winds over land but strong gusts can
still occur. To estimate the peak 3 second gust at any
location, multiply the wind speeds in the graphic by 1.3.
To convert from knots to miles per hour, multiply the wind
speeds on the graphic by 1.15.
To find out more about our project to correct winds over
land for terrain effects check out
(www.aoml.noaa.gov/hrd/asos).
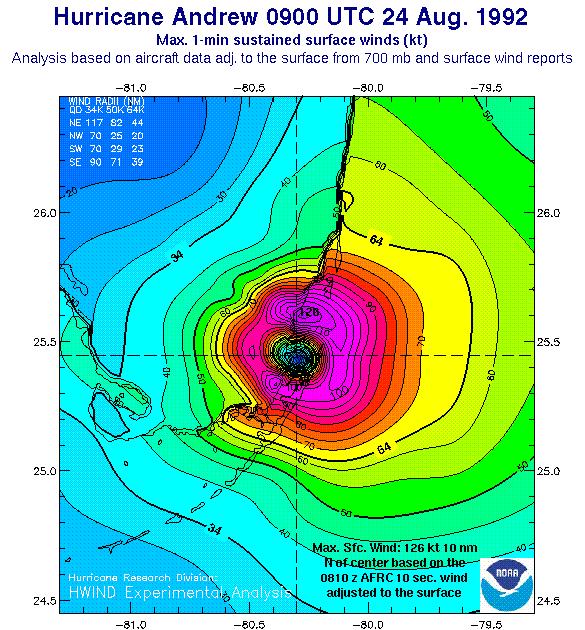
Below is a larger scale map of Florida taken from the diagram above.