| Aircraft Commander | John Logenecker |
| Co-pilot | Kristie Twining |
| Flight Director | Paul Flaherty |
| Flight Director | Jess Williams |
| Data system Operator | John Hill |
| Dropsonde Operator | Joe Greene |
| Dropsonde Operator | Charles Lynch |
| Lead Project Scientist | Sim Aberson |
| Dropsonde Scientist | Bachir Annane |
Mission Plan :
A SALEX mission around TD02 (Ana) east of Barbados. A star pattern was to be executed to sample the storm and environment with dropwindsondes in all quadrants.
Mission Summary :
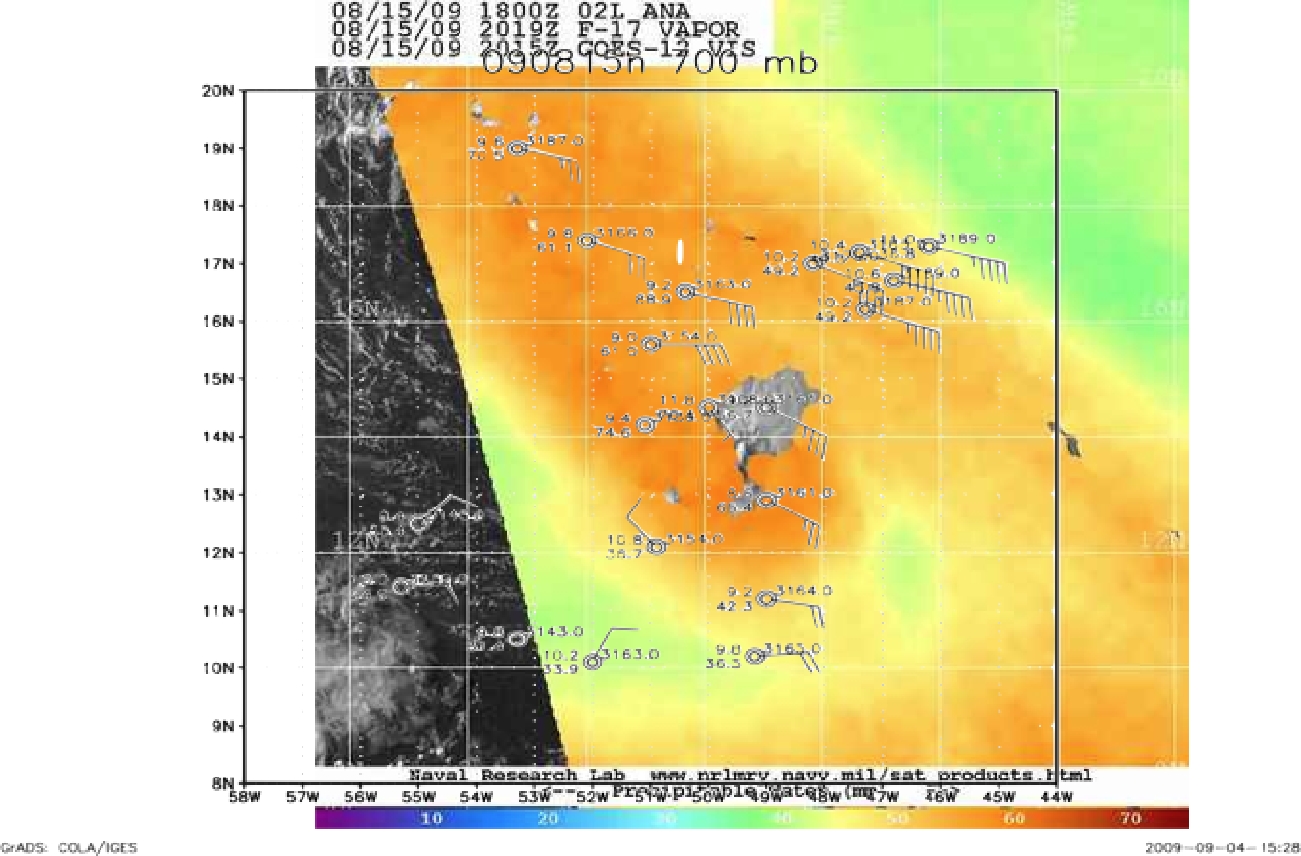
The mission was fully successful with one fast fall sonde, the remainder working fine. Ana was small and weak, and barely showed up in the dropwindsonde data except at low levels. The flight pattern was modified during the flight to sample regions of moist and dry air and the high-gradient regions between them. Figure 1 shows the flight pattern flown, with 700 hPa station plots overlain on total precipitable a satellite water retrieval closest to the time of the mission. The data do not correspond exactly since the mission occurred over 8 h, whereas the satellite retrieval is an instantaneous snapshot. Note that a circulation at 700 hPa is barely visible in the data. A strong jet at 700 hPa (> 45 kt) is visible to the northeast and north of Ana.
By 500 hPa (Fig. 3), the circulation is seen to be tilted toward the east. AT 200 hPa (Fig. 4), the strong easterly flow over the center is evident, though some outflow on the northern side is seen. This outflow was strong enough to keep Ana going weakly, but he combination of dry air and shear eventually caused it to weaken.

It is unlikely that any model was able to have initial vortices that had the vertical structure seen in the data. This is a very good case for initialization and data assimilation tests.
Problems :