Mission Summary
20090814N1 Aircraft 49RF
Genesis/SALEX Mission (Ex-TD#2/Pre-Tropical Storm Ana)
Aircraft Crew (49RF)
| Aircraft Commander | John Logenecker |
| Co-pilot | Kristie Twining |
| Flight Director | Paul Flaherty |
| Flight Director | Jessica Williams |
| Electronics Technician | John Hill |
| Dropsonde Operator | Joe Greene |
| Dropsonde Operator | Charles Lynch |
Scientific Crew (49RF)
| Lead Project Scientist | Jason Dunion |
| Dropsonde Scientist | Kathryn Sellwood |
Mission Plan :
NOAA 49RF will fly a combination Genesis Experiment and Saharan Air Layer
Experiment (SALEX) around Ex-Tropical Depression 2 (Pre-Tropical Storm Ana).
The G-IV will leave Barbados at 2000 UTC and will recover back at Barbados at
0300 UTC. The flight track will take the G-IV on a clockwise circumnavigation
of the system and is shown in Fig. 1, along with the 19 GPS dropsonde points.
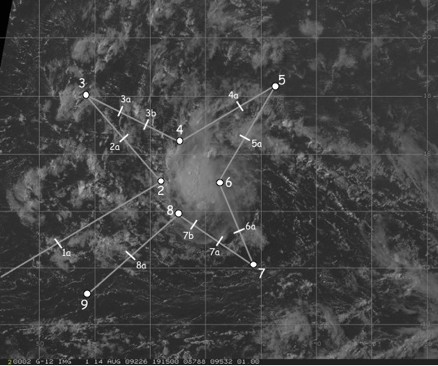
Fig. 1: Flight track (gray line) for Genesis/SALEX mission 090814n overlaid on GOES visible imagery from 1915 UTC. The GPS dropsonde points (19 total) are indicated by white circles and hash marks.
|
Mission Summary :
a) Synoptic Situation
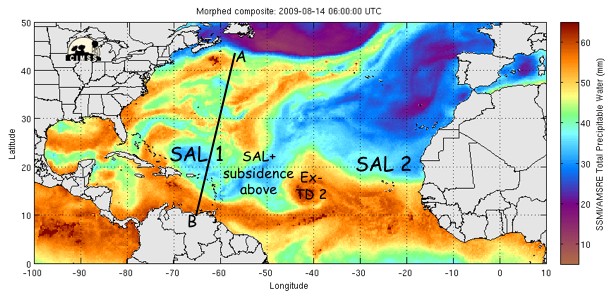
Ex-TD 2 was located in the central North Atlantic on 14 August (Fig. 2) and
positioned between two large Saharan Air Layer (SAL) outbreaks. Fig. 2
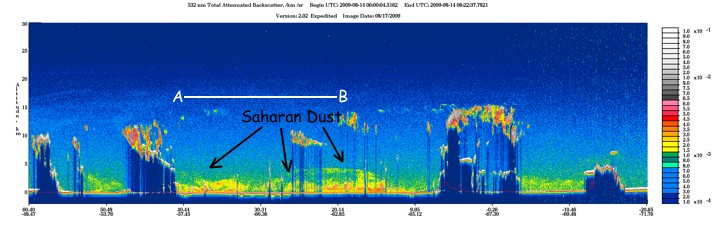
(bottom) also shows that the SAL air mass located west of Ex-Td 2 contained a
significant amount of dust from the
|
|
|
Fig. 2: (Top) TPW imagery (14 Aug 0600 UTC) showing Ex-TD 2 and two large SAL
outbreaks (green to blue shading; ≤45 mm TPW) located east, north
and west of the storm. The black line labeled "A" and "B" shows a coincident
CALIPSO satellite overpass. (Bottom) Cross section of aerosols detected by a
0600-0622 UTC CALIPSO overpass along the transect labeled "A" and "B" in the
TPW image.
|
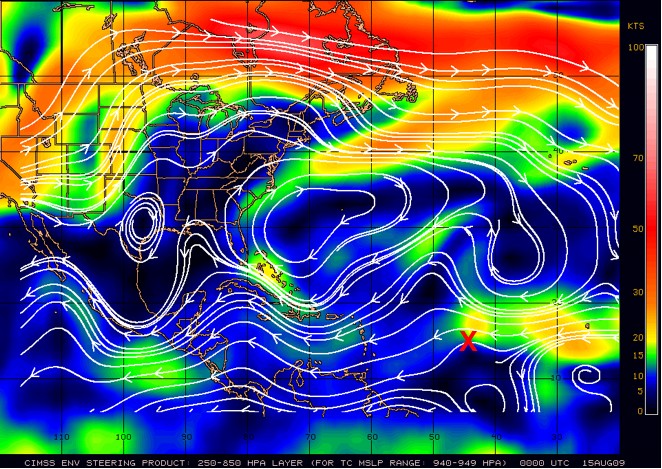
near-surface up to ~5 km. At 2100 UTC, Ex-TD 2 was located at ~14.8°N
45.3°W. The storm was tracking to the west at ~15 kt in a moderate E-W
trade wind regime along the southern periphery of a deep layer ridge [Fig. 3
(left)]. Though a weakness in that ridge can be seen in Fig. 3 at ~50oW,
Ex-TD 2 was too far south to be drawn significantly northward by that weakness.
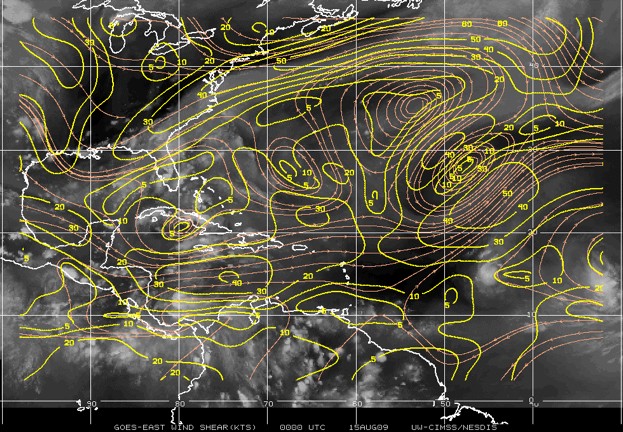
Although Ex-TD 2 was located in a region of low shear (~5-10 kt), analyses from
UW-CIMSS indicated that there was a strong N-S shear gradient near the storm
with 20-30 kt on the northern fringes of the convection (Fig. 3, right).
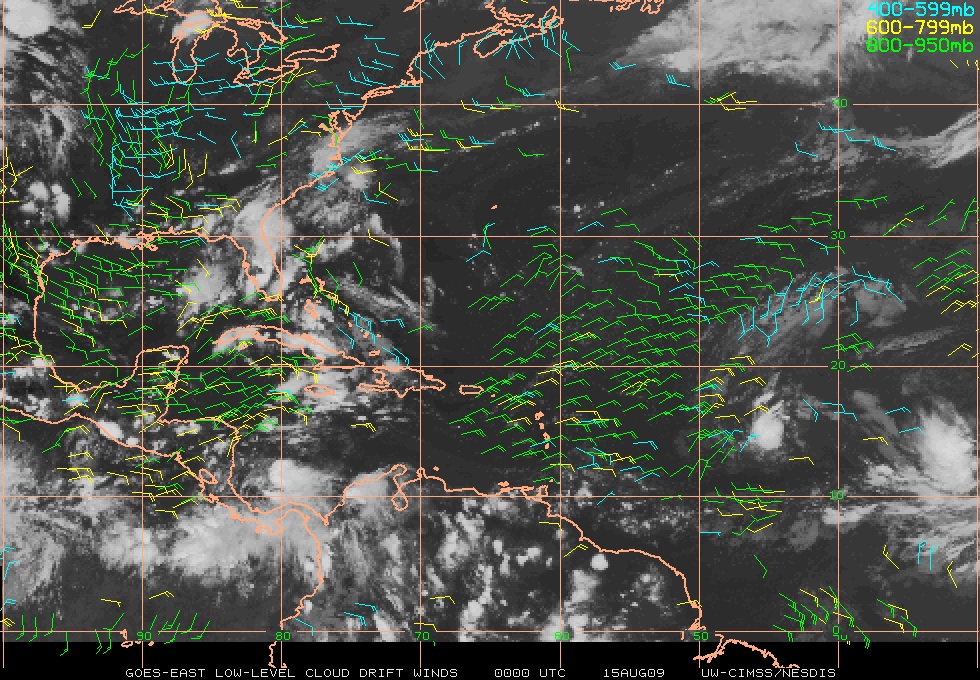
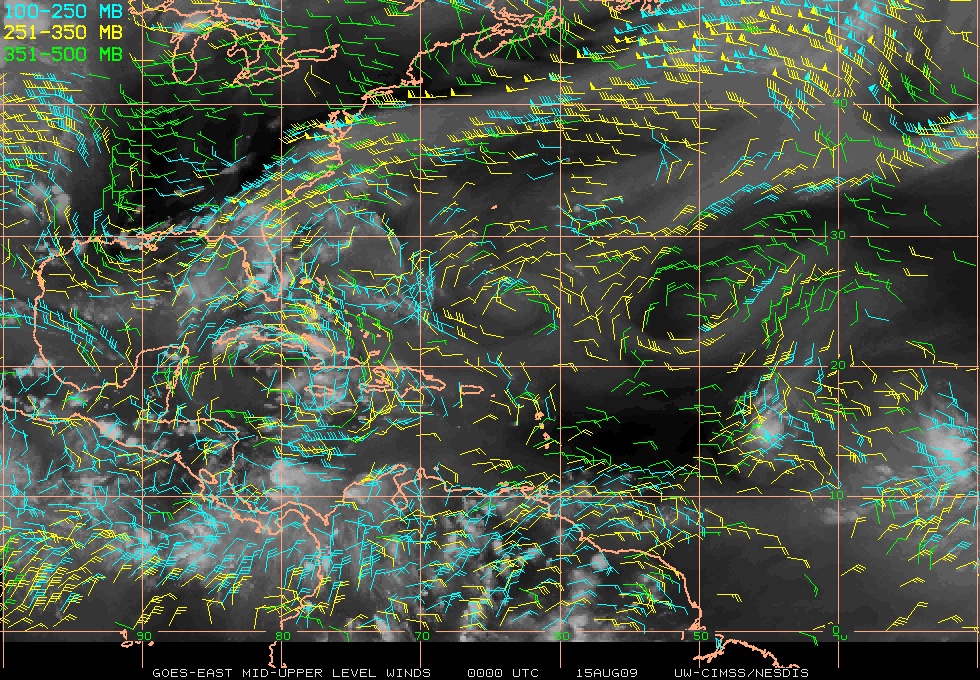
Additionally, water vapor winds and low-level cloud drift winds indicated that
much of the southwesterly shear around the storm was being enhanced by strong
(20-25 kt) ENE flow in the lower to middle levels (Fig. 4). Water vapor winds
depicted an upper-level cold low positioned ~650 nm northwest of Ex-TD 2 that
appeared to be enhancing some of the upper-level outflow on the north side of
the storm. TPW imagery also indicated that a dry SAL intrusion had advected
around the circulation from the west side of the storm around to the SW and
even SE quadrants (Fig. 2 (top), Fig. 5).
|
|
|
Fig. 3: Plots of (left) 250-850 hPa deep layer mean steering [magnitude
(direction) of the steering flow is indicated by colored shading (white
streamlines] and (right) vertical wind shear for 15 August 0000 UTC. Ex-TD 2
was located at ~14.8°N 45.3°W at this time. Images courtesy of
UW-CIMSS.
|
|
|
|
Fig. 4: Plots of (left) GOES low to mid-level cloud drift winds and (right)
mid to upper-level water vapor winds for 15 August 0000 UTC. Ex-TD 2 was
located at ~14.8°N 45.3°W at this time. Images courtesy of UW-CIMSS.
|
b) Mission Specifics
The flight plan was designed to investigate the remnants of TD 2 with targeted
sampling of two SAL air masses surrounding the storm, a dry SAL intrusion
working in to the SW and SE quadrants of the storm and the moist tropical
environment associated with the AEW (Figs. 2 & 5). TPW values of ≤45 mm
(>45 mm) were used to discern the SAL (moist tropical) environments around the
storm. The G-IV star pattern that was flown was a new flight pattern that was
designed to sample the environment surrounding the storm and the possible
penetration of that environment in toward the "inner core" region. Extra GPS
dropsonde sampling along the "radial" legs of the starfish pattern were
designed to observe this transitional environment and improve our understanding
of how the surrounding environment may or may not be impacting the "inner core"
of the storm.
Takeoff was at 1958 UTC from Barbados. The flight plan called for a clockwise
sampling of the storm at an optimal flight level of 41,000-45,000 ft. Main
targets included the SAL air mass around the eastern, northern and western
semicircles, a dry SAL intrusion wrapping around the SW and SE quadrants of the
storm, the moist tropical atmosphere close to the "inner core" region and the
transitional environment between the SAL and the "inner core" environments.
Dropsondes launched 180-300 nm northeast of the storm (drops 4a, 5 and 5a)
indicated dry SAL air from ~500-850 hPa and a 40-45 kt ESE jet near 700-725 hPa
in this region. The SAL intrusion indicated in Fig. 5 was also sampled by
drops 1a, 6a, 7, 7a, 8a and 9 with RH values as low as 15-25% from 600-850 hPa.
The dry SAL intrusion captured by drops 6a and 7a were just 165-175 nm from the
"center", indicating that the dry air had penetrated fairly close into the
storm. Dropsondes 1a and 9 also depicted very dry air above ~575 hPa. This
mid to upper-level dry air was also evident in GOES water vapor imagery and was
likely associated with subsidence.
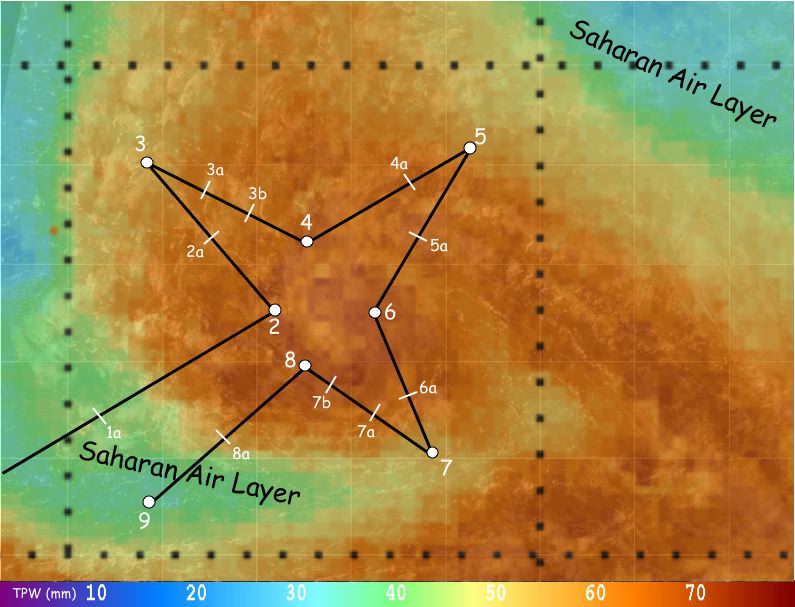
Fig. 5: TPW imagery showing Ex-TD 2 on 14 August 2100 UTC. The SAL's dry air
is indicated by values of üŌēüż45 mm (green to blue shading) in the TPW
image. The G-IV flight track (black curve) and dropsonde points (white circles
and hash marks) are overlaid for reference. Imagery courtesy of UW-CIMSS.
|
Problems :
There were no major problems related to this flight. Twenty GPS dropsondes
were deployed during the mission, one of which was a "fastfall".
Jason Dunion
10/07/2009
Mission Data :
Pressure height maps of dropsonde data
100mb map
200mb map
250mb map
300mb map
400mb map
500mb map
700mb map
850mb map
925mb map
1000mb map
surface map
Page last updated October 9, 2009
Return to Mission page.