 values (C2) average of 10 000 sample
  values
based on regression coefficients for each sample, (C3) average of five sample
values for each of 10 000 random sets of regression coefficients associated with
the 10 000 samples of C2, (C4) average of 10 000 drop-one
values estimated for each of the 10 000 samples of C2, and corresponding ratios
(C3/C2), (C4/C2), (C4/C3), and (C3/C1).
values
based on regression coefficients for each sample, (C3) average of five sample
values for each of 10 000 random sets of regression coefficients associated with
the 10 000 samples of C2, (C4) average of 10 000 drop-one
values estimated for each of the 10 000 samples of C2, and corresponding ratios
(C3/C2), (C4/C2), (C4/C3), and (C3/C1).
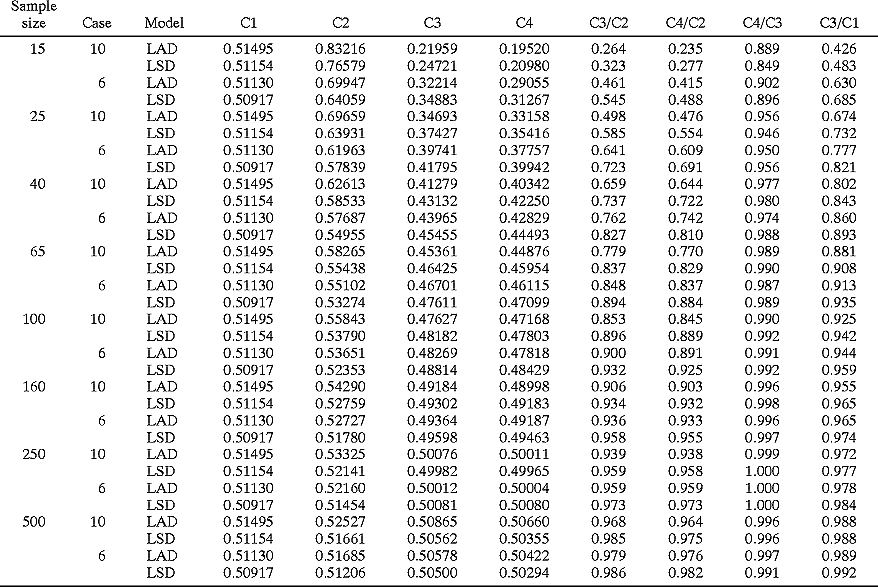
Table 2. Population 2: Contaminated population
consisting of 3998 events consisting of the initial population of 3958 events
and 40 moderately extreme events. Columns are (C1) true population
values, (C2) average of 10 000 sample
values based on regression coefficients for each sample, (C3) average of five
sample values for each of 10 000 random
sets of regression coefficients associated with the 10 000 samples of C2, (C4)
average of 10 000 drop-one values estimated
for each of the 10 000 samples of C2, and corresponding ratios (C3/C2), (C4/C2),
(C4/C3), and (C3/C1).
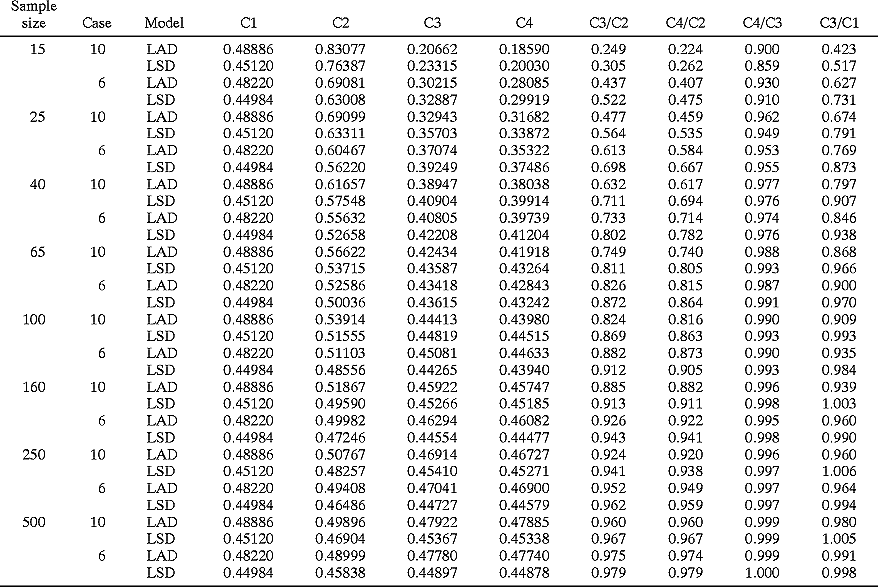
Table 3. Population 3: Contaminated population
of 3998 events of the initial population of 3958 events and 40 very extreme
events. Columns are (C1) true population
values, (C2) average of 10 000 sample
values based on regression coefficients for each sample, (C3) average of five
sample values for each of 10 000 random
sets of regression coefficients associated with the 10 000 samples of C2, (C4)
average of 10 000 drop-one values estimated
for each of the 10 000 samples of C2, and corresponding ratios (C3/C2), (C4/C2),
(C4/C3), and (C3/C1).
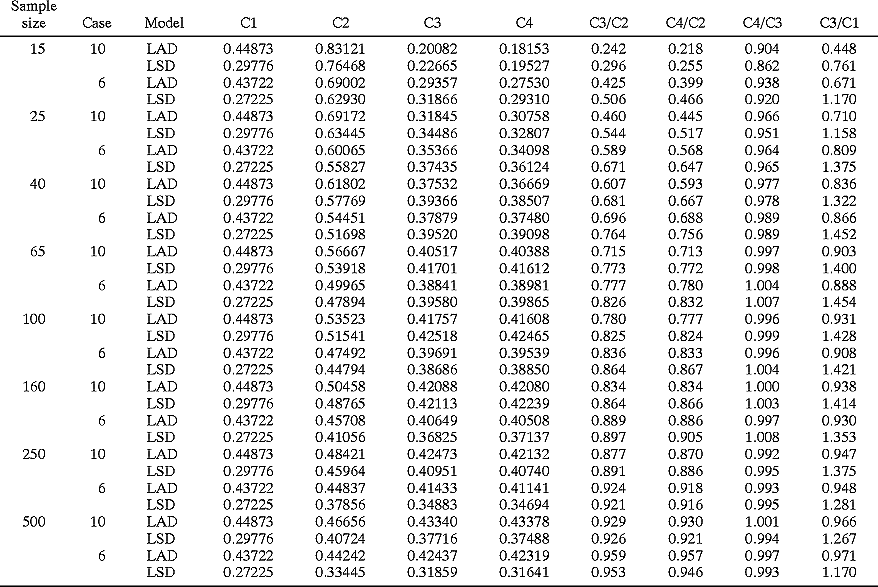
Table 4. Population 4: Contaminated population
of 4158 events of the initial population of 3958 events and 200 moderately extreme
events. Columns are (C1) true population
values, (C2) average of 10 000 sample
values based on regression coefficients for each sample, (C3) average of five
sample values for each of 10 000 random
sets of regression coefficients associated with the 10 000 samples of C2, (C4)
average of 10 000 drop-one values estimated
for each of the 10 000 samples of C2, and corresponding ratios (C3/C2), (C4/C2),
(C4/C3), and (C3/C1).
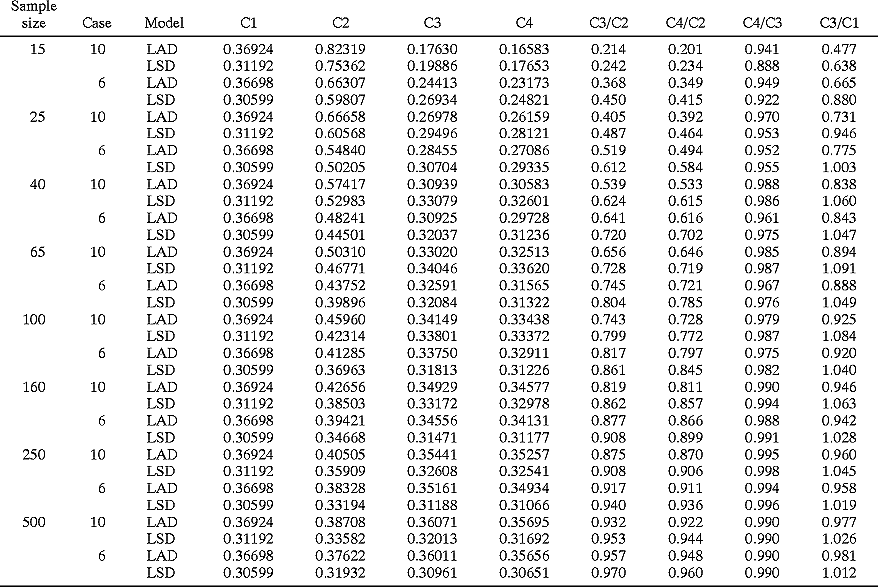
Table 5. Population 5: Contaminated population
of 4158 events of the initial population of 3958 events and 200 very extreme
events. Columns are (C1) true population
values, (C2) average of 10 000 sample
values based on regression coefficients for each sample, (C3) average of five
sample values for each of 10 000 random
sets of regression coefficients associated with the 10 000 samples of C2, (C4)
average of 10 000 drop-one values estimated
for each of the 10 000 samples of C2, and corresponding ratios (C3/C2), (C4/C2),
(C4/C3), and (C3/C1).
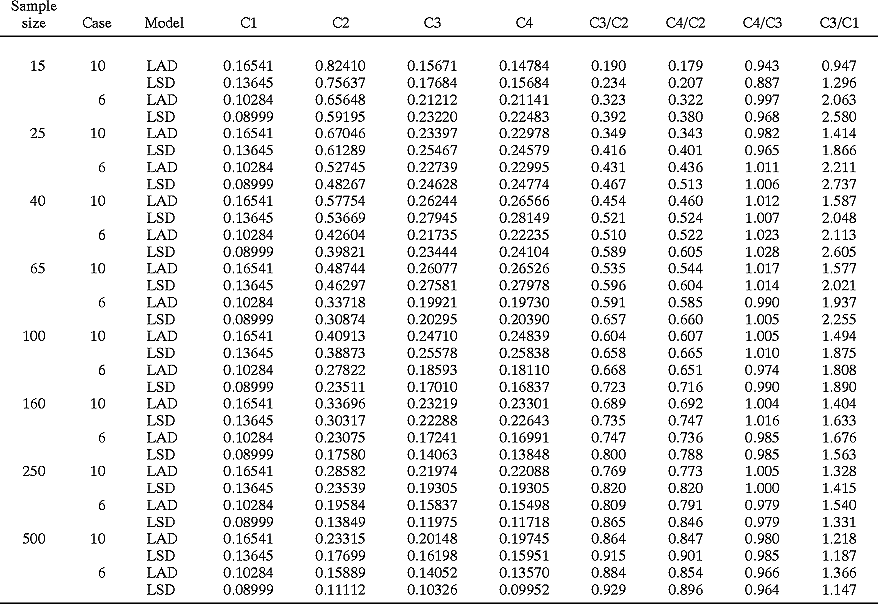
Table 6. Probability of no contaminated values in each sample of size n.
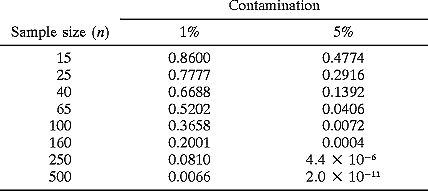
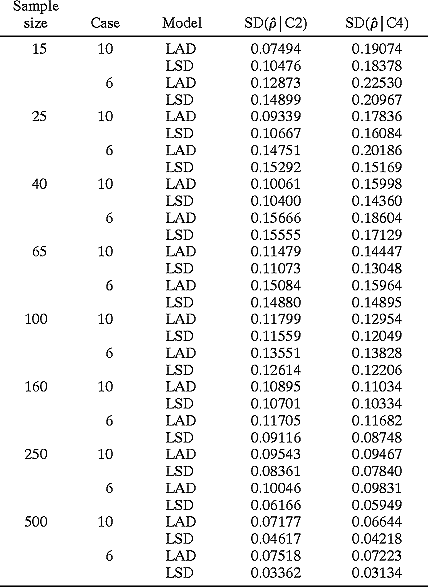
Table 7. Population 1: Initial population
consisting of 3958 noncontaminated events. The SD(|C2)
column contains the standard deviations of the 10 000
values composing each C2 value in Table 1. The SD(|C4)
column contains the standard deviations of the 10 000 drop-one
values composing each C4 value in Table 1.
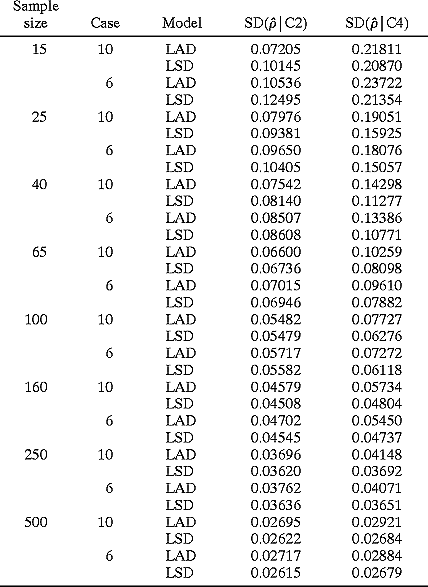
Table 8. Population 2: Contaminated population
of 3998 events consisting of the initial population of 3958 events and 40 moderately
extreme events. The SD(|C2) column contains
the standard deviations of the 10 000
values composing each C2 value in Table 2. The SD(|C4)
column contains the standard deviations of the 10 000 drop-one
values composing each C4 value in Table 2.
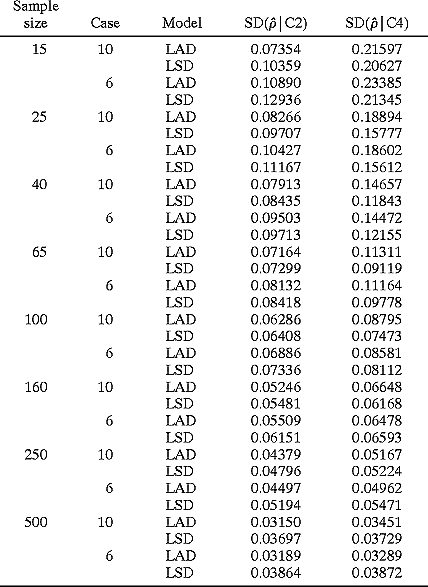
Table 9. Population 3: Contaminated population
consisting of 3998 events consisting of the initial population of 3958 events
and 40 very extreme events. The SD(|C2) column
contains the standard deviations of the 10 000
values composing each C2 value in Table 3. The SD(|C4)
column contains the standard deviations of the 10 000 drop-one
values composing each C4 value in Table 3.
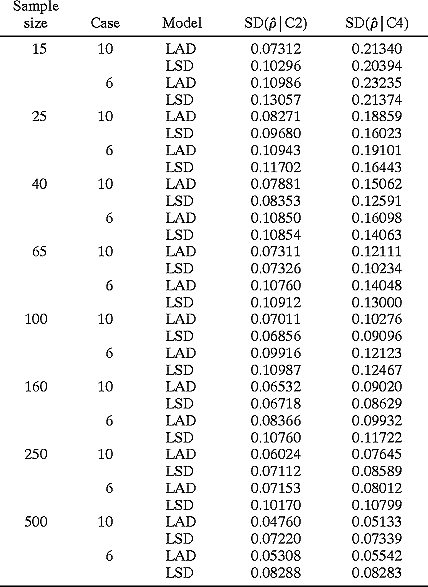
Table 10. Population 4: Contaminated population
consisting of 4158 events consisting of the inital population of 3958 events
and 200 moderately extreme events. The SD(|C2)
column contains the standard deviations of the 10 000
values composing each C2 value in table 4. The SD(|C4)
column contains the standard deviations of the 10 000 drop-one
values composing each C4 value in table 4.
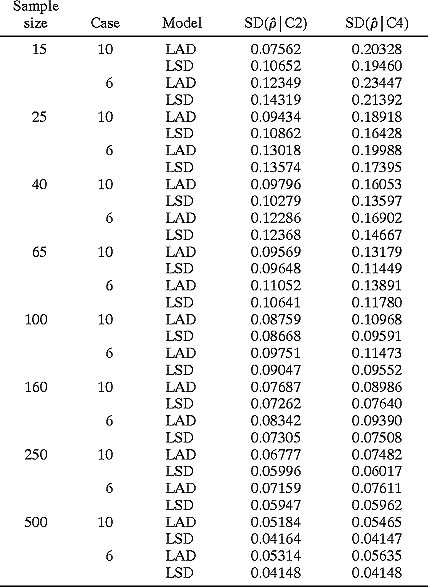
Table 11. Population 5: Contaminated population
consisting of 4158 events consisting of the initial population of 3958 events
and 200 very extreme events. The SD(|C2) column
contains the standard deviations of the 10 000
values composing each C2 value in Table 5. The SD(|C4)
column contains the standard deviations of the 10 000 drop-one
values composing each C4 value in Table 5.