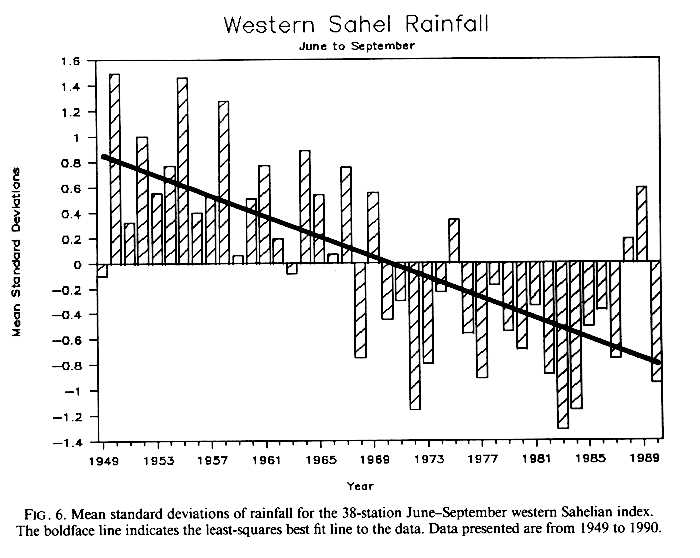
FIGURE 6
Mean standard deviations of rainfall for the 38 station June to September Western Sahel Index. The boldface line indicates the least squares best fit line to the data. Data presented are from 1949 to 1990.
Return to paper
Return to Landsea's biography