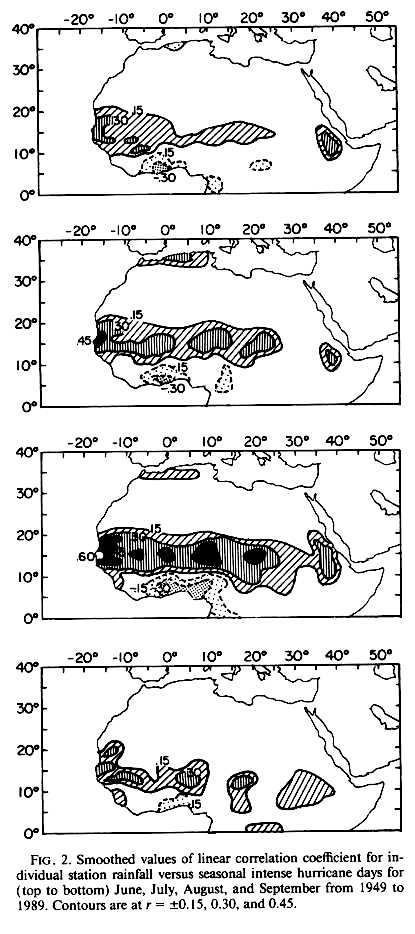
FIGURE 2
Smoothed values of linear correlation coefficient for individual station rainfall versus seasonal intense hurricane days for June, July, August, and September from 1949 to 1989. Contours are at r = ±0.15, 0.30 and 0.45.
Return to paper
Return to Landsea's biography