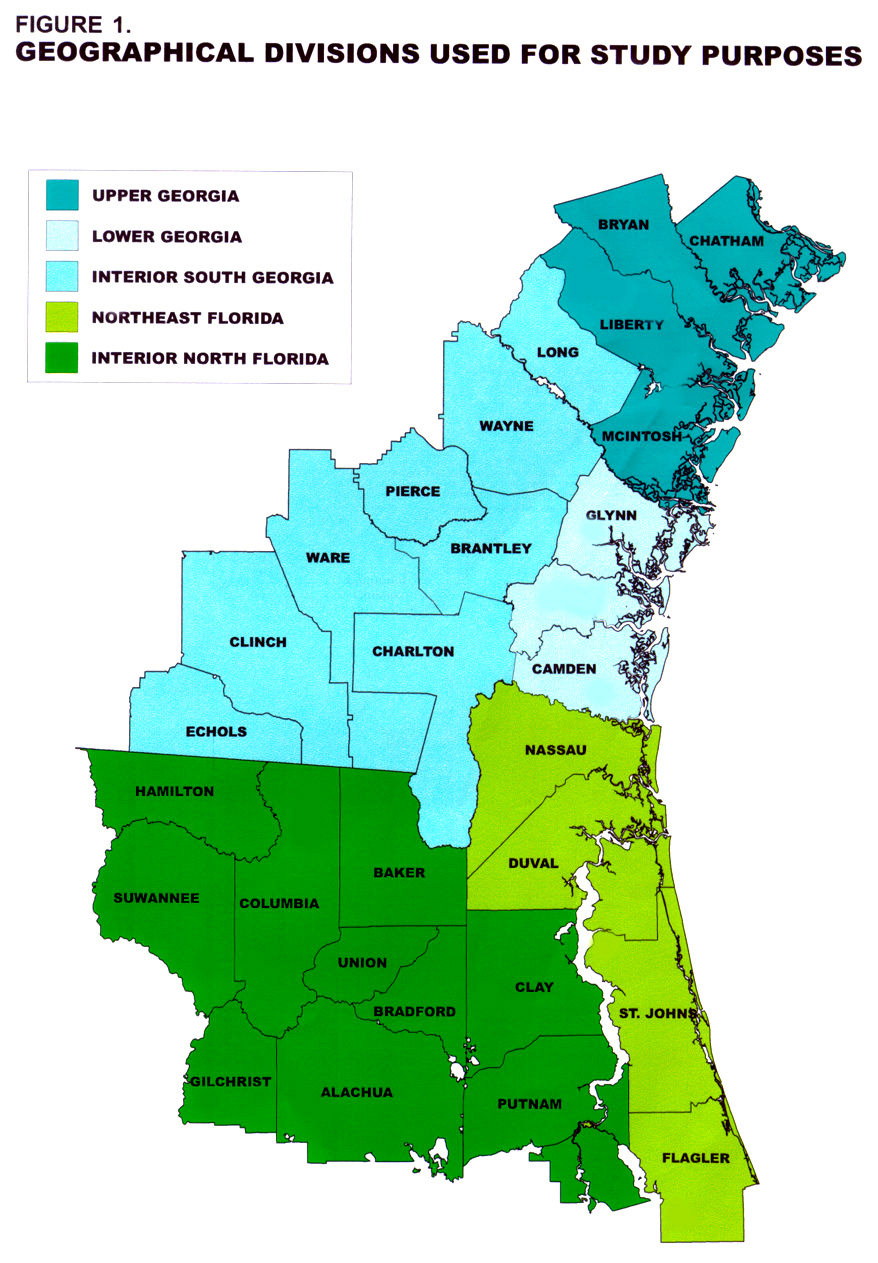
Figure 1. Geographical divisions used for study purposes. Greens indicate Northeast Florida (light green - coastal Northeast Florida, dark green - interior Northeast Florida) and blues indicate Georgia (light blue - lower Georgia, blue - interior south Georgia, dark blue - upper Georgia).
Figure 2. Timeseries of Northeast Florida hurricanes from 1565 to 1899. Green bars indicate hurricane intensity, while the red bars indicate major hurricane intensity. (Note that for the 16th through the 18th centuries, it is difficult to ascertain the actual magnitude of landfalling hurricanes.)
Figure 3. Timeseries of Lower Georgia hurricanes from 1565 to 1899.
Green bars indicate hurricane intensity, while the red bars indicate major
hurricane intensity.
Figure 4. Timeseries of Upper Georgia hurricanes from 1565 to 1899.
Green bars indicate hurricane intensity, while the red bars indicate major
hurricane intensity.
Figure 5. Timeseries of Georgia hurricanes from 1565 to 1899. Green
bars indicate hurricane intensity, while the red bars indicate major hurricane
intensity.
Figure 6. Timeseries of Northeast Florida and Georgia major hurricanes from 1800 to 2002, during the period of reliable record for the region.