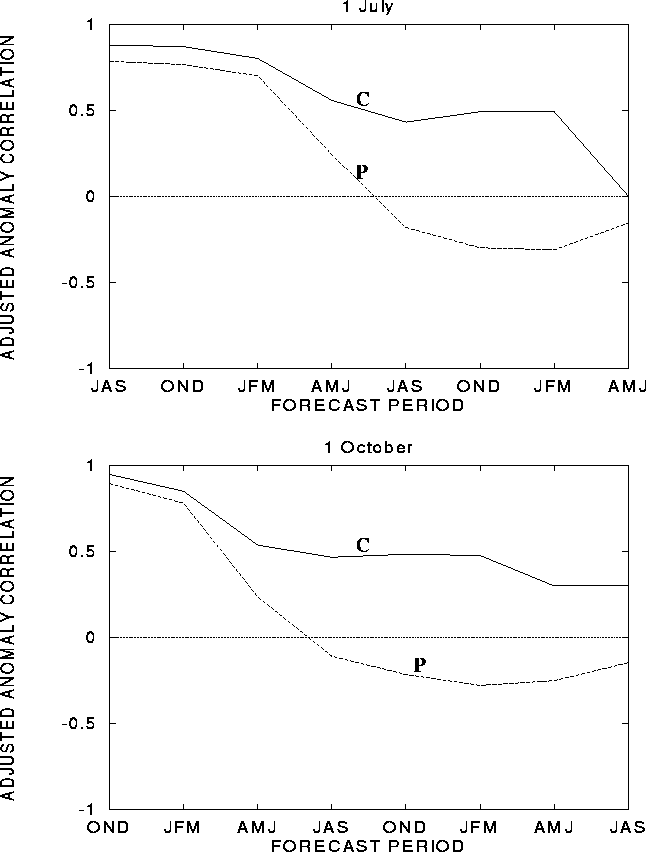
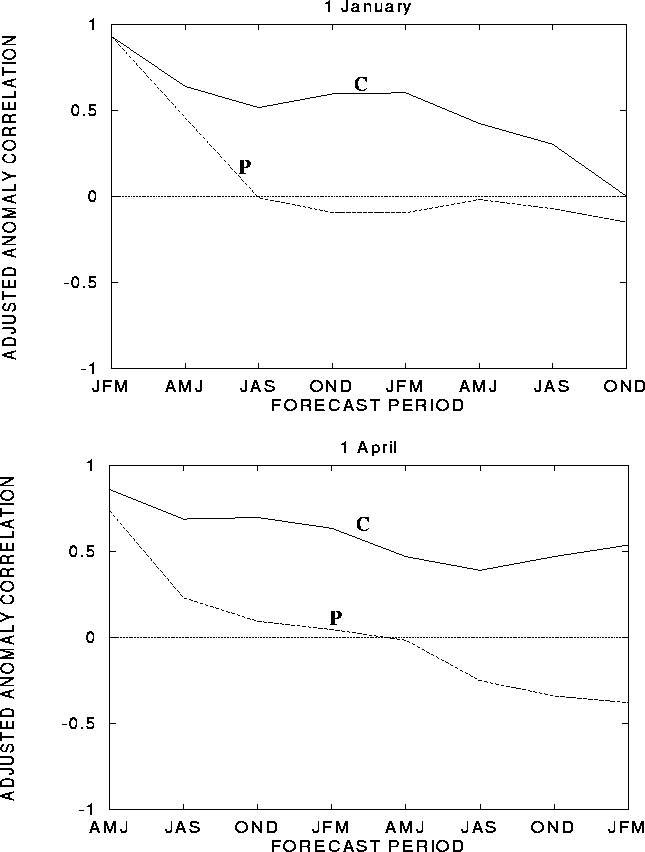
Figure 4: Adjusted anomaly correlations for the Niþo-3.4 predictands for both the ENSO-CLIPER (solid line - C) and a one month persistence forecast (dashedline - P) from lead times ranging from zero to seven seasons based upon initial forecast times of a) 1 January, b) 1 April, c) 1 July and d) 1 October.