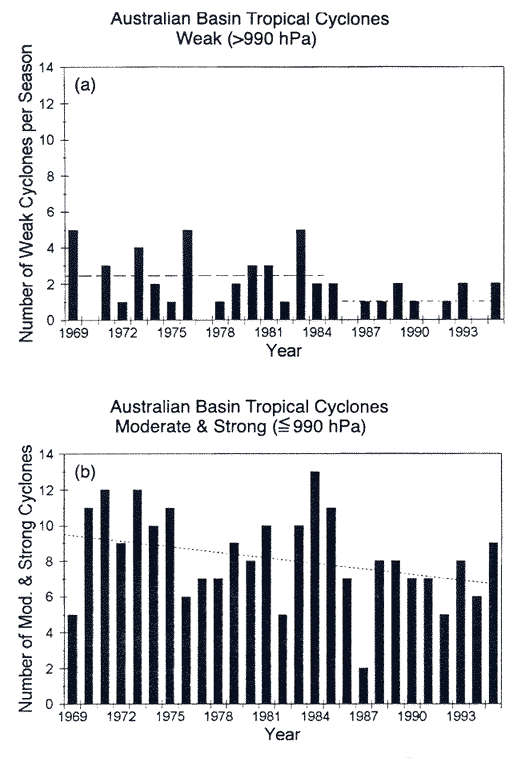
Figure 13.2: Time series (a) of the number of weak (with central pressures
not falling below 990 hPa) tropical cyclones in the Australian region
(105-160 E) and (b) the number of moderate and intense (with
central pressures
less than or equal to 990 hPa). The two dashed lines in (a) show the
1969/70-1984/85 and 1985/86-1995/96 mean values of 2.4 and 1.1,
respectively. The dotted line in (b) is the linear trend for the time
series. The cyclone season starts around November and lasts
until about May. The abscissa gives the year in which the cyclone
season starts (e.g. the 1969/70 season is plotted against "1969")
(adapted from Nicholls et al. 1998).