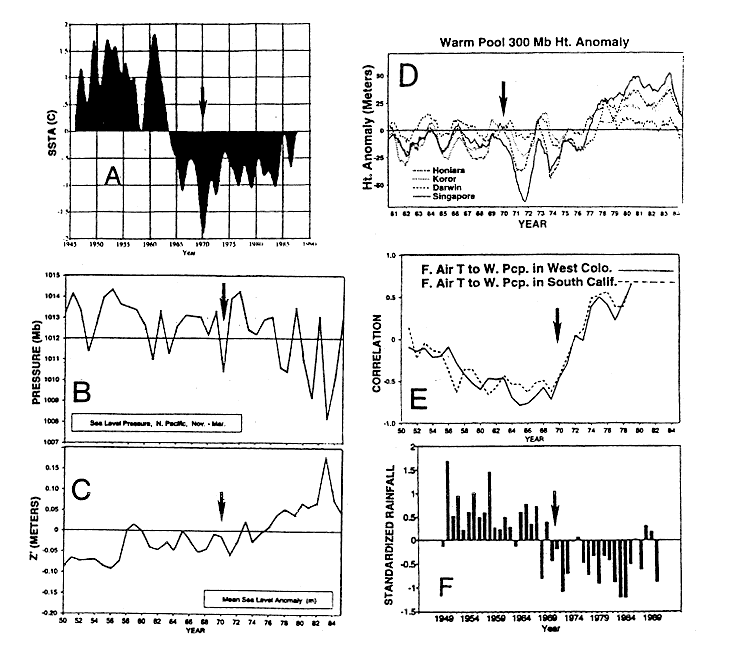
 Figure 20: A sampling of time series of climate indices illustrating
concurrent multi-decadal trends in the late 1960s and early 1970s:
As the time period represented by each panel varies, a small
reference arrow in each indicates 1970 . (Panel A) first principal
component of Atlantic zonal mean SSTs (by Kushnir; in Gordon et al. 1992; cf, Fig. 13b); (B) sea level pressure in the North Pacific (after Trenberth 1990); (C) sea level anomaly on the coast of central Chile; (D) pressure height anomalies in th
e tropical West Pacific; (E) running 10-year correlation coefficients between the primary modes of regional fall air temperature and selected winter
precipitation regimes in western North America (see Sheaffer 1993);
(F) time series of western Sahel rainfall anomalies (Gray et al.
1993a).
Figure 20: A sampling of time series of climate indices illustrating
concurrent multi-decadal trends in the late 1960s and early 1970s:
As the time period represented by each panel varies, a small
reference arrow in each indicates 1970 . (Panel A) first principal
component of Atlantic zonal mean SSTs (by Kushnir; in Gordon et al. 1992; cf, Fig. 13b); (B) sea level pressure in the North Pacific (after Trenberth 1990); (C) sea level anomaly on the coast of central Chile; (D) pressure height anomalies in th
e tropical West Pacific; (E) running 10-year correlation coefficients between the primary modes of regional fall air temperature and selected winter
precipitation regimes in western North America (see Sheaffer 1993);
(F) time series of western Sahel rainfall anomalies (Gray et al.
1993a).