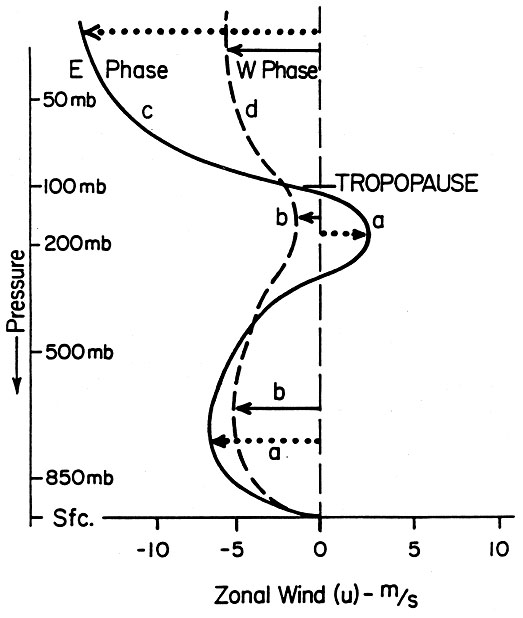
 FIG 9. Portrayal of climatological vertical profiles of zonal-wind conditions
in the tropical ( 10°- 15°N) western Atlantic and eastern Caribbean
basin from late August to early October (curve a) and of easterly QBO conditions
(curve c). The dashed line shows the favorable tropospheric zonal-wind
deviation from climatology and westerly phase QBO conditions that are required
for the most active TC seasons. Curves c and d illustrate the east- and
west-phase QBO conditions in the stratosphere [Adapted from Gray ( 1990)].
FIG 9. Portrayal of climatological vertical profiles of zonal-wind conditions
in the tropical ( 10°- 15°N) western Atlantic and eastern Caribbean
basin from late August to early October (curve a) and of easterly QBO conditions
(curve c). The dashed line shows the favorable tropospheric zonal-wind
deviation from climatology and westerly phase QBO conditions that are required
for the most active TC seasons. Curves c and d illustrate the east- and
west-phase QBO conditions in the stratosphere [Adapted from Gray ( 1990)].