Figures
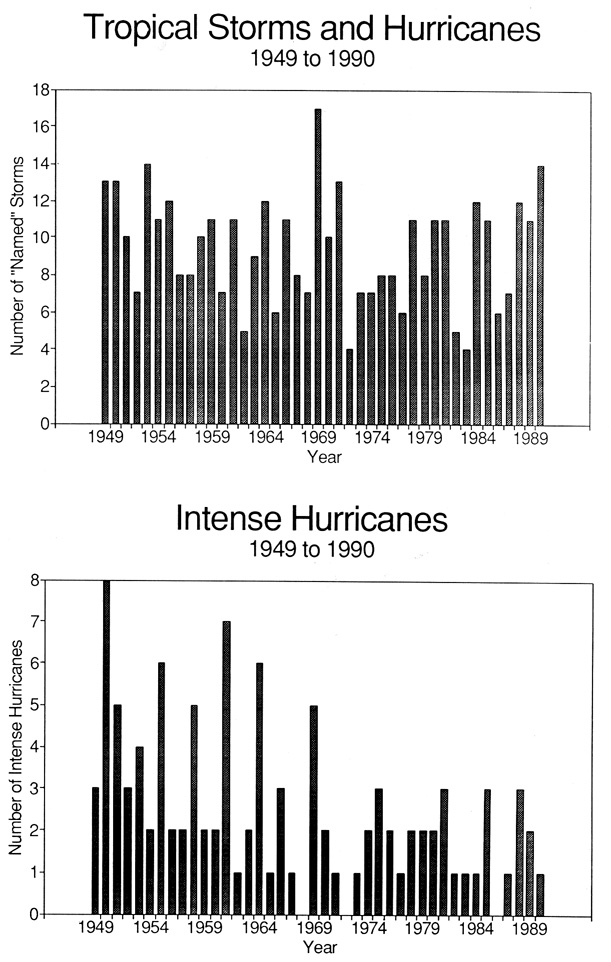
Fig. 1. Annual incidence of named storms (tropical storms and hurricanes)
versus intense-hurricane days between 1949 and 1990.
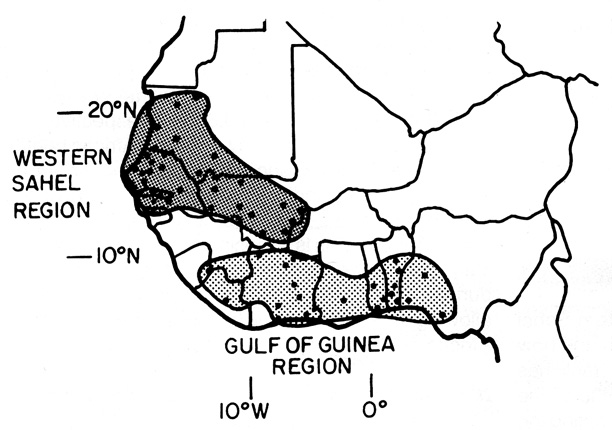
Fig. 2. Locations of 38 rainfall stations that make
up the western Sahel precipitation index, as well as the 24 Gulf of Guinea
precipitation stations. August-toNovember rainfall within the Gulf of Guinea
region shows a predictive signal for western Sahel rainfall and hurricane
activity during the following season. June-July rainfall in the western
Sahel region provides a strong predictive signal for the following Augustthrough-October
hurricane activity (see Landsea 1991).
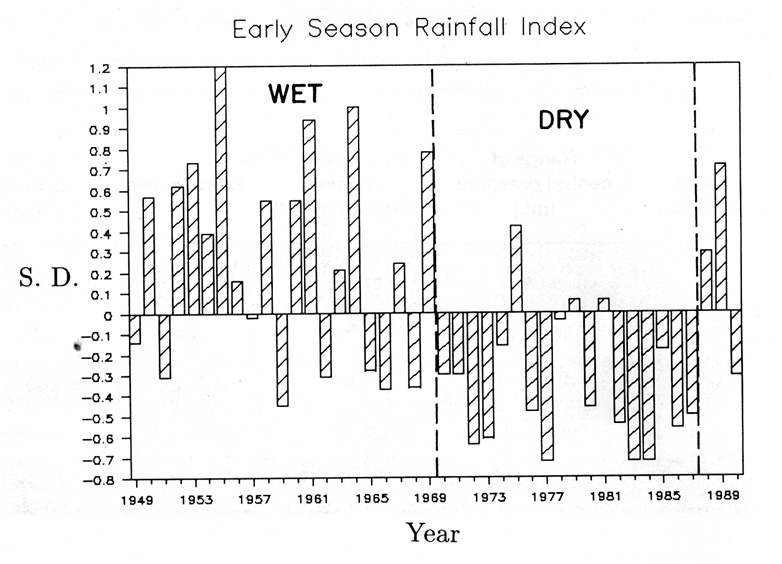
Fig. 3. Bar graph of the early-season rainfall-anomaly
index, which Includes the previous year August-November rainfall from the
Gulf ofGulnea (weighted 0.30) and June.-July western Sahel rainfall (weighted
0.70). Rainfall is expressed as standardized deviations from the 42-yr
average (from Landsea 1991).
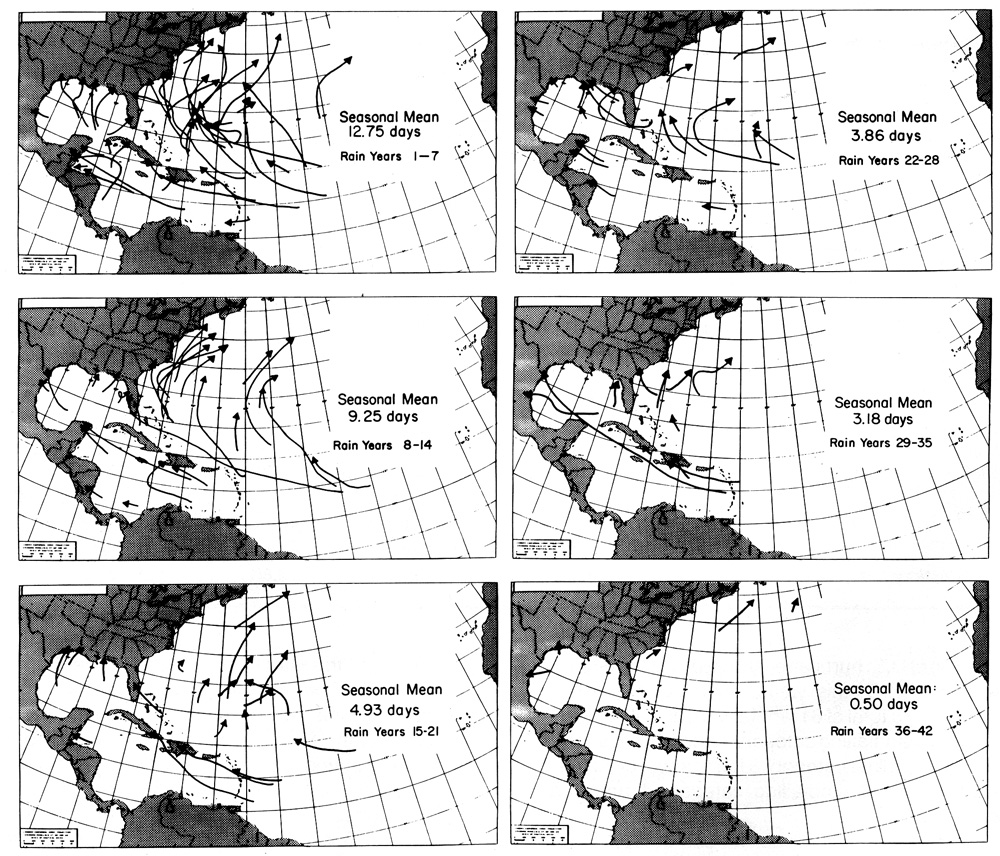
Fig. 4. Comparison of intense (category 3-5) hurricane
tracks stratified into six groups of seven years each based upon the early
season (prior to 1 August) rainfall amounts. The top left panel includes
the seven wettest individual years, and the bottom right panel is a composite
of the seven driest years. (The years included in each group are listed
in Table 5.)
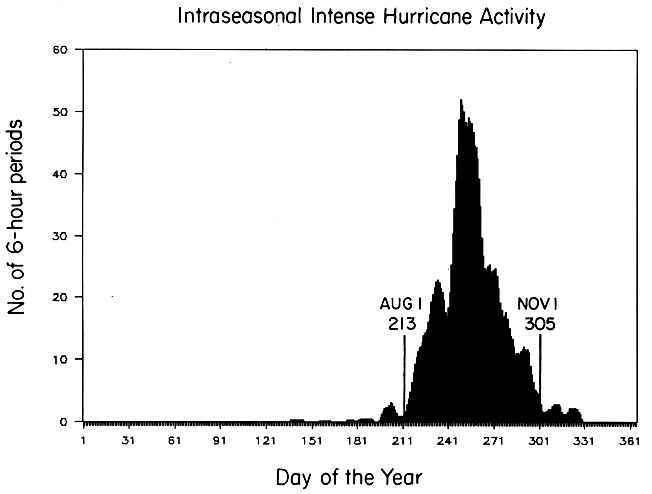
Fig. 5. Plot of Julian day versus intense-hurricane
activity (nine-day running mean) using data for 1886 through 1989. Note
that nearly all intense-hurricane activity occurs between I August and
I November.
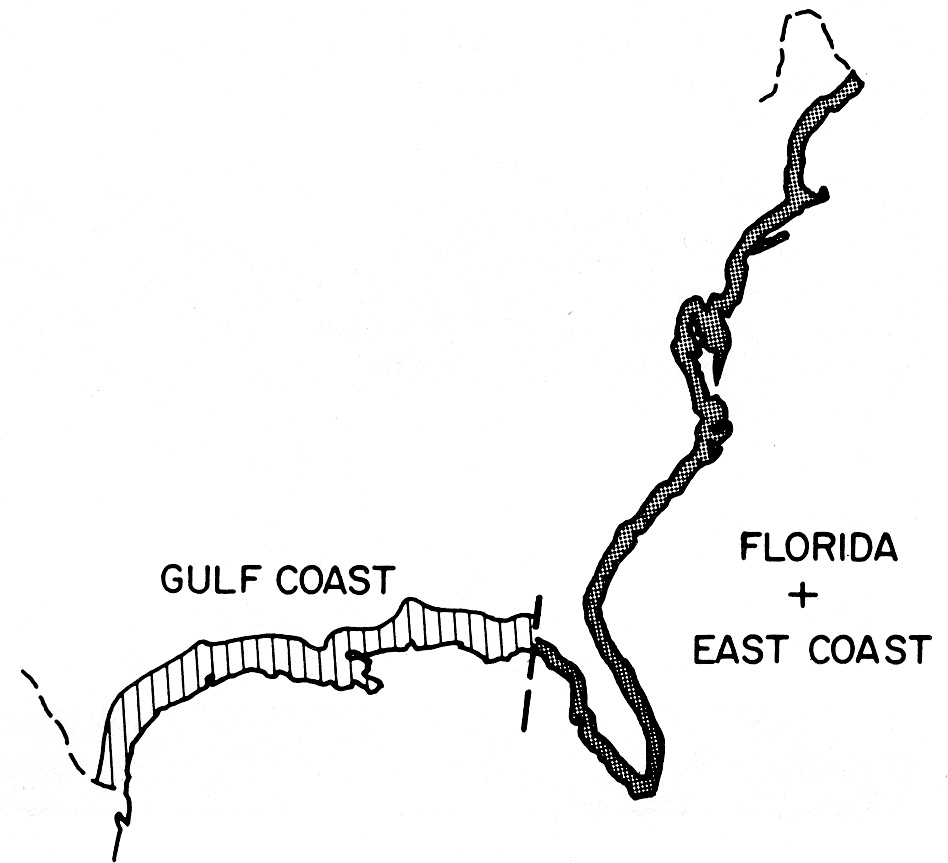
Fig. 6. Illustration of the two basic U.S. coastal regions
that are observed to have different hurricane destruction responses to
varying amounts of seasonal West African precipitation. The approximate
separation point is the Apalachee Bay at Florida (from Landsea at al. 1992).
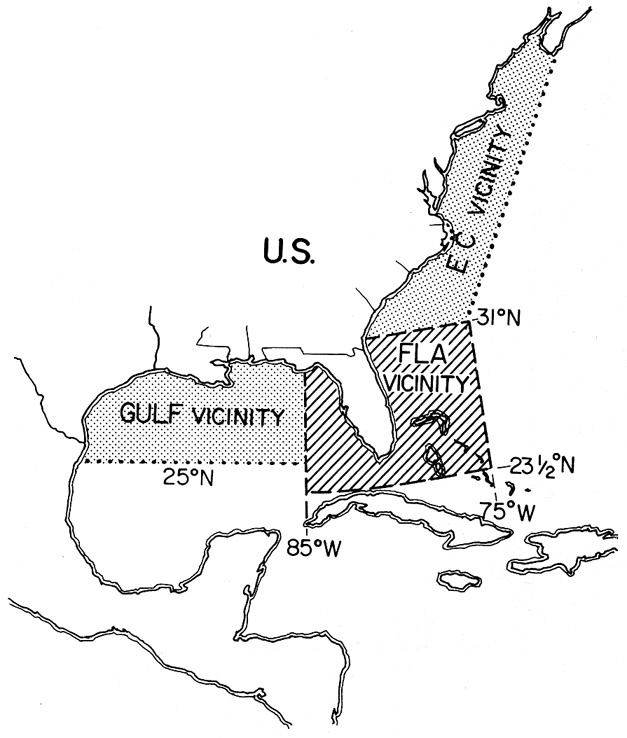
Fig. 7. Portrayal of the U. S. coastal areas designated
as in the vicinity of the Gulf Coast, vicinty of the Florida peninsula,
and the vicinity of the East Coast (EC).
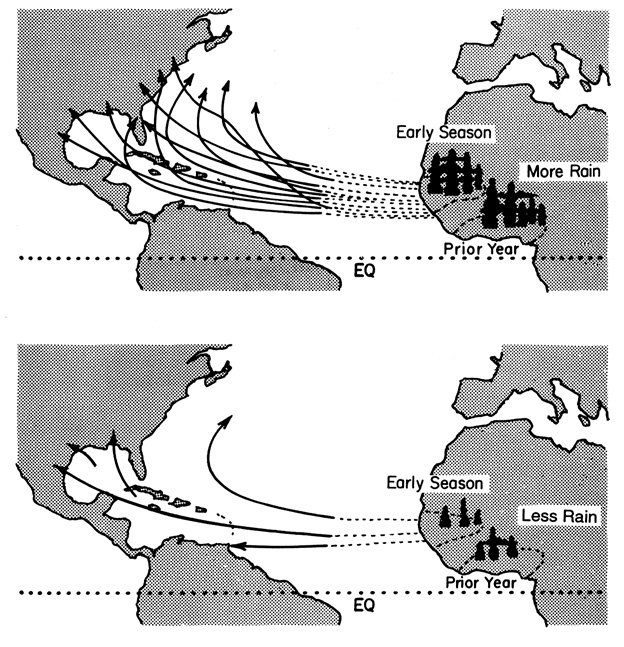
Fig. 8. Idealized rendering of the difference in
composite intense-hurricane storm tracks during three years of higher West
African rainfall amounts (top diagram) in contrast to a similar period
of lower rainfall amounts (bottom diagram). Note the lack of track difference
along the Gulf Coast, but the quite substantial difference in the western
Atlantic and along the East Coast.