(D.O.C. | NOAA | AOML | FL BAY)
 |
|
![]()
Rain drop size distributions (DSD) are a fundamental descriptor of rain in precipitation physics. They are formed by basic precipitation physics processes, and besides being important in their own right - the moments of the distributions are related to liquid water content, rainfall rate (R), radar reflectivity factor (Z), etc., the distributions give clues to the evolution of the rain and cloud systems producing them. This study is part of an attempt to utilize the WSR-88D radar data to produce a high resolution product delineating the fresh water flux input over the Florida Bay/Everglades system for ecological studies, physical evaluation, and water management planning and decisions. The study is primarily an analysis of a continuous record of disdrometer measurements at a site in the Everglades.
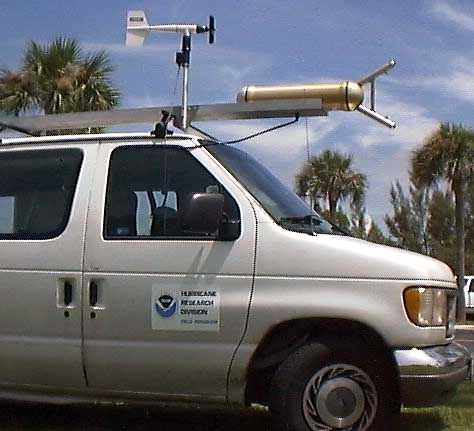
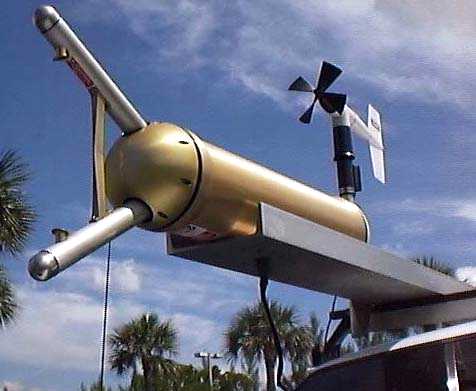
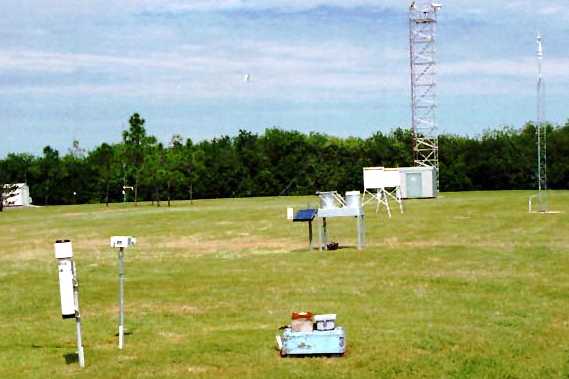
A raindrop disdrometer was operated during the 1996 rainy season at a site at the Everglades National Park Research Center located at 25.390°N, 80.681°W. A continuous record of 1-min DSDs was obtained. Also recorded at the site were a R. M. Young model 502 capacitive rain gage, and a Scientific Technologies ORG-105 optical rain gage, both providing corresponding 1-min R. A picture of the instrumentation at the site is shown in Fig. 1. The radar data used in this study are from the Miami WSR-88D KAMX located at 25.611°N, 80.413°W, and include both the WSR-88D digital precipitation array (DPA) hydrological product with a resolution of 4 x 4 km and 1 hr, and the full resolution raw level II radar data with a resolution of 1° x 1 km at 5-6 min. The data used in this study cover the period 21 May 1996 through October 1996.
 |
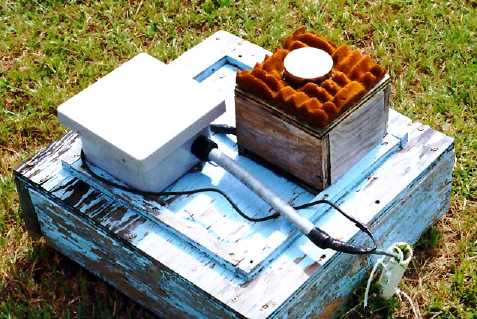 |
Fig. 1. Everglades National Park disdrometer and gage site. |
3.1 Shape and Fits of the Everglades DSD's
The large sample of 1-min DSD's were reduced, pathogens and noisy samples removed, sorted by R categories, and then mean size distributions compiled. The DSD's were further sorted into a convective and stratiform sample after the method of Tokay and Short (1996). These convective mean DSD's are shown in Fig. 2, and the matching stratiform and convective DSDs in Fig. 3a and 3b.
 |
 |
 |
| Fig. 2 Mean convective DSD sorted by R. | Fig. 3a Mean convective DSD at matching R to stratiform distributions. | Fig. 3b Mean stratiform DSD at matching R to convective distributions. |
A three parameter gamma distribution was fit to the mean distributions based on rain water content (M) in g m-3
![]()
Convective |
Stratiform (M>0.8): |
Stratiform (M<0.8): |
|
|
|
|
|
|
|
|
|
![]()
3.2 Z-R based on regression of disdrometer data
A Z-R relation was derived in the conventional manner by fitting a power law regression of Z vs. R, where both Z and R are calculated from the 1-min DSD data. This result is shown in Fig. 4. The regression relation Z=209R1.89 is fairly close (the same slope) to the Z=300R1.4 used to derive WSR-88D products. The relation Z=250R1.2, used by the National Weather Service in an attempt to improve gage - radar comparisons in tropical rain is also shown. Similarly in Fig. 5 the relation between the Z calculated from the 1-min disdrometer DSD's is regressed with the 1-min R from the capacitive rain gage, and a relation of Z=222R1.42 is derived. This relation is also fairly close to the "WSR-88D Z-R", first derived by Woodley et al. (1970) from data taken near Miami.
 |
 |
Fig. 4 Disdrometer Z vs. disdrometer R and power law fit - Z=209R1.89, the "WSR-88D Z-R" and the NWS tropical Z-R are plotted for comparison. |
Fig. 5 Disdrometer Z vs. capacitive gage one minute R, Z=222R1.42. |
![]()
3.3 WSR-88D DPA vs. 1-h gage data
The probability matching method (PMM) of Rosenfeld, et al (1993) derives a match between the cumulative distribution function (CDF) of gage R and the CDF of radar data. This approach was used for a large number of gages over Florida Bay, and the Everglades, for the May-October 1996 period. The method does not require, or force, a power-law relation. PMM was also applied to the time series of DPA Z values over each gage, and the result is shown in Fig. 6. First note that the raw data points are very tightly fit by the power law Z=331.5R1.185, even though a power law was not inherent in the method. Second, note that the relation is quite different from the Z=300R1.4, shown for comparison. The higher R are underestimated by the DPA by roughly a factor of two in this quite large sample.
 |
 |
Fig. 6 PMM match Z-R, 1 hr sfc gages vs. WSR-88D DPA - Z=331R1.185, "WSR-88D Z-R" plotted for comparison. |
Fig. 7 PMM match Z-R from full resolution raw (level II) radar data vs. disdrometer one minute R, Z=318R1.17. |
![]()
3.4 Raw radar data vs 1-min disdrometer data A smaller sample of WSR 88D data from the second elevation scan over the disdrometer site was analyzed using the PMM method. The R data are at 1-min resolution, while the radar data are instantaneous single sweeps at 5 or 6-min intervals. To remove pathogens a threshold of about 1 mm h-1 was applied to the disdrometer data, and accordingly a threshold of Z=300 mm6 m-3 was applied to the radar data. The result of this PMM match is presented in Fig. 7. The power law fit has more scatter, but the overall relation is very close to the DPA - 1 h gage result of Fig. 6. The result is sensitive to the thresholding, but the thresholds used were reasonable. The method was also applied to the raw radar data and the one minute rain rate from the capacitive rain gage. Not surprisingly, since the CDF's of the disdrometer R and the gage R are very similar, the derived Z-R (Z=318R1.17) is very close to the disdrometer result (Fig. 8). |
 |
Fig. 8 PMM match Z-R from full resolution raw (level II) radar data vs. capacitive gage one minute R, Z=316R1.18. |
![]()
3.5 Van measured surface DSD's The Particle Measuring Systems (PMS) aircraft probe (PMS-2D precip probe) has been adapted to operate on a mobile van. The instrumentation problems are being worked out, and this system appears to have considerable potential for surface DSD measurement. A representative distribution measured with this system is shown in Fig. 9.
|
 |
Fig. 9 Representative surface DSD's measured with PMS 2D-P instrument on a mobile van. |
![]()
The WSR-88D radar data severely underestimate the higher, predominantly convective, rainfall rates. This underestimate does not appear to be the case in the idealized situation, i.e. when the Z and the R are calculated, or measured from the same resolution data at the same point. Since the smoothed DPA PMM match gave nearly the same result as that of the raw, full resolution, radar data, the answer to this discrepancy appears to reside in the inherent spatial averaging of the radar beam, not in the 1-h time averaging and the spatial averaging used in the construction of the DPA. Another possible candidate explanation is that the DSD, and the associated Z-R relations, systematically change from the altitude where R can be realistically measured with a radar, and the surface where the gages are located. Work on the resolution of this discrepancy is continuing.
Tokay, A., and D. A. Short, 1996: Evidence from tropical raindrop spectra of the origin of rain from stratiform versus convective clouds. J. Appl.. Meteor., 35, 355-371.
Woodley, W. L., 1970: Precipitation results from a pyrotechnic cumulus seeding experiment. J. Appl. Meteor., 9, 242-257.
Rosenfeld, D., D. B. Wolff, and D. Atlas, 1993: General probability-matched relations between radar reflectivity and rainfall rate. J. Appl. Meteor., 32, 50-72.
UM/RSMAS/MPO Florida Bay radar-derived rainfall analyses