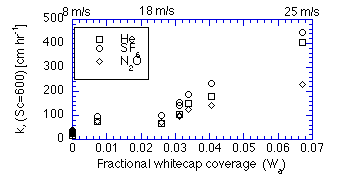
Figure 1. Gas transfer velocities normalized to Sc = 600 using k  Sc-
Sc- . With increasing
whitecapping differences
in the normalized values become large. The enhancement of gas transfer
by bubbles is inversely related to solubility.
SF
 has the largest normalized gas transfer velocity because it
has the smallest solubility; while N
 O, which has the highest
solubility, shows the lowest normalized k.

