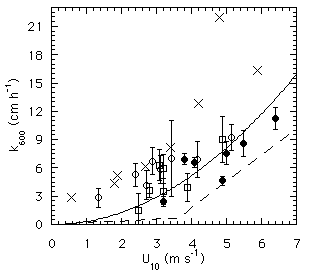
Figure 1. Relationship between gas transfer velocity, k600, and wind
speed, U , for estuaries. Open
squares = 1993 Hudson
River data; Open circles = 1994 Hudson River data; filled circles =
San Francisco Bay data (Hartman and Hammond, 1984); Crosses =
Hudson
River data (Marino and Howarth, 1993). The dashed and solid
lines are the relationships of Liss and Merlivat (1986) and
Wanninkhof (1992), respectively.

