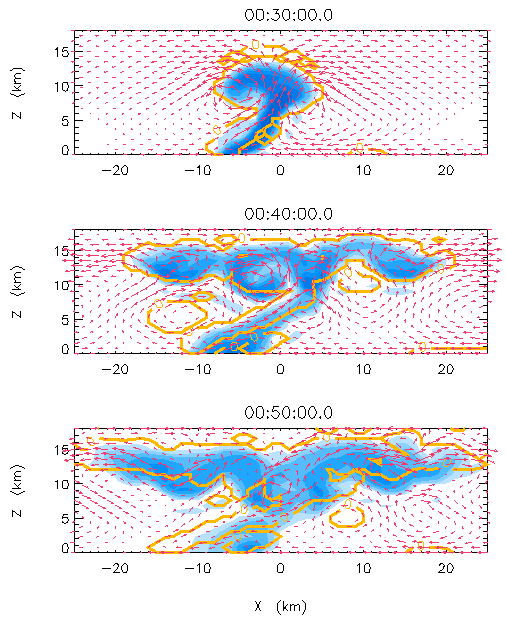
Growth of a simulated cumulonimbus at 10 minute intervals. The cloudy
areas are enclosed in black outlines. The precipitation contents (ice
above 5 km) are shown in shaded blue. The air circulation relative to
the cloud, moving to the right at 10m/s, is shown by arrows.

