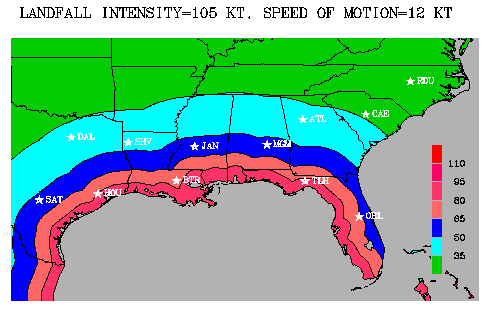
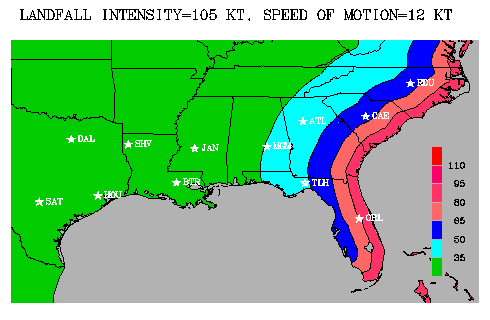
Maps of the maximum possible inland sustained wind speeds for a Gulf Coast (top) and East Coast ( bottom) landfalling hurricane with an intensity of 105 kt and a forward speed of 12 kt. These maps were produced using the inland wind decay model (IWDM) and depict the maximum sustained wind speeds that a given inland location would experience provided that the hurricane traveled the minimum distance from the coast to that location and that the storm's strongest winds passed directly over the location.