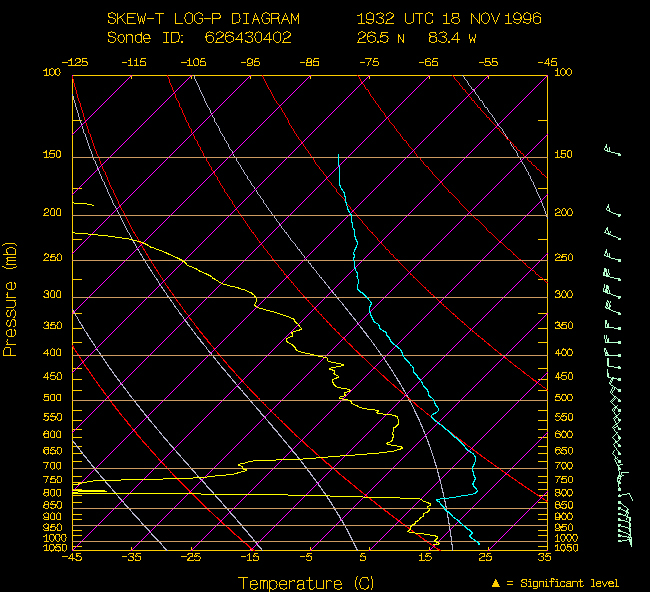
Figure caption: Sample skew-t diagram for a GPS dropwindsonde. This sonde was released
during one of the calibration flights of the G-IV. The temperature sounding is shown in cyan,
and the dewpoint temperature is shown in yellow. GPS-based winds appear along the right side
of the figure.