The%20Oleander%20Project
Ship transects
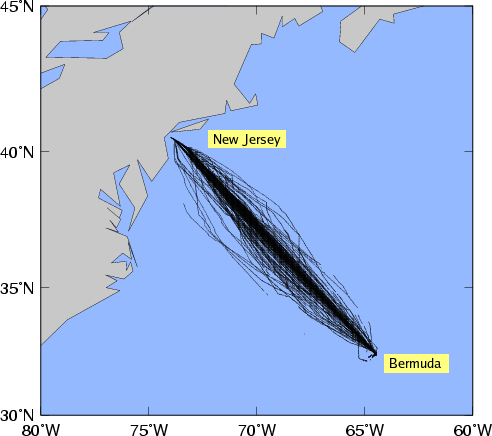
Map with the transects of MV Oleander between New Jersey and Bermuda. The thermosalinograph onboard the Oleander is maintained by NOAA/AOML.
Space-time diagram of sea surface temperature
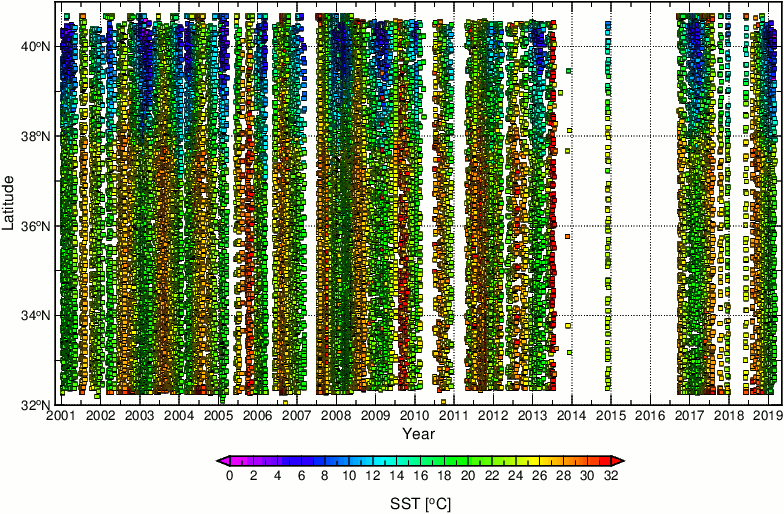
Space-time diagrams of sea surface temperature (SST) along the above transects of MV Oleander. The 5 minute quality controlled data were subsampled every 6 hours. The data gaps correspond to periods of time when the instrument was not connected since it was originally installed in support of pCO2 observations, which require a rider in the ship. The instrument was recently modified to avoid this situation.
Space-time diagram of sea surface salinity
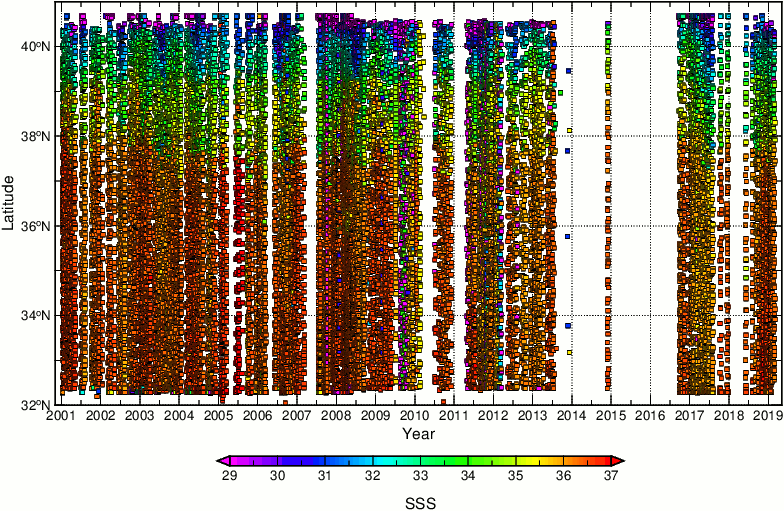
Space-time diagrams of sea surface salinity (SSS) along the above transects of MV Oleander. The 5 minute quality controlled data were subsampled every 6 hours. Sharp horizontal gradients are observed and correspond to the variability of the frontal position of the Gulf Stream. The data gaps correspond to periods of time when the instrument was not connected since it was originally installed in support of pCO2 observations, which require a rider in the ship. The instrument was recently modified to avoid this situation.