 |  |
|
Applet Usage |
| GOOS/Caribbean CoastWatch Cooperative Project NOAA/AOML |
Close Window
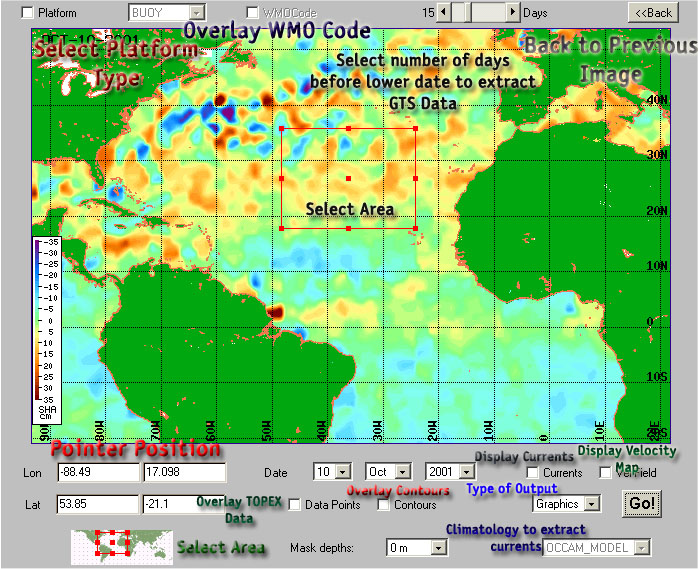
This interface displays both Near Real-Time Sea Height Anomaly (SHA) data provided by Dr. Robert Cheney (NOAA/NESDIS) and GTS data from NOAA/NOS.
Maps are generated by interpolating a 10-day period altimeter data upto the selected date. Default parameter displayed is SHA. By activating the fields labeled 'Currents' and/or 'Vel Field', Dynamic Height (DH) maps are displayed. The first field also overlays geostrophic velocity vectors ranging from 0.05 m/s to 1.5 m/s.
Data positions can be overlayed, as well as contours. The contour interval values are 10 cm for SHA, and 50 cm for DH maps.
Three different Mean Surface Heights are available:
- OCCAM_MODEL. This is from a 3 year OCCAM run driven with realistic (ECMWF) winds. OCCAM mssh errors in boundary current separation regions are removed by using climatological dynamic heights based on Levitus (Kuroshio) and Lozier (Gulf Stream) climatologies. Spatial Resolution: 0.25 degree. Additional Information: Alan Fox, Keith Haines, Beverley De Cuevas and David Webb. Altimeter Assimilation in the OCCAM Global Model, Part II: TOPEX/POSEIDON and ERS1 Data. Journal of Marine Systems, 26, 323-347, 2000.
- OCCAM_XBT. This is from a 4-year 1992-96 OCCAM run driven by ECMWF winds
and with XBT subsurface temperature data assimilated. The
assimilation of hydrographic data helps control the biases in
the OCCAM mean ssh, so no modifications are made. The mean
represents years 1993-95. Spatial Resolution: 0.25 degree. Data Source: Alan Fox, Haines and the OCCAM group.
- LEVITUS1000m. Mean Dynamic Topography relative to 1000m depth level. Spatial Resolution: 1 degree.
Acknowledgements: Thanks to Alan Fox for providing the first two datasets.
Only Topex altimeter data are displayed. The Topex "10-day cycle" is actually 9.9156 days.
Therefore, to compute time (1985 days) given the Topex cycle number, N:
T = 2822.17 + 9.9156 (N - 1)
POSEIDON altimeter cycles are not available here. Next table shows these cycles for year 2000 and 2001:
| Cycle 278 | Mar 31-Apr 10 2000 |
| Cycle 289 | Jul 18-Jul 28 2000 |
| Cycle 295 | Sep 16-Sep 26 2000 |
| Cycle 307 | Jan 13-Jan 23 2001 |
| Cycle 315 | Apr 2-Apr 12 20001 |
| Cycle 327 | Jul 30-Aug 9 2001 |
| Cycle 338 | Nov 16-Nov 26 2001 |
The GTS controls are located in the applet's upper area. Four types of GTS headers are routinely processed and ingested by the database:
- BUOY - Reports from buoy observations
- TRACKOB - Reports of marine surface observations along ship's tracks
- BATHY - Reports of bathythermal observations
- TESAC - Temperature, salinity and current reports from sea stations
The number of days before the original date shown in the bottom fields can be selected using the scrollbar control, to extract GTS data from the database.
Output type is selected using the field labeled as 'Graphics' (which is the default). The 'Go!' button launches the CGI which generates the results.
Geographic area of interest is selected interactively using the main canvas, if it is within the geographic limits of the displayed image or, it can be also selected using the lower image displaying a world map, if users prefer to move to other zones.
This applet is based on the TMAPapplet developed by Jonathan Callahan at NOAA/PMEL.
Please, address your questions or comments to Joaquin A. Trinanes
