Subsurface float data
Version number: 1.0. Created on: 9 January 2014. Most recent data included: 19 January 2002.
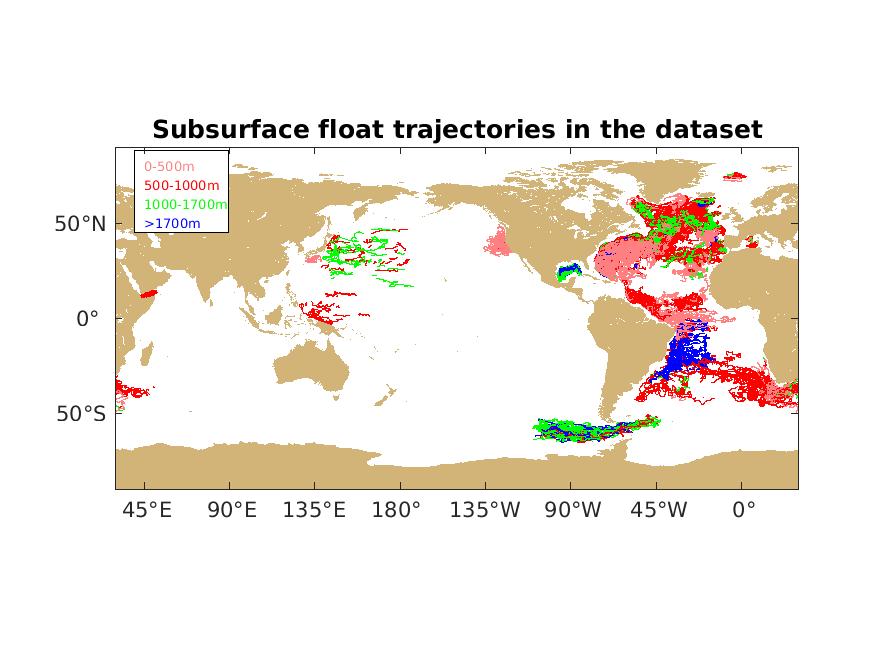
On this page, you will find a compiled data set of all subsurface float data downloaded from the WOCE Subsurface Float Data Assembly Center (WFDAC) in Woods Hole maintained by Heather Furey and copied to NOAA/AOML in October 2014. Subsequent updates will be included as additional appropriate float data, quality controlled by the appropriate principal investigators, is submitted for inclusion.
The data set is available in Matlab binary format and ASCII format, with a separate ASCII metadata file (these metadata are included in the Matlab file). The Matlab file contains the following variables:
The Matlab file also contains the following metadata entries, all with the naming convention "dir_*":
As noted in column one, the columns of the ASCII dataset are: ID, DATE (YYYY-MM-DD), TIME (HH:MM:SS), LAT, LON, PRESS, U, V, TEMP, Q_TIME, Q_POS, Q_PRESS, Q_VEL, Q_TEMP. See above for units and conventions.
The columns of the ASCII metadata file are: ID, PRINCIPAL_INVESTIGATOR, ORGANIZATION, EXPERIMENT, 1st_DATE, 1st_LAT, 1st_LON, END_DATE, END_LAT, END_LON, TYPE, FILENAME. These correspond to the dir_* variables in the Matlab file (see above).
The WFDAC had used the convention of abbreviate project name and then a number for float ID, for example "ab94". To convert this to numeric values, the alphabetic characters were each converted to a number from 01 (a) to 26 (z), a separator 00 was added to note the end of the characters, and then the number from the WFDAC was used. For example, float ab94 becomes 01 -- 02 -- 00 (separator) -- 94 -> 1020094.
The quality flags and "status" field were inherited from the WFDAC. As noted there,
An essay on the quality flags:
 *   This is an attempt to define the quality flags now associated with
 *   the FLOATER data as it is stored in the NetCDF format.  Of course the
 *   original status flags are carried along but what is desired is some
 *   more quantitative method of ascribing a quality.  It would also be
 *   useful to retain the computation method and some of the other
 *   information.  Why not just leave the old flags as that seemed to do
 *   everything?  There was, as mentioned, the ambiguity.  More importantly,
 *   as the method of instrumentation and data collection has changed
 *   through the years, the manner in which the processing is performed has
 *   also changed.  It is now possible for parameters to be measured
 *   independently and also separate from the time/position determination.
 *   We are therefore assigning a quality flag to time, position, velocity
 *   and each parameter.  The quality of the data will be assigned a value
 *   ranging from 1 (low or bad quality) to 9 (good, high quality).  This
 *   is a relative, arbitrary scale and requires mapping from the many other
 *   (fix) quality or other scales that have been or probably will come into
 *   effect.  The old FLOATER format did not generally have this quality
 *   concept as the data was often irregularly spaced, then subsequently
 *   smoothed and re-sampled.  More recently collected data is quite reg-
 *   ularly spaced, except for problems and, in the case of satellite-
 *   acquired fixes, has an attached quality indicator.  The following
 *   table indicates the proposed assignment of quality flags to give some
 *   idea of the scheme.
 *
 *   NetCDF          Floater     Old
 *   quality         (blank)    ARGOS      ARGOS
 *   ____________________________________________
 *   9 (high)
 *   8
 *   7                            1          5 (<2km)
 *   6                                       4 (<5km)
 *   5 (average)        0         2          3 (<10km)
 *   4
 *   3                                       2
 *   2                            3          1 (>10km)
 *   1 (low)
 *   0 (missing)
 *
 *   I have purposely left the higher quality flags blank to allow for the
 *   eventual inclusion of even more accurate GPS-based tracking systems
 *   such as might be used on surface drifters.  These might have RMS
 *   errors less than a kilometer or even less than 10 meters.
 *
 *   As mentioned earlier, we would also like to continue indicating how
 *   each variable was processsed.  To this end the processing status
 *   indicators are retained pretty much as defined.  In the scheme
 *   documented below the position and parameters share a common code while
 *   the velocity is conceptually the same but has a slightly more
 *   specific meaning.
 *
 *    Code     Time/Position/Parameters        Velocity
 *   _____________________________________________________________
 *      0      Missing                         Missing
 *      1      Interpolated                    Backward difference
 *      2                                      Forward difference
 *      3      Splined                         Splined
 *      4      Manual edit                     Manual edit
 *      5      Filtered (Averaged)             Filtered (Averaged)
 *              (see GLOBAL filter)             (see GLOBAL filter)
 *      9      Original value                  Original value
 *
 *   It  would be nice if these were not a whole separate field and were
 *   combined with the quality.  To achieve this the quality indicator has
 *   been scaled by a factor of 10 (the tens place) and added to the method
 *   indicator in the units place.
 *
 *   Some examples:
 *     Code 19     Poor, original value
 *          53     normal, splined
 *          61     good, interpolated
 *          73     very good, splined
 *          01     gap, interpolated
 *          00     missing value
 *
 *   Operationally, how does this get implemented?  The primary concern is
 *   not really the new ALACE/PALACE data as that is going directly to the
 *   NetCDF format and retains engineering parameters, etc.  We are trying
 *   to establish a format that con be used for the conversion of all the
 *   old RAFOS, SOFAR and other floater or drifter format.  Thus, where
 *   there was no quality (blank in column 36) an average value should be
 *   assigned.  Of course where data was missing and interpolated or
 *   resampled we have no way of knowing what the original quality was
 *   so it will have to be assumed average.  Likewise for filling in a
 *   missing value, where the previous point may be bad and the following
 *   point excellent;  there is no quantitative way of determining the
 *   quality.
 *
 *   The problem of gaps are a little different.  Gaps arose originally
 *   because an instrument was 'lost' or a parameter sensor 'dropped out'.
 *   These were originally just noted in the processing,  and in some cases
 *   the float was divided into segments.  Later, when the data transmission
 *   method changed, a flag was added to indicate there was a gap greater
 *   than some threshold (see GLOBAL gap_flag_days) and the values were
 *   subsequently filled in.  These will be noted by the quality flag being
 *   0;  thus gaps that are completely missing will be value 00, while
 *   gaps that have been filled in will have values like 01, 03 or 04.
 *   Note that in terms of quantitative value the leading zeros are
 *   superfluous.  Legitimate values will therefore always have a value
 *   > 10, the higher the number, up to 99, the better the quality.