Effects of Synoptic Surveillance on model forecasts for
21 September 2005 1200 UTC
Rita.
Quicktime movie of AVN DLM wind model
forecast
Quicktime movie of DLM wind data
increment
| TRACK (km) | ||||||||||||||||||||||||||||||||||||||||||||||||||||||||||||||||||||||||||||||||||||||||||||||||||||||||||||||||||||||||||||||||||||||||||||||||||||||||||||||||||||
| MODEL | 12 h | 24 h | 36 h | 48 h | 60 h | 72 h | 84 h | 96 h | 108 h | 120 h
| AVNN | 46 | 74 | 120 | 164 | 208 | 275 | 388 | 529 | 746 |
| AVNO | 42 | 69 | 89 | 166 | 213 | 246 | 369 | 542 | 764 |
| %IMP | 9% | 7% | 26% | -1% | -2% | 11% | -5% | -2% | -2% |
| GFNO | 40 | 101 | 146 | 202 | 213 | 264 | 361 | 499 | 676 |
| GFDL | 62 | 119 | 141 | 200 | 201 | 256 | 331 | 477 | 705 |
| %IMP | -55% | -17% | 3% | 1% | 6% | 3% | 8% | 4% | -4% |
| INTENSITY (kt)
| MODEL | 12 h | 24 h | 36 h | 48 h | 60 h | 72 h | 84 h | 96 h | 108 h | 120 h
| AVNN | -103 | -91 | -71 | -58 | -44 | -2 | 0 | -3 | -4 |
| AVNO | -97 | -83 | -55 | -45 | -25 | 23 | 8 | 9 | -1 |
| %IMP | 6% | 9% | 23% | 22% | 43% | -1050% | und% | -200% | 75% |
| GFNO | -45 | -25 | -9 | -6 | -5 | 22 | 9 | -1 | 5 |
| GFDL | -56 | -38 | -8 | -3 | -2 | 13 | 5 | -1 | 14 |
| %IMP | -24% | -52% | 11% | 50% | 60% | 41% | 44% | 0% | -180% |
| | ||||||||||
| 24/0730 UTC 29.7N 93.7W between Johnson's Bayou, LA, and Sabine Pass 67.5 h into the forecast | |||||||||||||||||||||||||||||||||||||||
| MODEL | LAT | LON | TIME | ERROR | LOCATION
| AVNN | 28.66 | 95.82 | 74.0 | 235.9 | Matagorda, TX
| AVNO | 28.83 | 95.42 | 74.5 | 193.3 | Freeport, TX
| %IMP | -7% | 18%
| GFNO | 28.65 | 95.93 | 68.5 | 245.8 | Matagorda, TX
| GFDL | 28.68 | 95.75 | 66.0 | 229.7 | Matagorda, TX
| %IMP | -50% | 7%
| | ||||
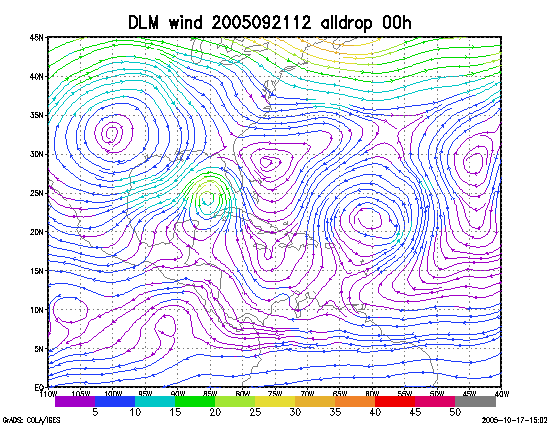
Figure 1. NCEP 850 - 210 hPa mean wind analysis for 21 September 2005 1200 UTC (Hurricane Rita).
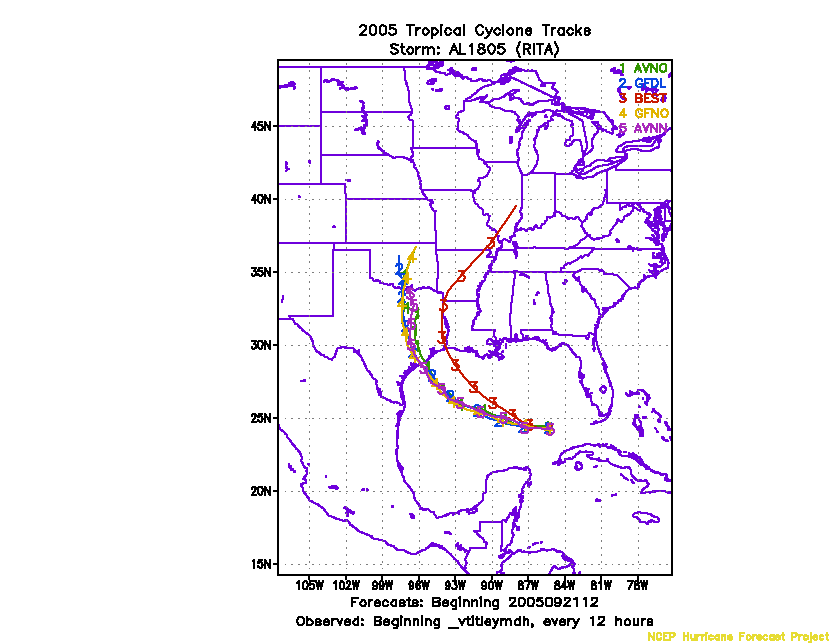
Figure 2. Track forecasts for the no dropwindsonde (NO or NN) and the all dropwindsonde (AL) runs for the AVN and GFDL models initialized on 21 September 2005 1200 UTC.
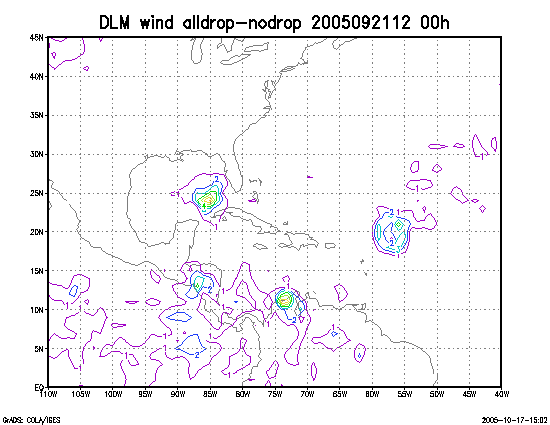
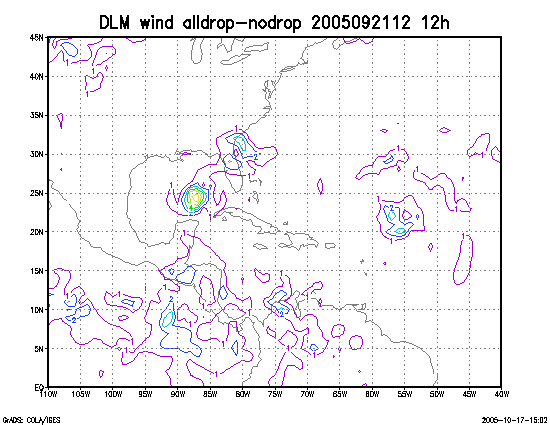
Figure 3. Initial condition differences in the 850 - 210 hPa mean wind between the no and all dropwindsonde cases for 21 September 2005 1200 UTC.