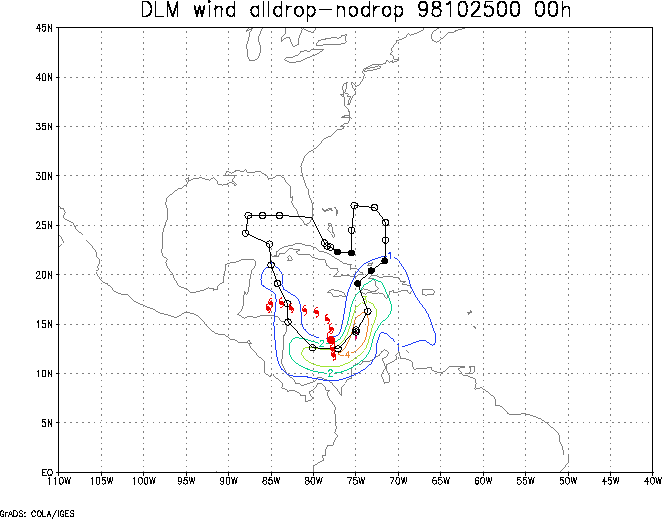
 Fig. 6
Initial condition differences in the vertically averaged 850 - 200
hPa winds between the GSNO and GSAL cases, 25 October 1998 0000 UTC.
The large hurricane symbol is the location of Hurricane Mitch at
the nominal time. The small hurricane symbols are the locations of
Mitch every 12 h previous and after the nominal time. The black
dots represent the locations of targeted dropwindsonde
observations; open circles represent the remaining observations.
Fig. 6
Initial condition differences in the vertically averaged 850 - 200
hPa winds between the GSNO and GSAL cases, 25 October 1998 0000 UTC.
The large hurricane symbol is the location of Hurricane Mitch at
the nominal time. The small hurricane symbols are the locations of
Mitch every 12 h previous and after the nominal time. The black
dots represent the locations of targeted dropwindsonde
observations; open circles represent the remaining observations.
Return to Mitch 1 assessment page
Return to main assessment page