| Overview and procedures | 
|

| Overview and procedures | 
|
In the original HRD synoptic flow experiments, the tropical cyclones were located relatively close to the continental United States, allowing for a relatively uniform sampling around the storms. The sampling strategy was to mimic the regular rawinsonde network over the North American continent in all quadrants of the cyclone environment. If this was impossible due to logistical constraints, sampling occurred mainly to the northwest of the storm center, since Franklin and DeMaria (1992) found that observations in the front semicircle of the cyclone were more effective in improving barotropic model forecasts than those in the rear semicircle.
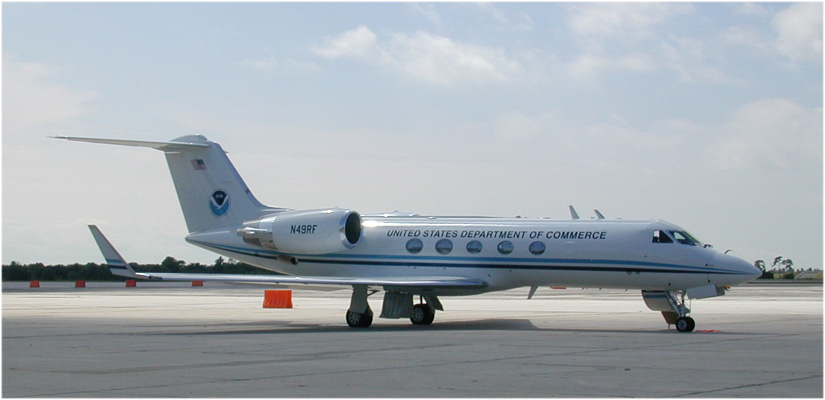
 During each mission, the G-IV released about 30 dropwindsondes
to sample the atmosphere at and below the flight level near 150
hPa at approximately 150 - 200 km intervals. The aircraft did
not penetrate the inner core of any of the tropical cyclones.
HRD meteorologists on board the aircraft validated the wind and
thermodynamic data and generated standard messages for
transmission to NCEP for assimilation into numerical models. In
some missions, one or two of the NOAA P3 aircraft also dropped
approximately 30 dropwindsondes each in the environment and
inner core of the tropical cyclone from the flight level
near 400 hPa at approximately the same intervals.
To assess the impact of the dropwindsonde observations, the current operational version of the NCEP Global Data Assimilation System (GDAS) was used. The GDAS is composed of a quality control algorithm, a synthetic data procedure for tropical cyclones, an analysis procedure, and the Global Spectral Model (GSM). The quality control involves optimal interpolation and hierarchical decision-making to evaluate the observations before input to the analysis ( Woollen 1991). The synthetic data procedure (Lord 1991) creates observations representative of the tropical cyclone at mandatory levels between 1000 and 300 hPa within 300 km of the storm center, using operationally estimated intensity and position inputs from TPC and nearby observations. The analysis scheme is the spectral statistical interpolation (SSI) ( Parrish and Derber 1992): the background field (the previous 6 h forecast) is combined with observations using a three-dimensional variational multivariate formalism. The forecast model's horizontal resolution is spectral triangular 126 (T126) with a Gaussian grid of 384 x 190, or approximately 1° latitude/longitude grid spacing, and the vertical coordinate extends from the surface to about 2.7 hPa with 28 unequally spaced sigma levels on a Lorenz grid. Details can be found in Kanamitsu (1989), Kanamitsu et al. (1991), and Kalnay et al. (1990).
Burpee et al. (1996) evaluated the impact of ODWs from the HRD synoptic flow experiments using three dynamical models: the Geophysical Fluid Dynamics Laboratory (GFDL) model ( Bender et. al 1993), the HRD barotropic model (VICBAR) (Aberson and DeMaria 1994), and the NCEP Global Spectral Model (GSM) ( Lord 1993). The current versions of these same three models are used in the present study. The GDAS analysis is the direct input to the GSM, whereas VICBAR and GFDL modify the analysis near the storm with their own vortex specification schemes. Both the GFDL and VICBAR models use global GSM forecast fields as boundary conditions for the duration of the forecast. Neither of these directly ingest the dropwindsonde observations. Only the GFDL model provides both track and intensity forecasts.
This impact study represents part of a larger effort to investigate optimal design of the G-IV missions using targeted observing strategies (Aberson 1998b). To this end, a number of minor modifications were made to the operational procedures. First, postprocessed dropwindsonde observations (Hock and Franklin 1998) were used, including observations that might not have been received operationally usually due to partial dropwindsonde failures). Dropwindsonde data are processed on the aircraft before being transmitted. This processing includes automatic and manual flagging of erroneous data, interpolation where data are missing, and filtering. Identical methods are used for post-processing, though more time is available to examine and correct errors that may have been undetected or, more often, considered to be insignificant operationally. Also, during post-processing, other data sources (rawinsondes, ships, drops from other aircraft, etc.) permit a more thorough assessment of data quality. Second, all dropwindsonde observations were assimilated into the GDAS at the nominal synoptic time of the mission, for consistency with previous studies and to reduce the computing requirements. Furthermore, all dropwindsonde observations were excluded from the data assimilation for at least 24 h before each nominal time due to serial correlation of tropical cyclone track forecasts (Aberson and DeMaria 1994). Assessment of follow-on missions are therefore conducted as though the previous missions had not occurred.
In each case, all observations (other than the dropwindsondes) from the NCEP "final" archive were included in GDAS. At least three runs of each model were then made for each mission. The first utilized none of the dropwindsonde observations; the second utilized all of the observations; and the third simulated releasing dropwindsondes from the P3 aircraft instead of the G-IV. In this last set of runs, only observations below 500 hPa were included in the first half of the flight, and below 400 hPa during the second half, to simulate the increased ceiling of the P3 as fuel is consumed over the course of the mission. Any gain from the new upper-tropospheric observations was thus evaluated.