Effects of Synoptic Surveillance on model forecasts for
21 September 2002 0000 UTC
Isidore.
Quicktime movie of AVN DLM wind model
forecast
Quicktime movie of DLM wind data
increment
| TRACK (km) | ||||||||||||||||||||||||||||||||||||||||||||||||||||||||||||||||||||||||||||||||||||||||||||||||||||||||||||||||||||||||||||||||||||||||||||||||||||||||||||||||||||||||||||||||||||||||||||||||||||||||||||||||||||||||||||||||||||||||||||
| MODEL | 12 h | 24 h | 36 h | 48 h | 60 h | 72 h | 84 h | 96 h | 108 h | 120 h
|
| AVNN | 67. | 72. | 83. | 117. | 269. | 388. | 433. | 502. | 486. | 440.
| AVNO | 61. | 47. | 72. | 78. | 102. | 179. | 244. | 341. | 389. | 388.
| %IMP | 9% | 35% | 13% | 33% | 62% | 54% | 44% | 32% | 20% | 12%
|
| GFNO | 53. | 31. | 15. | 84. | 137. | 145. | 126. | 166. | 289. | 308.
| GFAL | 69. | 54. | 73. | 153. | 241. | 287. | 252. | 249. | 395. | 500.
| %IMP | -30% | -74% | -387% | -82% | -76% | -98% | -100% | -50% | -37% | -62%
|
| AVNN | -71. | -81. | -80. | -70. | -22. | 11. | -3. | 2. | 1. | -7.
| AVNO | -48. | -57. | -53. | -43. | -14. | 13. | -1. | 7. | 11. | 19.
| %IMP | 32% | 30% | 34% | 39% | 36% | -18% | 67% | 250% | -1000% | -171%
| INTENSITY (kt)
| MODEL | 12 h | 24 h | 36 h | 48 h | 60 h | 72 h | 84 h | 96 h | 108 h | 120 h
|
| GFNO | 6. | -3. | -3. | 11. | 48. | 71. | 63. | 66. | 65. | 57
| GFAL | 1. | 3. | 5. | 22. | 55. | 80. | 56. | 39. | 30. | 17.
| %IMP | 83% | 0% | -67% | -100% | -15% | -13% | 11% | 31% | 54% | 70%
|
| SHNO | -15. | -21. | -18. | -2. | 44. | 72. | 59. | 58. | 57. | 51.
| SHIP | -14. | -21. | -16. | 0. | 46. | 74. | 62. | 62. | 61. | 53.
| %IMP | 7% | 0% | 11% | 100% | -5% | -3% | -5% | -7% | -7% | -4%
|
| DSNO | -15. | -21. | -18. | -2. | 44. | 72. | 59. | 58. | 57. | 51.
| DSHP | -14. | -21. | -16. | 0. | 46. | 74. | 62. | 62. | 61. | 53.
| %IMP | 7% | 0% | 11% | 100% | -5% | -3% | -5% | -7% | -7% | -4%
| | ||||||||||
| 22/2100 UTC 21.3N 89.3W Puerto Telchac, Yucatan, Mexico 45 h into the forecast | |||||||||||||||||||||||||||||||||||||||||||||||||||||||||||||||||||||||||||||||||||||
| MODEL | LAT | LON | TIME | ERROR | LOCATION
|
| AVNN | 21.55 | 90.28 | 47.0 | 105.1 | Near Sisal, Yucatan, Mexico
| AVAL | 21.34 | 89.34 | 52.5 | 6.1 | Telchac Puerto, Yucatan, Mexico
| %IMP | -275% | 94%
|
| GFNO | 22.01 | 87.22 | 27.5 | 228.8 | Well north of Yucatan, Mexico
| GFAL | 22.50 | 87.15 | 26.5 | 258.6 | Well north of Yucatan, Mexico
| %IMP | -6% | -13%
|
|
26/0600 UTC 29.1N 90.3W Just west of Grand Isle, LA 126 h into the forecast
| MODEL | LAT | LON | TIME | ERROR | LOCATION
|
| AVNN | No landfall forecast
| AVAL | No landfall forecast
| %IMP |
|
| GFNO | No landfall forecast
| GFAL | No landfall forecast
| %IMP
| | |||||||||||||||||||||||||||
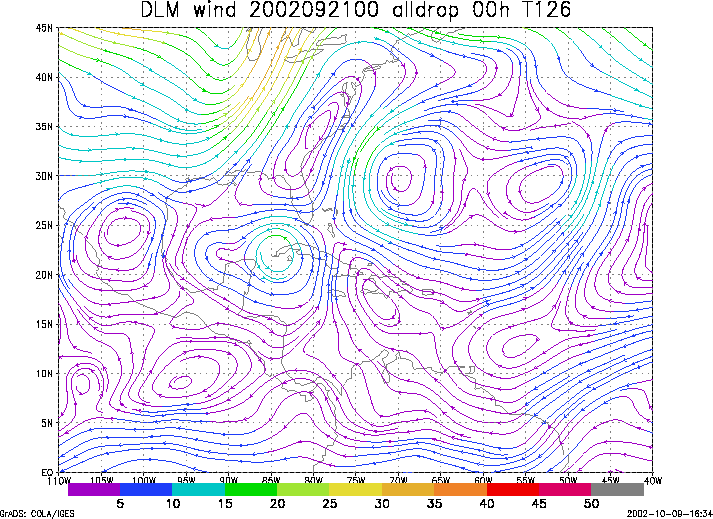
Figure 1. NCEP 850 - 200 hPa mean wind analysis for 21 September 2002 0000 UTC (Hurricane Isidore).
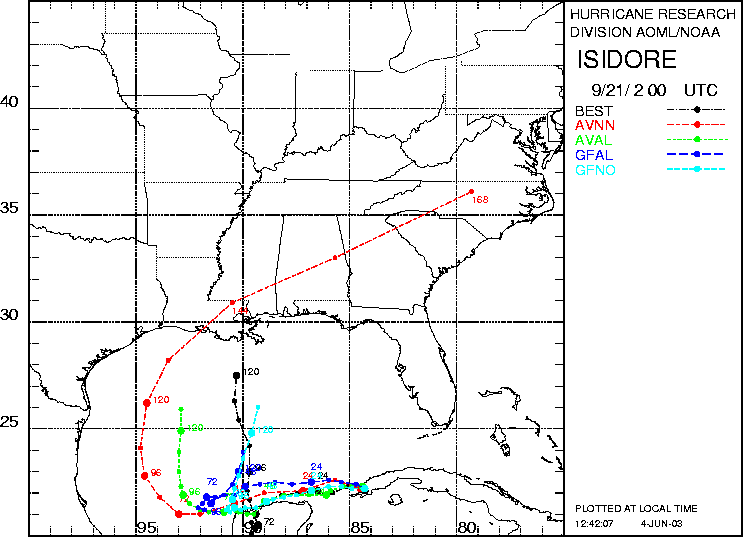
Figure 2. Track forecasts for the no dropwindsonde (NO or NN) and the all dropwindsonde (AL) runs for the AVN and GFDL models initialized on 21 September 2002 0000 UTC. The best track is shown in black.
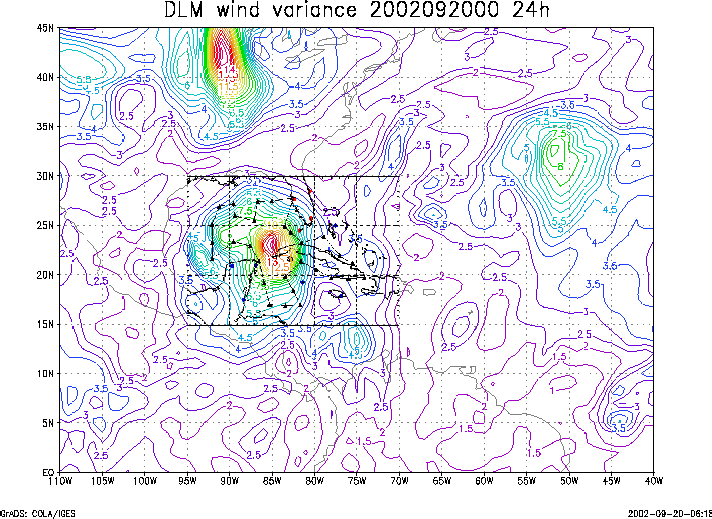
Figure 3. Ensemble perturbation variance at the nominal sampling time 21 September 2002 0000 UTC from the previous day NCEP ensemble forecast. The triangles represent the dropwindsonde locations.
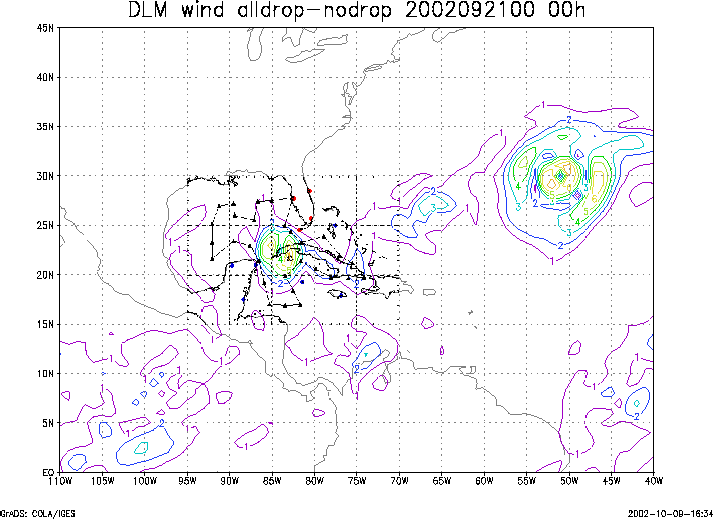
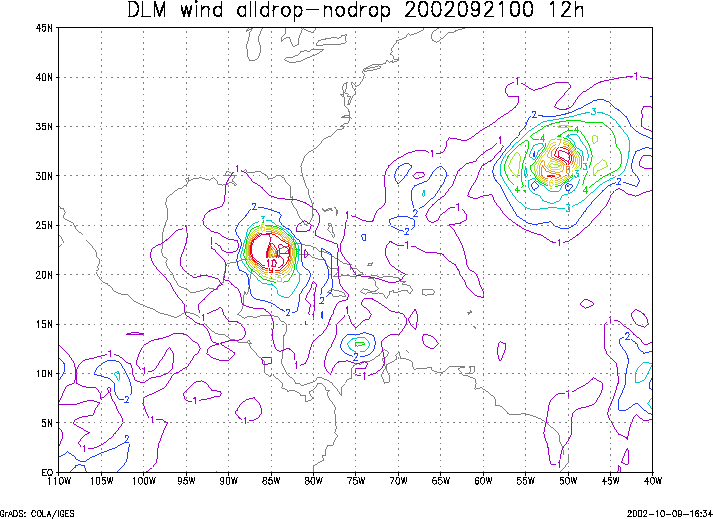
Figure 4. Initial condition differences in the 850 - 200 hPa mean wind between the no and all dropwindsonde cases for 21 September 2002 0000 UTC. The triangles represent the dropwindsonde locations.