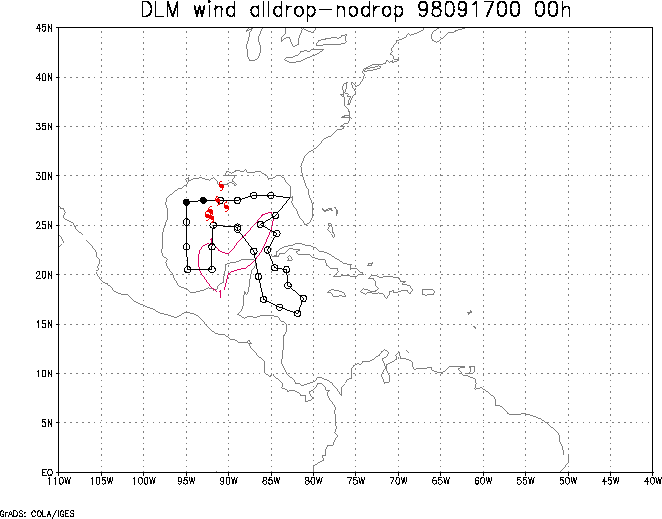
 Fig. 6 Initial condition differences in the vertically
averaged 850 - 200 hPa winds between the GSNO and GSAL cases, 17
September 1998 0000 UTC. The small hurricane symbols are the
locations of Hermine every 12 h previous and after the nominal
time. The dots represent the locations of dropwindsonde
observations.
Fig. 6 Initial condition differences in the vertically
averaged 850 - 200 hPa winds between the GSNO and GSAL cases, 17
September 1998 0000 UTC. The small hurricane symbols are the
locations of Hermine every 12 h previous and after the nominal
time. The dots represent the locations of dropwindsonde
observations.
Return to Hermine assessment.