Effects of Synoptic Surveillance on model forecasts for
10 September 2002 0000 UTC
GUSTAV.
Quicktime movie of AVN DLM wind model
forecast
Quicktime movie of DLM wind data
increment
| TRACK (km) | ||||||||||||||||||||||||||||||||||||||||||||||||||||||||||||||||||||||||||||||||||||||||||||||||||||||||||||||||||||||||||||||||||||||||||||||||||||||||||||||||||||||||||||||||||||||||||||||
| MODEL | 12 h | 24 h | 36 h | 48 h | 60 h | 72 h | 84 h | 96 h | 108 h | 120 h
|
| AVNN | 43. | 14. | 14. |
| AVNO | 64. | 29. | 29. |
| %IMP | -49% | -107% | -107%
|
| GFNO | 100. | 200. | 260. | 445. | 312. | 342. | 505. | 519.
| GFAL | 108. | 149. | 194. | 384. | 335. | 513. | 732. | 831.
| %IMP | -8% | 26% | 25% | 14% | -7% | -50% | -45% | -60%
| INTENSITY (kt)
| MODEL | 12 h | 24 h | 36 h | 48 h | 60 h | 72 h | 84 h | 96 h | 108 h | 120 h
|
| AVNN | -19. | -25. | -36. |
| AVNO | -15. | -22. | -33. |
| %IMP | 21% | 12% | 8%
|
| GFNO | -13. | 6. | -4. | 11. | 24. | 9. | 17. | 61.
| GFDL | -7. | -8. | 2. | 12. | 23. | 0. | -1. | 3.
| %IMP | 46% | -33% | 50% | -9% | 4% | 100% | 94% | 95%
|
| SHNO | -4. | -1. | -8. | -15. | 6. | 9. | 18. | 23. | 30. | 34.
| SHIP | -3. | 1. | -4. | -8. | 15. | 16. | 23. | 22. | 23. | 20.
| %IMP | 25% | 0% | 50% | 47% | -150% | -78% | -28% | -4% | 23% | 41%
|
| DSNO | -4. | -1. | -8. | -15. | 6. | 9. | 18. | 23. | 30. | 34.
| DSHP | -3. | 1. | -4. | -8. | 15. | 16. | 23. | 22. | 23. | 20.
| %IMP | 25% | 0% | 50% | 47% | -150% | -78% | -28% | -4% | 23% | 41%
| | ||||||||||||||
| 12/0430UTC 45.6N 60.4W Near Kelpy Cove, Nova Scotia 52.5 h into forecast | ||||||||||||||||||||||||||||||||||||||||||||||||||||||||||||||||||||||||||||||
| MODEL | LAT | LON | TIME | ERROR | LOCATION
|
| AVNN | No landfall forecast
| AVAL | 45.09 | 58.80 | 55.5 | 137.2 | Near Sydney, NS
| %IMP |
|
| GFNO
| GFAL | 46.62 | 54.56 | 61.5 | 463.9 | Near St. Bride's, NFLD
| %IMP | 28% | -3%
|
|
12/0900UTC 47.6N 58.6W Rose-Blanche-Harbour le Cou, NFLD 57 h into forecast
| MODEL | LAT | LON | TIME | ERROR | LOCATION
|
| AVNN | No landfall forecast
| AVAL | 46.80 | 55.71 | 59.5 | 235.7 | Allan's Island, NFLD
| %IMP |
|
| GFNO
| GFAL | 46.62 | 54.56 | 61.5 | 324.3 | Near St. Bride's, NFLD
| %IMP | 44% | 8%
| | |||||||||||||||||||||
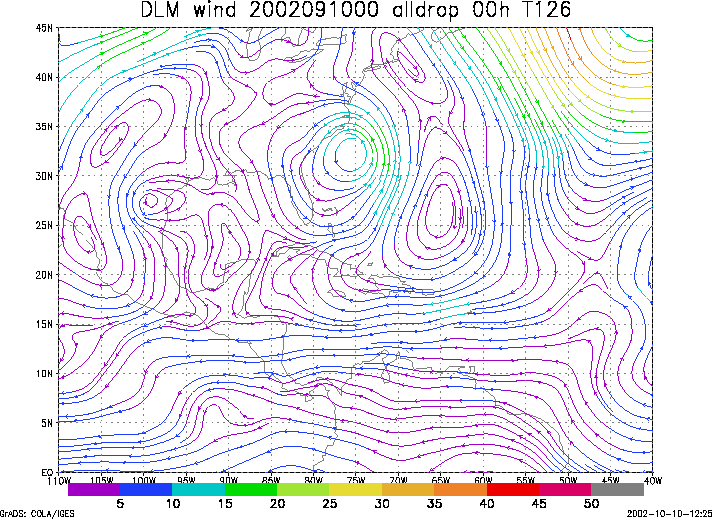
Figure 1. NCEP 850 - 200 hPa mean wind analysis for 10 September 2002 0000 UTC (Tropical Storm Gustav).
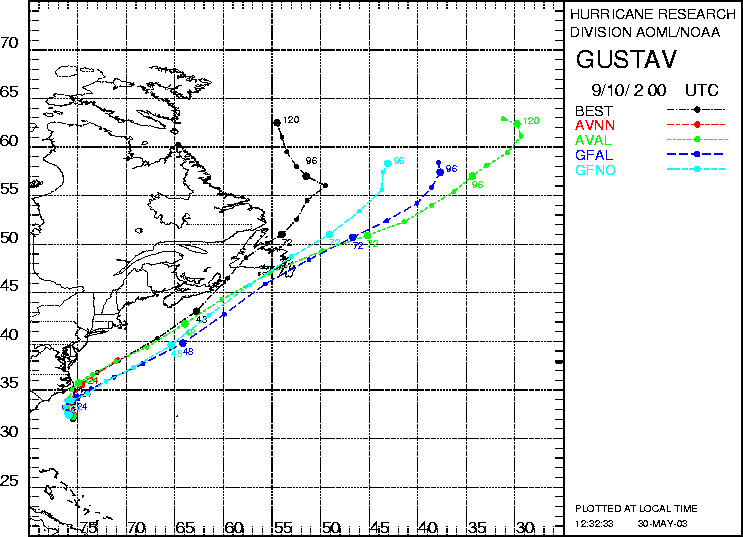
Figure 2. Track forecasts for the no dropwindsonde (NO or NN) and the all dropwindsonde (AL) runs for the AVN and GFDL models initialized on 10 September 2002 0000 UTC. The best track is shown in black.
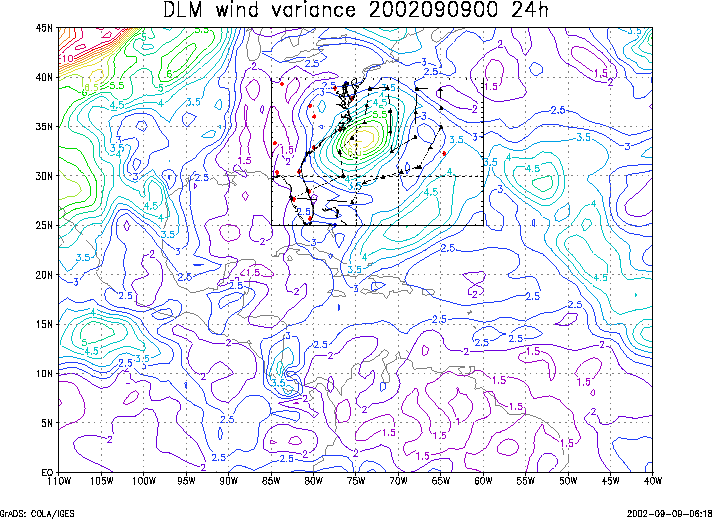
Figure 3. Ensemble perturbation variance at the nominal sampling time 10 September 2002 0000 UTC from the previous day NCEP ensemble forecast. The green circles represent the dropwindsonde locations.
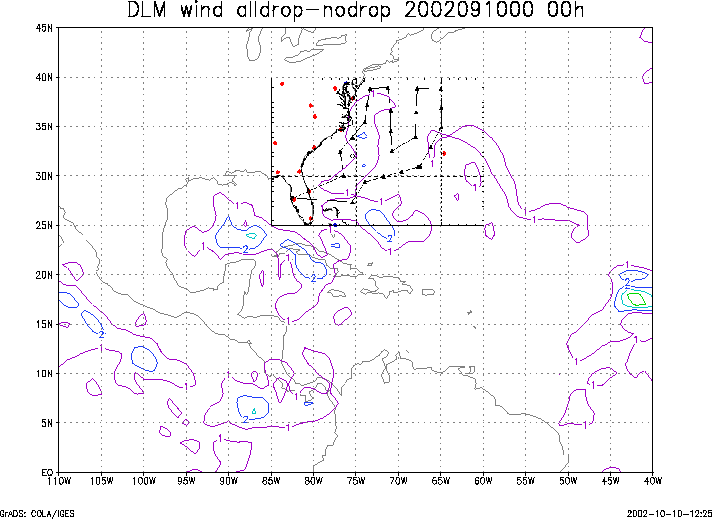
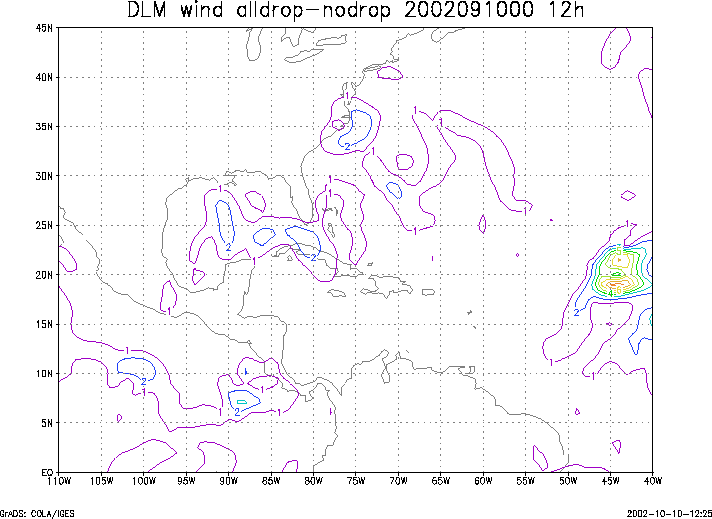
Figure 4. Initial condition differences in the 850 - 200 hPa mean wind between the no and all dropwindsonde cases for 10 September 2002 0000 UTC. The green circles represent the dropwindsonde locations.