Effects of Synoptic Surveillance on model forecasts for
17 July 2005 1200 UTC
Emily.
Quicktime movie of AVN DLM wind model
forecast
Quicktime movie of DLM wind data
increment
| TRACK (km) | ||||||||||||||||||||||||||||||||||||||||||||||||||||||||||||||||||||||||||||||||||||||||||||||||||||||||||||||||||||||||||||||||||||||||||||||||||||||||||||||||||||||||||
| MODEL | 12 h | 24 h | 36 h | 48 h | 60 h | 72 h | 84 h | 96 h | 108 h | 120 h
|
| AVNN | 126 | 205 | 253 | 218 | 175 | 206 | 302 | 428 | |
| AVNO | 57 | 94 | 118 | 55 | 60 | 152 | 260 | 420 | |
| %IMP | 55% | 54% | 53% | 75% | 66% | 26% | 14% | 2% | |
|
| GFNO | 53 | 76 | 63 | 75 | 91 | 163 | 274 | | |
| GFDL | 53 | 100 | 112 | 134 | 158 | 314 | 465 | | |
| %IMP | 0% | -32% | -78% | -79% | -74% | -93% | -70% | | |
|
| INTENSITY (kt)
| MODEL | 12 h | 24 h | 36 h | 48 h | 60 h | 72 h | 84 h | 96 h | 108 h | 120 h
|
| AVNN | -81 | -29 | -41 | -48 | -79 | -79 | -32 | -10 | |
| AVNO | -68 | -7 | -21 | -22 | -58 | -72 | -28 | -14 | |
| %IMP | 16% | 76% | 49% | 54% | 29% | 9% | 12% | -12% | |
|
| GFNO | 4 | 17 | 19 | 12 | -12 | -62 | -2 | | |
| GFDL | -1 | 2 | 11 | 5 | -19 | -76 | -11 | | |
| %IMP | 75% | 88% | 42% | 58% | -58% | -23% | -450% | | |
|
| | ||||||||||
| 18/0630 UTC 20.3N 87.4W Near Tulum, Mexico, 18.5 h into the forecast | ||||||||||||||||||||||||||||||||||||||||||||||||||||||||||||||||||||||||||||||||||||||||||
| MODEL | LAT | LON | TIME | ERROR | LOCATION
|
| AVNN | 19.58 | 87.50 | 13.5 | 80.7 | Santa Rosa, Qintana Roo, Mexico
| AVNO | 20.25 | 87.50 | 16.0 | 11.8 | Tulum, Qintana Roo, Mexico
| %IMP | 50% | 85%
|
| GFNO | 20.00 | 87.43 | 16.0 | 33.5 | Boca Paila, Qintana Roo, Mexico
| GFDL | 19.80 | 87.53 | 16.5 | 57.2 | Vigia Chico, Qintana Roo, Mexico
| %IMP | 20% | -71%
|
|
20/1200 UTC 24.8N 97.6W Near San Fernando, Mexico, 72.0 h into the forecast
| MODEL | LAT | LON | TIME | ERROR | LOCATION
|
| AVNN | 23.05 | 97.73 | 69.5 | 194.9 | Rancho de Piedra, Tamaulipas, Mexico
| AVNO | 25.38 | 97.51 | 66.5 | 65.1 | Isla Larga, Tamaulipas, Mexico
| %IMP | -120% | 67%
|
| GFNO | 24.55 | 97.79 | 64.5 | 33.8 | Punto de Piedra, Tamaulipas, Mexico
| GFDL | 24.01 | 97.71 | 60.5 | 88.5 | Las Guayabas, Tamaulipas, Mexico
| %IMP | -53% | -162%
| | |||||||||||||
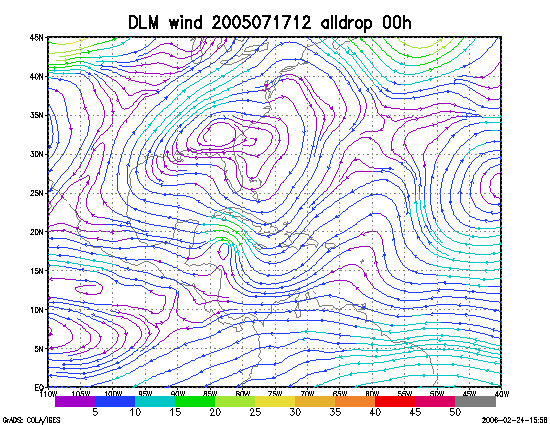
Figure 1. NCEP 850 - 200 hPa mean wind analysis for 17 July 2005 1200 UTC (Hurricane Emily).
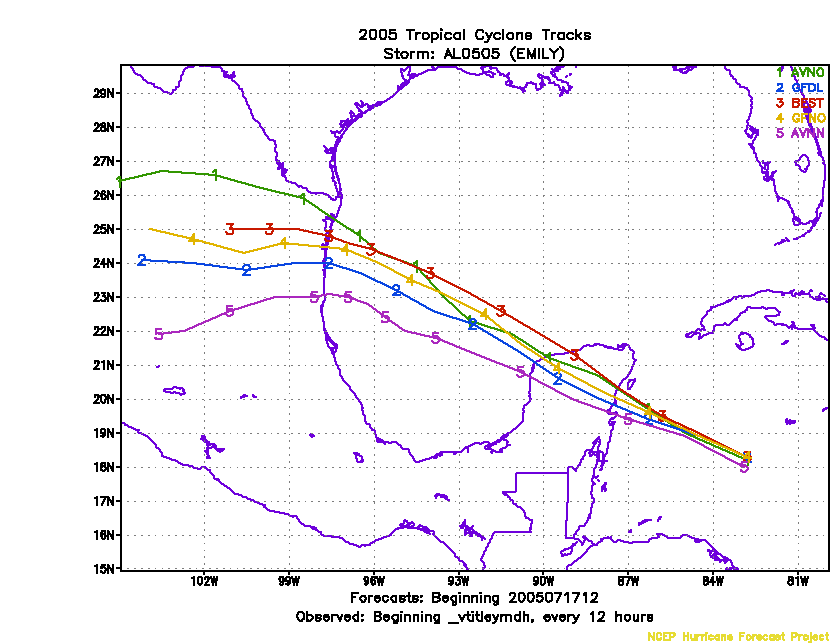
Figure 2. Track forecasts for the no dropwindsonde (NO or NN) and the all dropwindsonde (AL) runs for the AVN and GFDL models initialized on 17 July 2005 1200 UTC.
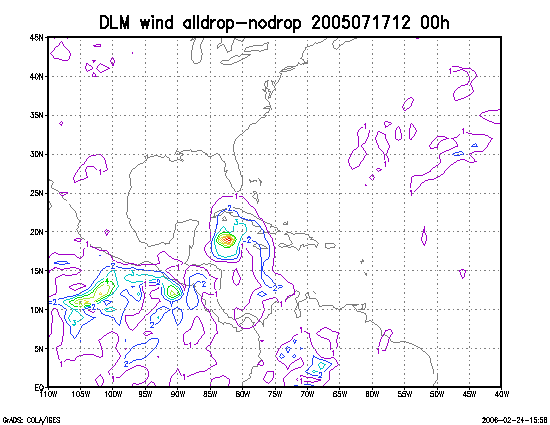
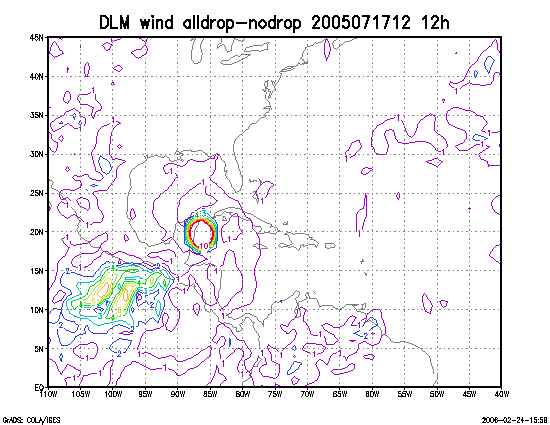
Figure 3. Initial condition differences in the 850 - 200 hPa mean wind between the no and all dropwindsonde cases for 17 July 2005 1200 UTC.