Effects of Synoptic Surveillance on model forecasts for
06 July 2005 1800 UTC
Dennis.
Quicktime movie of AVN DLM wind model
forecast
Quicktime movie of DLM wind data
increment
| TRACK (km) | ||||||||||||||||||||||||||||||||||||||||||||||||||||||||||||||||||||||||||||||||||||||||||||||||||||||||||||||||||||||||||||||||||||||||||||||||||||||||||||||||||||||||||
| MODEL | 12 h | 24 h | 36 h | 48 h | 60 h | 72 h | 84 h | 96 h | 108 h | 120 h
|
| AVNN | 56 | 15 | 30 | 63 | 76 | 144 | 199 | 285 | 342 | 425
| AVNO | 33 | 46 | 71 | 124 | 116 | 197 | 194 | 300 | 382 | 506
| %IMP | 41% | -207% | -137% | -97% | -53% | -37% | 3% | -5% | -12% | -19%
|
| GFNO | 35 | 69 | 98 | 99 | 114 | 102 | 102 | 169 | 244 | 335
| GFDL | 11 | 31 | 62 | 93 | 103 | 93 | 74 | 115 | 191 | 255
| %IMP | 69% | 55% | 37% | 6% | 10% | 9% | 27% | 32% | 22% | 24%
|
| INTENSITY (kt)
| MODEL | 12 h | 24 h | 36 h | 48 h | 60 h | 72 h | 84 h | 96 h | 108 h | 120 h
|
| AVNN | -40 | -55 | -69 | -79 | -27 | -43 | -79 | -63 | 18 | 6
| AVNO | -36 | -50 | -49 | -76 | -20 | -32 | -56 | -34 | 25 | 7
| %IMP | 10% | 9% | 29% | 4% | 26% | 26% | 29% | 46% | -39% | -17%
|
| GFNO | 1 | 9 | 6 | 13 | 44 | 22 | -21 | -12 | 50 | 20
| GFDL | 6 | -7 | 6 | 5 | 39 | 16 | -26 | -14 | 48 | 11
| %IMP | -500% | 22% | 0% | 62% | 11% | 22% | -136% | 60% | 87% | und%
|
| | ||||||||||
| 08/0245 UTC 19.9N 77.6W Punta del Ingles, Cuba, 32.75 h into the forecast | ||||||||||||||||||||||||||||||||||||||||||||||||||||||||||||||||||||||||||||||||||||||||||||||||||||||||||||||||||||||||||||||||||||||||||
| MODEL | LAT | LON | TIME | ERROR | LOCATION
|
| AVNN | 19.79 | 77.75 | 34.0 | 19.9 | Near Niquero, Granma, Cuba
| AVNO | 19.55 | 77.88 | 31.5 | 48.7 | Near Niquero, Granma, Cuba
| %IMP | 0% | -145%
|
| GFNO | 18.40 | 77.06 | 26.5 | 176.0 | Ocho Rios, Jamaica
| GFDL | 19.65 | 77.86 | 31.0 | 38.9 | Near Niquero, Granma, Cuba
| %IMP | 72% | 78%
|
|
08/1845 UTC 22.1N 80.7W just west of Punta Mangles Altos, Cuba, 48.75 h into the forecast
| MODEL | LAT | LON | TIME | ERROR | LOCATION
|
| AVNN | 22.10 | 81.20 | 48.0 | 51.5 | Near Cienfuegos, Cienfuegos, Cuba
| AVNO | 21.62 | 81.43 | 46.0 | 92.2 | Cayo Largo, Cuba
| %IMP | -267% | -79%
|
| GFNO | 21.54 | 81.57 | 50.0 | 109.2 | Cayo Largo, Cuba
| GFDL | 22.18 | 81.78 | 49.5 | 111.5 | Near La Fe, Isla de la Juventud, Cuba
| %IMP | 80% | -2%
|
10/1930 UTC 30.4N 87.1W Santa Rosa Island, FL, 97.5 h into the forecast
| MODEL | LAT | LON | TIME | ERROR | LOCATION
|
| AVNN | 29.24 | 89.52 | 105.0 | 266.5 | Buras, LA
| AVNO | 29.13 | 90.25 | 103.0 | 335.0 | Grand Isle, LA
| %IMP | 42% | -26%
|
| GFNO | 30.32 | 88.44 | 107.5 | 128.8 | Pascagoula, MS
| GFDL | 30.26 | 87.85 | 104.0 | 73.6 | Gulf Shores, AL
| %IMP | 35% | 43%
| | ||||||||||||||||||||||

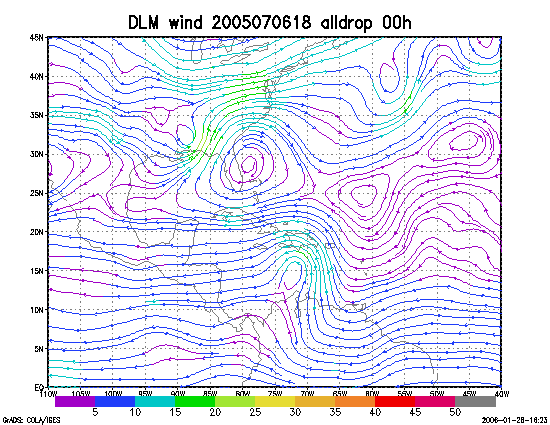
Figure 1. NCEP 850 - 200 hPa mean wind analysis for 06 July 2005 1800 UTC (Tropical Storm Dennis).

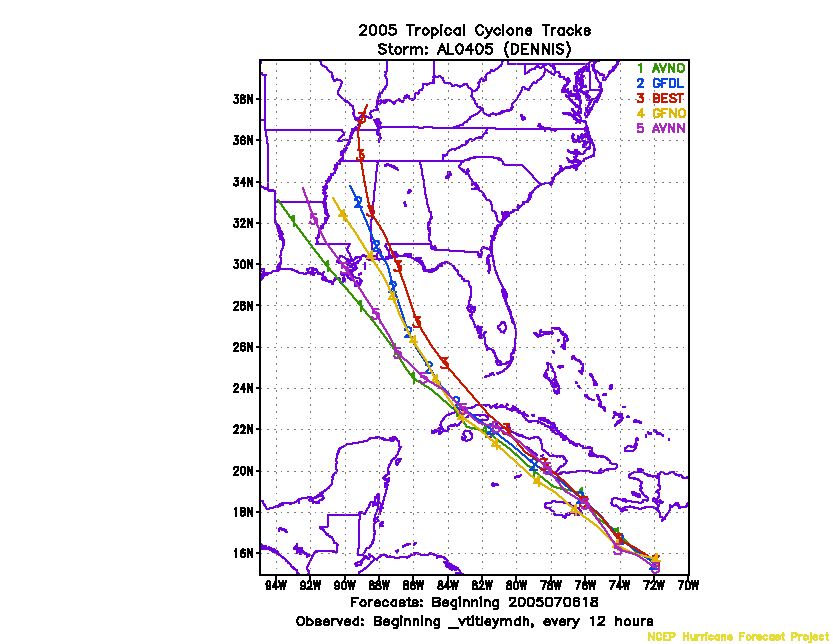
Figure 2. Track forecasts for the no dropwindsonde (NO or NN) and the all dropwindsonde (AL) runs for the AVN and GFDL models initialized on 06 July 2005 1800 UTC.

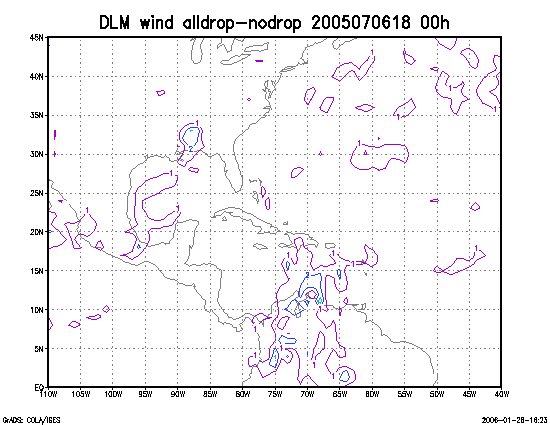
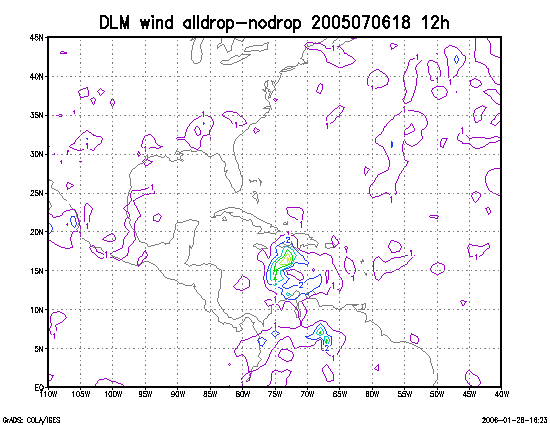
Figure 3. Initial condition differences in the 850 - 200 hPa mean wind between the no and all dropwindsonde cases for 06 July 2005 1800 UTC.
