Effects of Synoptic Surveillance on model forecasts for
15 July 2003 1200 UTC
Claudette.
Quicktime movie of GFS DLM wind model
forecast
Quicktime movie of DLM wind data
increment
| TRACK (km) | ||||||||||||||||||||||||||||||||||||||||||||||||||||||||||||||||||||||||||||||||||||||||||||||||||||||||||||||||||||||||||||||||
| MODEL | 12 h | 24 h | 36 h | 48 h | 60 h | 72 h | 84 h | 96 h | 108 h | 120 h
|
| GFSN | 77 | 69 | 145 | 226
| GFSO | 37 | 56 | 164 | 182
| %IMP | 52% | 19% | -13% | 19%
|
| GFNO | 53 | 77 | 138 | 133
| GFDL | 35 | 69 | 141 | 167
| %IMP | 34% | 10% | -2% | -26%
| INTENSITY (kt)
| MODEL | 12 h | 24 h | 36 h | 48 h | 60 h | 72 h | 84 h | 96 h | 108 h | 120 h
|
| GFSN | -24 | -20 | -14 | -14
| GFSO | -22 | -16 | -12 | -12
| %IMP | 8% | 20% | 14% | 14%
|
| GFNO | 10 | 3 | 19 | 3
| GFDL | 11 | 3 | 15 | 4
| %IMP | -10% | 0% | 21% | -33%
|
| SHNO | 15 | 32 | 40 | 45
| SHIP | 16 | 34 | 42 | 47
| %IMP | -7% | -6% | -5% | -4%
|
| DSNO | -7 | -3 | -2 | 2
| DSHP | -7 | -3 | -2 | 2
| %IMP | 0% | 0% | 0% | 0%
| | ||||||||||
| 15/1530 UTC 28.3N 96.2W Matagorda Island, TX 3.5 h into the forecast | |||||||||||||||||||||||||||||||||||||||||
| MODEL | LAT | LON | TIME | ERROR | LOCATION
|
| GFSN | 27.88 | 97.81 | 9.5 | 164.6 | Corpus Christi, TX
| GFSO | 28.26 | 96.58 | 6.0 | 37.4 | Port Aransas, TX
| %IMP | 58% | 77%
|
| GFNO | 28.18 | 96.69 | 6.0 | 49.8 | Spanish Village, TX
| GFDL | 28.26 | 96.63 | 5.0 | 42.3 | Spanish Village, TX
| %IMP | 40% | 15%
| | ||||

Figure 1. NCEP 850 - 200 hPa mean wind analysis for 15 July 2003 1200 UTC (Hurricane Claudette).

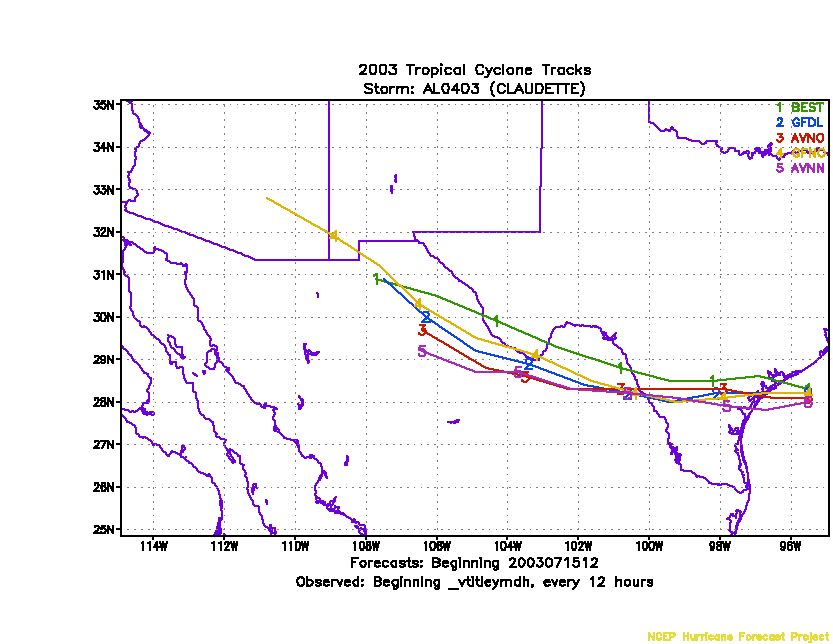
Figure 2. Track forecasts for the no dropwindsonde (NO or NN) and the all dropwindsonde (AL) runs for the GFS and GFDL models initialized on 15 July 2003 1200 UTC.

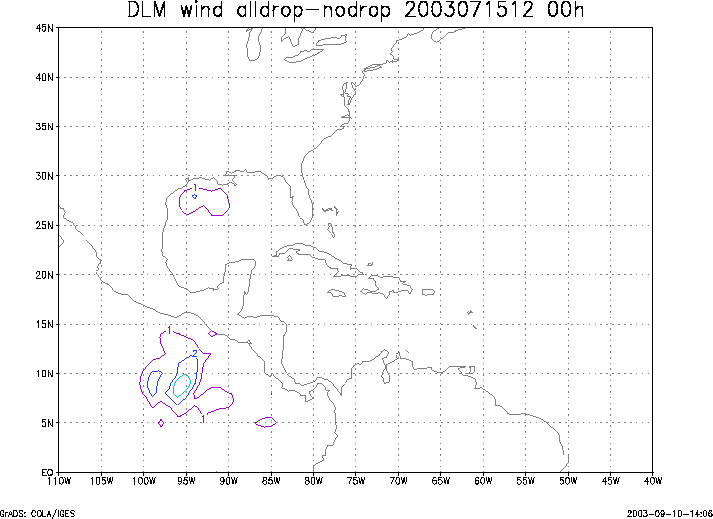
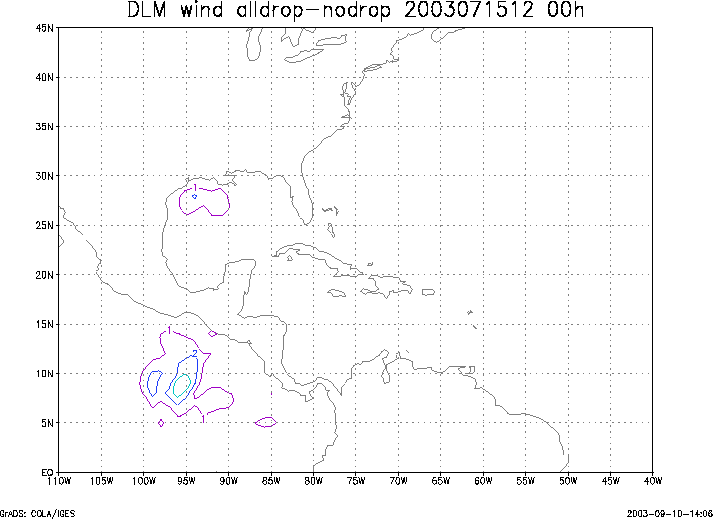
Figure 3. Initial condition differences in the 850 - 200 hPa mean wind between the no and all dropwindsonde cases for 15 July 2003 1200 UTC.
